Currency crisis and external fragility: a
Minskyan interpretation applied to the Brazilian
economy between 1999 and 2013
Crises cambiais e fragilidade externa: uma interpretação minskyana aplicada à economia brasileira entre 1999 e 2013
Resumo
Este trabalho possui dois objetivos. O primeiro é desenvolver uma interpretação sobre o processo gerador de crises cambiais e seus determinantes, tendo como base a hipótese de fragilidade fi nanceira de Minsky. A deterioração da estrutura fi -nanceira externa de uma economia é identifi cada como o fator responsável por elevar sua suscetibi-lidade a crises cambiais. A partir desta interpre-tação, são construídos indicadores de fragilidade externa visando mensurar a suscetibilidade de uma economia sofrer uma crise cambial. O segun-do objetivo deste estusegun-do é avaliar a evolução da fragilidade externa da economia brasileira entre 1999 e 2013 por meio da aplicação dos indicado-res e da interpretação desenvolvidos na primeira parte do trabalho. Os resultados sugerem que a fragilidade externa brasileira sofreu gradual e signifi cativa redução e tende a seguir trajetória estável nos próximos anos.
Palavras-chave
Minsky; crises cambiais; fragilidade externa; eco-nomia brasileira.
Códigos JELF31; F32; F34; F40. Victor Hugo Rocha Sarto
Universidade Estadual Paulista “Júlio de Mesquita Filho” Luciana Togeiro de Almeida
Universidade Estadual Paulista “Júlio de Mesquita Filho”
Abstract
This work has two goals. The fi rst one is to develop an interpretation for open economies founded on Minsky’s fi nancial fragility hypothesis about the process of a currency crisis and its determinants. The deterioration of an economy’s external fi nancial structure is identifi ed as the reason for the increase of its crisis susceptibility. With this approach, we create external fragility indexes intending to measure an economy’s crisis susceptibility. Our second objective is to evaluate the Brazilian external fragility between 1999 and 2013 using the index and the interpretation previously developed. The results suggest that Brazilian’s external fragility suffered a gradual and signifi cant decrease and tends to follow stable trend in the coming years.
Keywords
Minsky; currency crisis; external fragility; Brazilian economy.
1
Introduction
In the last thirty years, currency crisis has become a frequent phenom-enon in both developed and emerging nations, with effects that have been gaining more power to generate damages in the fi nancial and production systems of these nations, and a growing potential of global contamination. (Arestis; Paula, 2008; Griffi th-Jones; Ocampo; Stiglitz, 2010).
For these reasons, studies dedicated to measure the tendency for coun-tries to suffer with currency crisis have earned the spotlights in the litera-ture, especially after the 2008 international crisis.
In Brazil, the debate about the national external fragility can be divided, generally speaking, in two opposing strands. On one side, there are argu-ments in defense of the proposition that the Brazilian economy acquired, in the last decade, a bigger resistance to currency crisis. This would be the result of structural and macroeconomic reforms adopted since 1994, an appropriate management of macroeconomic policy and a quality external insertion before a global economy with a new setting to the country.
These factors made the external account more solid, especially with commodities external trade and better access to external funding, with the high infl ux of long-term investments attracted by omit domestic dy-namism, macroeconomic soundness and the country’s credibility earned with the international market. (Barros, 2008a; 2008b; Franco, 2008; Lac-erda, 2009; Coutinho, 2010; BCB, 2013a).
Generally, defenders of this proposition lean their arguments on the combination of three evidences: the improvement of traditional indexes of foreign debt since 1999; the sharp drop movement of the risk-Brazil from 2003 and obtaining investment grade rating by international agencies since 2008; and the unprecedented ability demonstrated by the country in resisting the turbulence generated by the international crisis of 2008, when the economy experienced a modest decline in Gross Domestic Product (GDP) in 2009, with rapid recovery in 2010 (Prates; Cunha; Lélis, 2011; BCB, 2013a; 2013b).
translates the capacity for long-term resistance of the country, expressed by specifi c features, such as the productive structure1, foreign trade standard, systemic effi ciency, technological dynamism and fi nancial and institutional strength (Carneiro, 2010; Carcanholo, 2010; Gentil; Araújo, 2012).
For this line of argument, the assembly of these structural features, in Brazil, produces a pattern of poor external insertion manifested in three ways. First, with the tendency to Current Account (CA) defi cits. Second, the deterioration of the composition of foreign debts by the increasing share of short-term capital and high liquidity. And third, the high volatility of ex-change rates and interest rates. To its proponents, the international crisis of 2008 made clear the high Brazilian external fragility, given the clear manifes-tation of these three sets of factors after its advent (Gonçalves, 2012).
This work aims to contribute to the literature about currency crisis, and to the empirical debate about the recent evolution of Brazilian external fragility in two ways. First, we elaborate on an interpretation for open economies of the fi nancial fragility hypothesis, of Minsky, about the gen-erating process of these crises and their determinants. To fulfi ll this goal, the author’s ideas are brought to the reality of international economy. The quantitative and qualitative deterioration of external wealth of an econ-omy is identifi ed as the factor responsible for raising its susceptibility to currency crises, when affecting international funding conditions available for the fulfi llment of its commitments to non-residents.
Based on this interpretation, external fragility indexes are constructed to cover as much cyclical and short-term features of a country’s external sector, comprehended in the results of its Balance of Payments (BOP), as the structural and long-term features manifested in the composition of its debts and foreign assets.
Our second goal consists in assessing the Brazilian external fragility be-tween 1999 and 2013 by the application of the indexes and the interpreta-tion previously developed to that referred country.
This work is structured in three other sections besides this introduction. Section 2 is dedicated to the theoretical study proposed in the fi rst goal. In section 3, the evolution of Brazilian external fragility is evaluated. Finally, for the conclusion, in Section 4, are woven some concluding remarks.
2
The fi nancial fragility hypothesis of Minsky and the
external sector of national economies
This section aims to develop an interpretation for open economies of the fi nancial fragility hypothesis of Minsky about the generating process of currency crisis and its determinants.
For that, initially, we work with some basic concepts of the fi nancial fra-gility hypothesis (2.1). In the following subsection (2.2), the concept of ex-ternal fragility and the Minskyan interpretation proposed by this work are developed. From that, we build two general indexes of external fragility, and they unfold in two other specifi c indexes, the fi rst one cyclical and, the sec-ond, structural, described, respectively, in omit subsections 2.2.1 and 2.2.2.
2.1 Financial fragility hypothesis
Minsky (2010) develops the concept of fi nancial fragility as a measure of the capacity of an economy to face shocks in fi nancing conditions without a widespread dislocation of payment fl ows between agents. This defi ni-tion comes from the noni-tion of fragility as a result of the set of features of the fi nancial structures of units comprising the economy, generically defi ned by (Tonveronachi, 2006, p. 24):
According to Minsky, every economic unit is characterized by a set of features inherited from the past, possessing signifi cant degrees of rigidity. This inheritance may be summed up as consisting, on the one hand, of the stocks of physical, fi nancial and immaterial capital, and on the other side, of contractual obligations, among which is a given debt structure. The various forms of capital are the source of future expected incomes (here considered net of the costs necessary to sustain the position), while the debt is the source of fi nancial outfl ows.
The fi nancial structure of a unit is a consequence of its historically accumulat-ed cash fl ow result, which can be expressaccumulat-ed by the following equation (ibid.):
where, Yn is net operating revenue (quasi-rents);
Yf are the net returns from owing fi nancial assets;
1 1
ni fi i i i i Y Y L r D MD
1,...,
i n
L are net assets that are held in excess within normal operations;
r is the interest rate that affects debts D; and MD are expenses with D amortizations.
The values obtained in equation (1) for each period result from the com-bination of planning and expectation, as economic units operate through the system money-today / money-tomorrow. Money-today, obtained to fi nance the purchase of goods or activities, must be validated by future income expected from the ownership of these assets, which, in turn, de-pends on the performance of the unit and the economy.
Therefore, whenever operating income and net returns from the own-ership of assets exceed the interest expenses and amortization of assumed debt, the unit is in a liquid position, with surpluses and accumulation of new assets. When the opposite occurs, the situation of illiquidity requires the sale, with the corresponding value, of stocks from previously accumu-lated assets or the acquisition of new loans in the fi nancial market.
The capacity of a unit to sustain its fi nancial structure for each period is defi ned by its solvency positions, expressed by the equation (2) (ibid.):
where, NC is the net value of the forms of capital;
KY is the present value of the expected total net gains (quasi-rents);
and KD is the present value of the forms of debt.
The unit is in its solvent position while NC is positive, a situation which depends on the terms of fi nancing offered by the markets, which, in turn, vary depending on the expected return on assets of this unit. According to Minsky (2010, p. 284), “[...] prospective profi tability of collections of capi-tal assets under the control of a fi rm is critical in determining investment, for it determines whether the production and ownership of capital assets are fi nanced”.
Capital assets are valuable because they generate profi ts. So, its mar-ket price and the interest of agents in acquiring it, enabling the fi nancing and the solvency position of the respective unit which owns them, refl ect the present expectations on future profi ts and how these profi ts are trans-formed into present values.
i i i i
In this sense, a unit becomes insolvent when its structure cannot be funded neither by internal nor by external borrowing resources, given the unwillingness of markets in fi nancing structures in which prospective prof-itability, costs and risks produce the expectation of not receiving the ex-pected returns over the values applied. This results in a cash fl ow crisis at the unit and is a key-element for understanding the process of unleashing fi nancial instability in capitalist economies2.
The characteristics of the fi nancial structures of the units, defi ning their liquidity and solvency status, depend on the fi nancial arrangements ad-opted by them. The Minskyan taxonomy defi nes three types of schemes: hedge, speculative and Ponzi.
Units that use hedge fi nancing: “[...] expect the cash fl ow from operat-ing capital assets (or from ownoperat-ing fi nancial contracts) to be more than suf-fi cient to meet contractual payment commitments now and in the future” (ibid., p. 287).
Hedge positions are subjected only to operational risks. Diffi culties to honor their debts might result from a revenue decline or increased costs in relation to what was expected3. Thus, their safety margins are suffi cient to ensure the liquidity position at all times.
Units using the speculative fi nancing: “[...] expect the cash fl ows to the unit from operating assets (or from owning fi nancial contracts) to be less than the cash payment commitments in some, typically near-term, peri-ods” (ibid., p. 287).
Speculative positions are subjected to both fi nancial and operational risks. These units expect their receipts in periods subsequent to the initial phase of illiquidity to exceed their acquired obligations. In the meantime, the funds to pay off outstanding debts come from refi nancing. The condi-tions offered by the markets in the contract of these new debts infl uence the future payments and, therefore, unexpected changes in them can turn illiquidity into insolvency, depending on the unit’s safety margins. The size of these margins also affect the fi nancing conditions, as they infl uence risk and return expectations of investment projects.
2 In Minsky’s words (1982b, p. 13): “[...] the critical element in explaining why fi nancial instability occurs is the development over historical time of liabilities structures that cannot be validated by market-determined cash fl ows or asset values.”
Finally, units using Ponzi fi nancing (ibid., p. 288):
[...] for at least some near-term periods, the cash payment commitments on in-come account exceed the expected cash payment receipts on inin-come account. [...] for Ponzi fi nance units fi nancing costs are greater than income, so that the face amount of outstanding debt increases.
Ponzi positions are the most vulnerable to fi nancial market conditions, be-cause they need to refi nance their positions more frequently. Unfavorable changes in the pattern of payment terms or on credit standards offered by the markets more easily undertake the feasibility of this type of fi nancial arrangement (ibid.).
The evolution of fi nancial structures towards fragilization depends on opportunities and profi t expectations that induce the use of riskier fi nan-cial arrangements, which boost the capital gains, the pace of investment and thus the expansion of the economy.
Financial institutions, also motivated by optimism about profi ts, react to this process validating agents’ decisions of becoming increasingly in-volved in these schemes, by creating new sources of funding. Indeed, it creates the conditions for development of a euphoric economy.
The resulting investment boom overloads the national financial system by speculative and Ponzi schemes, which increase the amount of investments financed by loans, expanding the share of debt in the financial structure of the units, and drive the market for loans based on the exchange of long-term debt for short-term financing of owner-ship of assets and investments maturing. In other words, banks and companies are induced to a higher debt in the short term on favor-able expectations about the ways the economy will behave (Minsky, 1982a; 2010).
In this scenario, the units see their ability to validate obligations dis-pelled, being forced to liquidate their capital assets. Therefore, a general fall in the value of these assets starts to derail new investments and profi ts, leading the economy to a fi nancial crisis.
2.2 The fi nancial fragility hypothesis in open economies: the
exter-nal fragility
The biggest contributions of Minsky are from studies of closed economies, although the author himself considers the importance of interpretations, from his approach, to open economies (Arestis; Sawyer, 2000). Indeed, several studies have sought to use such an approach to understanding the causes of currency crises, especially in developing countries (Gray; Gray, 1994; Lopez, 1997; Dymski, 1998; Paula; Alves Jr., 1999; Arestis; Glick-man, 2002; Kregel, 2004; Tonveronachi, 2006; Resende; Amado, 2007).
Relations between economic agents acquire greater complexity in an open environment. The solvency position of units that relate to foreigners, whether countries or active members of an economy, is not only related to its ability to honor its commitments, but to its ability to generate foreign debts to enable this payment, a problem that has a macroeconomic nature and transcends the issue of vulnerability analysis in the individual project (Resende; Amado, 2007). Under these conditions, international creditors observe both the project cash fl ow as what they perceive as the external vulnerability of the country on the availability of hard currency and, from there, establish their offer of resources and defi ne the required profi tability (Correa; Mollo; Biage, 2008).
Similar to the concept applied to the closed economy, the external fra-gility comes from the fi nancial structures of the units that compose an open economy and maintain relations with foreign countries. The results of these interactions, historically accumulated, defi ne the external wealth of the economy by the formation of stocks of assets and debts in foreign currency. Thus, the external sector of a country can be understood as a single economic unit, where BOP is its cash fl ow and external wealth de-fi nes its de-fi nancial structure.
par-ticular case, cyclical and structural changes in the domestic economy and the international system are refl ected on the external fi nancial structure of the evaluated country.
At the same time, the characteristics of the above structure provide ri-gidity for its operation. The degree of riri-gidity of this structure varies ac-cording to the degree of external fragility:
External vulnerability [or external fragility] means a low resilience of national economies facing destabilizing pressure factors or external shocks. The vulner-ability has two equally important dimensions. The fi rst involves the response options with the policy instruments available, and the second incorporates coping or adjustment costs in the face of external events (Baumann; Canuto; Gonçalves, 2004, p. 229).
In other words, the external fragility is the ability of a country to sustain its external fi nancial structure in time without a generalized disarticula-tion of BOP fl ows. The diffi culties in that vary according to its potential to raise the funds needed to meet its commitments to non-residents, a feature related to the size and composition of its fi nancial structure, which determine its degree of sensitivity to the fi nancing conditions offered by international markets for rolling its debts.
The balance of the external sector is ensured whenever the total de-mand for foreign currency is met by an offer at least equivalent to BOP’s requirements in each period. Instabilities in BOP result from a process in which the external fi nancing offer is insuffi cient to meet a demand gener-ally expanding. This is a situation which features the problem of Minsky’s fragility fi nancial hypothesis (2010) on the BOP of a country.
According to Mollo (1988, p. 108) “The problem for Minsky is nothing more than a demand problem of fi nancing means increasing in the face of an inelastic supply of fi nancing.”. Thus, the inability to raise suffi cient amounts of resources to meet demand is the factor responsible for trigger-ing instabilities and crises in the external sector of the economy.
their expectations of an economy, the agents consider all those domestic and international elements that affect or may affect the risk return ratio expected from the acquisition or fi nancing of assets in it. Admitting Min-sky’s argument about money supply endogenously determined by mar-kets, through fi nancial innovations, we have that, while investor optimism about BOP’s ability to produce expected foreign exchange persists, there will be no restrictions on the supply of fi nancing, even in the face of an expanding demand.
Initially, as suggested by equation (2) applied to our analytical model, in periods of high confi dence of foreign investors on the present value of the expected returns of their investment in a country, the BOP refi nancing of the latter by foreign capital lies assured and thus the balance between supply and demand for foreign exchange is guaranteed.
By this interpretation, the mismatch between supply and demand for the amount of foreign currency needed to balance the BOP accounts results from changes in the subjective preferences of their foreign fi nanciers. The degree of optimism of these agents should deteriorate due to the growth of external fragility of the reporting country, especially when associated with any domestic or international disturbing event capable of arousing their suspicion on this economy.
Greater external fragility changes the expectations of the agents in-volved in the fi nancing of BOP because, before the worsening of the sol-vency condition of the external sector, the lender’s and debtor’s risks rise while the return prospects on capital are reduced in this country. The result is a worsening of fi nancing conditions in terms of costs and availability of funds, just as the deteriorating external fi nancial structure demands foreign refi nancing in larger quantities. Hence, as it decreases the country’s ability to sustain its external accounts, the BOP imbalances become more likely and their real and fi nancial consequences tend to be bigger. The latter can manifest through capital fl ight, macroeconomic instability and, ultimately, by currency crises.
Our interpretation of the generating process of instability and crisis in BOP justifi es the importance of studies dedicated to measuring the exter-nal fragility of economies. For this purpose, Paula and Alves Jr. (. 1999, p 79) created an external fragility index (EFFI):
an economy that has to resort to the international fi nancial market to renegotiate open fi nancial position (that is to say, that cannot be immediately paid), even if with unfavorable interest rates and terms.
For open fi nancial positions, the authors understand those obligations they named as real and virtual, present at each period:
Real payment obligations reunite expenses with imports and services plus the loan repayments. Virtual obligations include stocks of short-term capital and portfolio investments [...] These obligations may be “faced” through reserves, ex-port revenues (interest and other services), medium and long term loans and direct investments (ibid., p. 79).
EFFI measures the real and potential needs of an economy to renegotiate its fi nancial external open positions by the ratio between their immedi-ate obligations, or short-term, and the foreign exchange available to meet them. Its calculation is performed by the equation:
where, M = imports;
X = exports;
D = expenses with interest “j” and other services (OS); R = revenue with interest “j” and other services (OS); A = loan repayments
CST-1 = stock of short-term capital, outdated by one period;
PLA-1 = stock of liquid investment in portfolio, outdated by one period; RE-1 = international reserves accumulated until the previous period; Id = foreign exchange input corresponding to direct investment;
Em1 =medium and long term investments.
The higher the index, the lower the country’s ability to meet the most immediate external fi nancial commitments, which puts it in a situation of greater dependence on foreign refi nancing4, increasing their propensity to be affected by changes in the international environment that alter the external fi nancing conditions.
That way, EFFI works as a tendency indicator that seeks to assess the
4 By the interpretation developed along this work, an economy’s bigger or smaller depen-dence on foreign refi nancing is not only the result of its CA balances. As demonstrated by equation (3), it is also associated with the fi nancial account infl uxes and to the external assets and debts stocks of the country.
(3)
1 1
( j OS ) /
EFFI MD D A CST PLA
1 1
increase or decrease the importance of the subjective evaluations of agents that hold rights and/or obligations in foreign currency in determining the outer frame of the economy (ibid.).
This interpretation allows a rank for fi nancial position assumed by a country on its external accounts similar to the one developed by Minsky. The country assumes a hedge position whenever the most immediate fi -nancial commitments are compatible with current revenues, the long-term liabilities and reserve assets available. In turn, the position is speculative or Ponzi if real and potential fi nancial commitments with nonresidents ex-ceed their ability to pay. In the latter case, foreign capital attraction policies become necessary to ensure the balance of BOP, subjecting the economy, largely, to the absorption of speculative fl ows (ibid.).
The great accomplishment of EFFIlies in the fact of it being able to as-sess, jointly, the two aspects of the fi nancial structure described by Minsky (2010) able to modify their level of fragility, namely, the amount of current expenditure by the revenue generated each period and the quality of the acquired refi nancing that composes its liability structure in relation to the forms of capital available. It is, thus, a measure that considers size and composition of the forms of capital in relation to forms of foreign debt of a country.
As one of the contributions of this work, it is intended to complement the study of Paula and Alves Jr. (1999), analyzing separately, in the follow-ing subsections, the two aspects covered by the index. Thus, the goal is to identify the importance of each aspect to the weakening of the external sector of the economy, justifying the aggregate results found in EFFI.
Finally, it was argued in this subsection that the degree of external fra-gility affects the relationship between demand and supply of foreign funds made available to the economy, the size and frequency of the imbalances in the fl ows of its BOP and its shock resistance capacity. Such dislocations of fi nancial fl ows are crucial for Minsky’s analysis because they illustrate the key moments of the business cycle where the fragility turns into insta-bility and, potentially, into crisis.
where, DECME = Current demand for resources in foreign currency;
DICME = Current availability of resources in foreign currency.
Current EFFI values higher than one indicate instability moments for external accounts, where demand exceeds availability of resources in for-eign currency.
According to the interpretation developed in this subsection, the con-vergence between the two fragility in dices presented here is expected. Moments of greater deterioration of the external fi nancial structure of a country should correspond to moments of mismatch between demand and supply of foreign exchange, greater instability of BOP fl ows and lower resilience of the external sector to shocks. This relationship is evaluated in subsection 3.2.3.
2.2.1 Operational external fragility: current accounts and net foreign debts
By operational external fragility, we understand the one that arises from changes on dimensions of capital and/or debt forms of the external fi nan-cial structure of an economy, that is to say, of quantitative changes in its net foreign wealth.
In an analysis of BOP fl ows of a country, the behavior of its net foreign debts (NFD) can be assessed in terms of CA results5 (Tonveronachi, 2006):
where, CA is Current Account,
NX is net exports of goods and services;
NFI are net revenues of foreign assets and debts; and UT are Unilateral Transfers.
5 Strictly speaking, the variation of NFD does not depend only on BOP fl ows. Other factors infl uence their size, such as changes in the market value (price) of assets and debts stocks and their expression in dollars (parities), the latter being directly impacted by variations in nominal exchange rate (BCB, 2008).
(4)
(5)
/DEC
Current EFFI
ME
DICME1 ( )
By the equation (5), CA defi cits increase NFD in the same proportion (ibid.).
CA result defi ne the liquidity position of an economy in foreign cur-rency in each period. Illiquidity at one point indicates that, in the local exchange market, foreign currency revenues of a country are lower than its compensation expenses of foreign debts.
Successive periods of illiquidity can be sustained indefi nitely, provided there is suffi cient supply of foreign funds to cover the service of foreign debts and other debts generated in the capital and fi nancial account, ensur-ing the overall closure of BOP’s accounts. The fi nancensur-ing offer persists as long as there is the expectation that, in the future, illiquidity will revert to ensure creditors expected return.
The expression (5) can be modifi ed and extended, allowing a more pre-cise defi nition on liquidity and solvency positions of an economy com-pared to the rest of the world (ibid.):
where, rFA is the return rate for foreign assets FA;
FR is the variation in international reserves, used to temporarily smooth the illiquidity of the external sector;
rFD is the interest rate of foreign debts FD, or, more broadly, the
costs of remuneration of capital that compose this liability; and MD is the debt generated by the amortization of debts in
their due date phase.
The country is in liquidity position when the current revenue from net exports, the net income from the ownership of foreign assets and unilat-eral transfers are suffi cient to honor the rFDFD payment. The rest of the ex-penses (MD) can be refi nanced with international markets. In the process of refi nancing, changes in the conditions offered by the markets affect CA from the following period by rFDFD.
With the concepts to identify the operational fragility of a country’s external sector developed, now follows the interpretation of them, accord-ing to Minskyan taxonomy. Table 1 contains the criteria used to classify
(6)
1 1
FA FA
j j j j j j j j
NX r FA UT FR r FD MD
1,...,
fi nancing regimes, defi ned according to the behavior of CA and NFD in the medium and long term perspectives:
Table 1 Classifi cation criteria of fi nancing regimes
Country Position NFD Characteristics Safety Margins
Hedge Zero. CA balanced,
with small and temporary deviations.
-International Reserves; - Monetary and Fiscal Policy; - Prudent evolution of NX.
Speculative Positive, butstable. Current revenue suf-fi cient to remunerate foreign debts: CA in balance.
-International Reserves; - Monetary and Fiscal Policy; - Prudent evolution of NX.
Ponzi Sustainable
Positive and growing, but at a small and constant rate.
Current revenue insuf-fi cient to remunerate foreign debts: constant defi cit in CA.
-International Reserves;
- Low NFD expansion rate.
Ponzi Unsustainable
Positive and growing at increasing rates.
Current revenue insuf-fi cient to remunerate foreign debts: constant defi cit in CA.
None.
Source: Elaborated from Tonveronachi (2006).
An economy fi nds itself in a hedge position when it is capable of main-taining NFD zero and, hence, CA in balance. Small and temporary devia-tions from this balance are natural and can be administrated by exchange reserve policy combined with small adjustments in fi scal and monetary policies. The latter, by modifying the growth pace of domestic income, are capable of rebalancing CA by their effects over NX. The prudent evolution of NX is considered another important safety instrument of a country.
The Ponzi position is characterized by the successive incapacity of the economy to generate revenues in an amount suffi cient to pay the debts, which implies defi cits in CA and thus positive and expanding NFD. In this regime, the unit is dependent on an increasing supply of refi nancing to ensure the balance of BOP. This position is divided between sustainable and unsustainable (ibid.). The country is classifi ed as sustainable Ponzi if it is able to keep a small and steady growth pace in NFD. For this, revenues, particularly NX, must have the same rate of growth of expenditure on compensation of NFD. Restrictive actions of monetary and fi scal policy are no longer effective to contain the most signifi cant imbalances in CA. High stock reserves and prudent evolution of NX are the safety margins of this position.
When NFD expansion occurs with increasing rates, Ponzi position is clas-sifi ed as unsustainable. Its fast deterioration, provides that it persists in me-dium and long term, should eliminate the effi cacy of all its safety margins. In this process, market expectations about the solvency condition of the unit suffers a gradual deterioration, making it diffi cult to refi nance to the extent that access to foreign funds is made impossible, at which time their total discredit to the creditors makes default an inevitable consequence.
2.2.2 External structural fragility: foreign fi nancing quality and
exter-nal fi nancial structure composition
By structural external fragility, we understand the one that arises from changes in the composition of capital and/or debt forms of the external fi nancial structure of an economy, that is to say, of qualitative changes in its net foreign wealth, defi ned in terms of degree of liquidity6, and matura-tion time of the capital that composes it.
In an open economy, external fragility can be manifested when there are domestic units that fi nance themselves in foreign currency with lower dead-lines than the maturity of the fi nanced project (Paula; Alves Jr., 1999). From the adoption of these speculative arrangements stems the increase in short-term obligations for readily available assets and, therefore, for the degree of liquidity of foreign debts in relation to that of national foreign assets.
Kaltenbrunner and Paincera (2009) point out that Minsky introduced the concerns regarding the composition of the fi nancial structure of the units in the analysis of Keynesian liquidity, showing how changes in quali-tative aspects of these structures increase the risks to which the units are submitted before the investors’ portfolio allocation decisions:
According to Minsky, however, capital asset pricing and portfolio decision theo-ries should take into account the debts positions of economic units, which are interrelated with their assets positions as “…a portfolio decision has two inter-dependent facets. The fi rst relates to what assets are to be held, controlled, or acquired; the second relates to how the position in these assets – i.e., their owner-ship or control – is to be fi nanced” (Minsky, 1975: 70) (ibid., p. 3).
Following this line, several authors associate the accumulation of short-term or highly liquid foreign exchange to the expansion of external. These capitals with high potential for reversion require recipient countries to a constant search for refi nancing among foreign markets to offset their de-stabilizing effects, real and potential, on the external accounts and on the economy as a whole. The need of foreign investors to relocate their port-folios can generate a liquidation process of household assets, motivated by factors that can even be fully unharnessed from the local economic situ-ation (Paincera, 2009; Paula; Alves Jr., 1999; Correa; Mollo; Biage, 2008; Corrêa; Munhoz; Pereira, 2012).
For a study based on Minsky, to measure the “weight” of capital with speculative profi le in the composition of the fi nancial structure of any unit requires the consideration that their liability positions are interrelated to their active positions. In other words, it makes sense to evaluate the ex-ternal fragility of a country considering only the highly liquid stock pres-ent in their debt forms, because the importance of the latter can only be estimated when it is related to the forms of capital available for the unit.
To measure the external structural fragility of an economy, this work evaluates the components of its external wealth, according to its degree of liquidity defi ned in Corrêa, Munhoz and Pereira (2012, p. 3)7:
[...] we regard as capital fl ows “with short-term bias,”those which have a great potential for rapid reversion. They are: Investments in Portfolio (Equity and Fixed Income Securities, term and long term), the Currency and Deposits, short-term Loans to Suppliers, short-short-term Loans in general, and Derivatives.
This group of capitals represents the external wealth component of a country, with direct and immediate impact on their external structural fragility8. However, we should also consider some of their peculiarities, especially when it comes to short-term foreign assets.
Faced with a currency crisis, the aversion to risk behavior, distinctive of these capitals, should produce a fl ight from these passive positions abroad and the permanence of these private active positions in foreign markets9, where they already were. Hence, the country cannot count on its private resources invested abroad, but only on its reserve assets under the control of the monetary (Gentil; Araújo, 2012).
The importance in considering the reserve assets in the analysis of ex-ternal structural fragility lies in the fact that, in the formation of expecta-tions of foreign investors, a relevant indicator they consider is the stock of hard currency readily available to meet the current and emergency obliga-tions and ensure the stability of the exchange rate10.
Thus, in our Minskyan perspective, the deterioration of the composi-tion of the external fi nancial structure of a country occurs through the growth of its obligations or debts with “short-term bias” in relation to its assets of immediate liquidity:
Results of this measure of fragility allow a rank, in Minskyan terms, of the fi -nancial position of an economy external sector. Hedge position occurs when reserve assets overcome short-term debts, a situation in which the country fi nds itself “covered” on the hypothesis of a massive capital fl ight abroad. On the other side, whenever the stock of obligations with high reversal po-tential exceeds the reserves, the country is in a speculative or Ponzi position, a characteristic that increases the odds of getting involved in currency crises.
8 It became evident in the above studies that the other groups of capital that compose the external wealth of an economy are considered capital with long-term bias. Thus, they infl u-ence the external weakness only for their effects on fl ows of BOP.
9 By defi nition, foreign assets accumulated by private companies in the acquisition of shares do not have immediate liquidity and cannot be used to honor other private agents’ commit-ments.
10 The exchange rate directly affects the external wealth of the country, its ability to gener-ate foreign exchange and return rgener-ate on foreign investment. For this reason, its instability tends to negatively infl uence the formation of expectations of international creditors.
(7)
3
Brazilian external fragility: a Minskyan
interpreta-tion of the period – 1999-2013
This section aims to measure the susceptibility to currency crises of the Brazilian economy between 1999 and 2013, through the application of the theoretical and empirical instruments developed in the previous section. Thus, the external fragility is evaluated from an operational point of view (3.1), structural (3.2) and by combining the two previous measures (3.3). Finally, the assessed fi ndings are evaluated in the light of an indicator that seeks to measure the fragility level impact on the external sector of the Brazilian economy11.
In order to facilitate the analysis, this time frame is divided into three periods, 1999-2002, 2003-2007 and 2008-2013, according to the behavior of Brazilian external accounts12.
3.1 External operational fragility
The equation (6), detailed in subsection 2.2.1, is built for Brazil from its BOP information, according to Table 2:
Table 2 BOP Information to external operational fragility measures
Availability of Current Resources
NX Trade Balance (FOB); Service Balance
rFAFA Revenue – Income Account
UT Current Unilateral Transfers (Net)
Total Demand for Current Resources
rFDFD Expense - Income Account
MD Foreign Direct Investment Debt; Foreign Portfolio Direct Investment Debt; Commercial Loan Amortization – LT Suppliers;
IMF Amortization; Amortization of Other regularization operations; Amortization of Other LT Loans;
Amortization of Loans and Financing – other LT sectors
11 The data used for the construction of these indicators for Brazil are listed in the Appendix of this work.
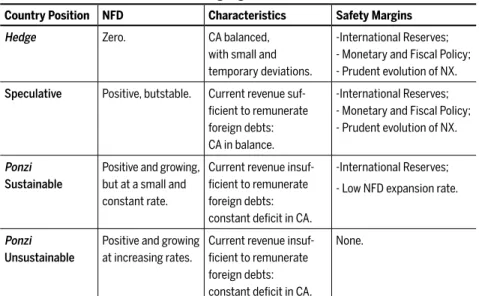
Total Demand for Current Resources
Other Financial Account debts *
Brazilian Direct Investment Balance; Brazilian Portfolio Direct Investment Balance; Other Brazilian Investments Balance; Derivatives (net);
Currency and deposits (net); Other LT and ST debts (net)
Source: Banco Central do Brasil.Self-Elaboration
* This item measures other components of the fi nancial account of BOP that register debts.
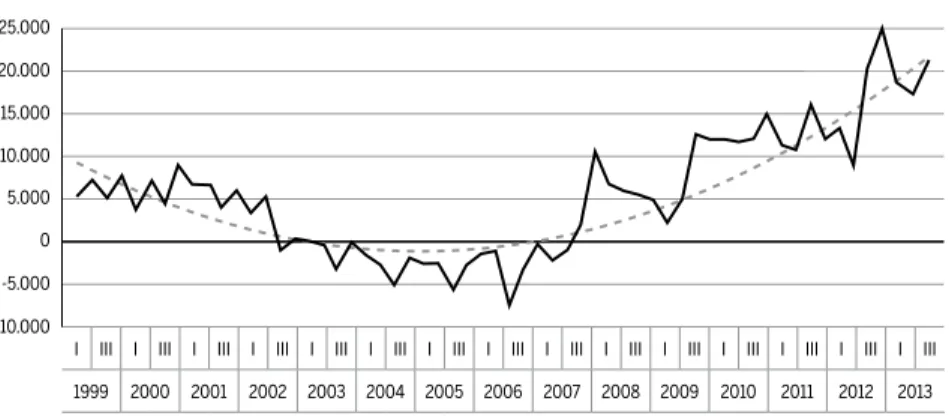
An Figure 1 shows the relationship between current revenues, excluding reserves, and the remuneration costs of foreign debts (rFDFD) each trimes-ter between 1999 and 2013. The red vertical bars illustrate periods and dimensions of illiquidity in the external accounts, represented by CA defi -cits, while green bars show moments of liquidity:
Figure 1 Liquidity x illiquidity of Brazilian external sector
Source: Banco Central do Brasil. Self-Elaboration.
According to Figure 1, revenues exceeded expenses with the remuneration of the foreign debts only between 2003 and 2007. During this period, NDF decreased13. On the other hand, between 1999 and 2002 and between 2008 and 2013, these costs could not be fully paid with current revenues, moments where the difference had to be covered by foreign refi nancing and NFD grew. Therefore, the results suggest that, under the operational perspective,
13 This conclusion is based only in the analysis of liquid credit fl ows (CA balances) over the country’s NFD.
-10.000 10.000
5.000
0
-5.000
-15.000 15.000
Debt Remuneration Expenses (US$ Million) Current Revenue (US$ Million)
I III I III I III I III I III I III I III I III I III I III I III I III I III I III I III
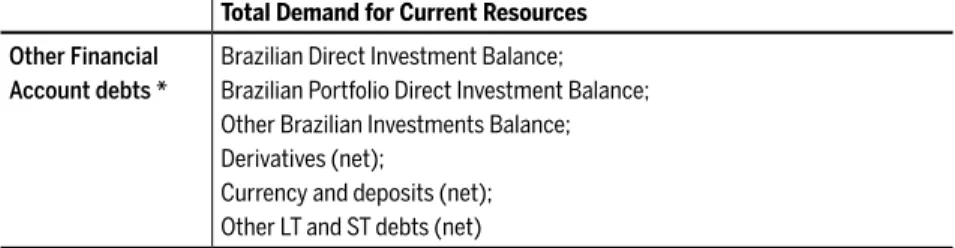
the external sector of the country presented Ponzi position between 1999 and 2002 and between 2008 and 2013 and speculative from 2003 to 2007. Financing regimes classifi cation continues by analyzing the NFD expan-sion pace in Figure 2, according to equation (5) described in subsection 2.2.1, and its trend curve:
Figure 2 NFD variation
Source: Banco Central do Brasil. Self-Elaboration.
The behavior of the NFD variation indicates that the operational fragility of the Brazilian external sector followed a cyclical pattern over the period analyzed, in which we can identify three phases. Between 1999 and 2002, NFD has grown, on average, at stable rates, which allows us to qualify the external sector of the country as sustainable Ponzi. From 2003 to 2007, the NFD expansion movement was reversed and fragility was reduced, characterizing a Speculative position. Finally, between 2008 and 2013, the resumption of NFD growth represented a second period of operating fragilization, which occurred, however, at increasing rates, a feature that qualifi ed the external sector as unsustainable Ponzi.
Unsustainable Ponzi position is a warning sign to the country. At any future time, the trend of NFD should be contained, either by voluntary adjustment of the external accounts, through the available action margins, or by an imposing adjustment in the face of its unsustainability, an alter-native already experienced by the Brazilian economy with the advent of currency crisis 1999.
-5.000 15.000
10.000
5.000
0
-10.000 20.000 25.000
NFD Variation (US$ Million) Tendency Curve NFD Variation
I III I III I III I III I III I III I III I III I III I III I III I III I III I III I III
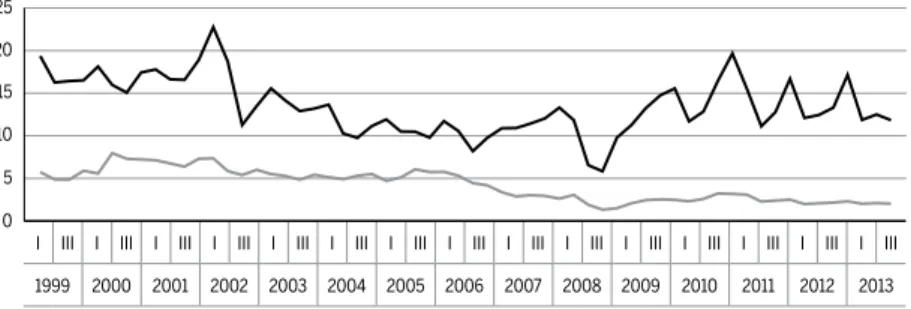
Figure 3 illustrates the effects of operational fragility of two of the coun-try’s safety margins: the volume of international reserves and the perfor-mance of net exports. For Brazil, the results of their net exports depend mainly on exports of goods recorded in the trade balance. As the volume of reserves, the ability to generate autonomous currency in foreign cur-rency through this account is considered an important factor for the for-mation of expectations of foreign investors. The effects of the fragility of these margins were estimated by the ratio between the stock of NFD and exports of goods and stocks of NFD and international reserves14:
Figure 3 NFD x Brazilian safety margins
Source: Banco Central do Brasil. Self-Elaboration.
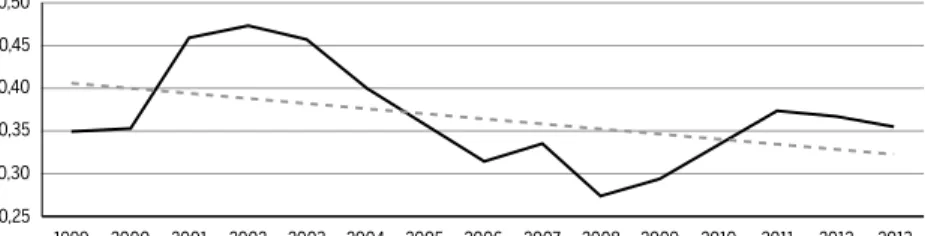
The dimension of NFD is one of the factors responsible for determining the value of national income drained abroad at each period to serve ex-ternal commitments. Thus, the ratio between NFD and GDP illustrates a third safety instrument of the external sector of the economy. Its growth should negatively affect the expectations of creditors on the returns on their investments and on the external solvency position of the country. Figure 4 illustrates this ratio, from the available annual data between 1999 and 2013, and its trend curve:
14 Between the last quarter of 2001 and 2013, NFD value was obtained by PII of Brazil data. Previous values are estimates, obtained, for each period t, through the difference between the stock of NFD in t+1 and balance of CA in t+1. The value of international reserves is given by the liquidity concept (end of period).
I III I III I III I III I III I III I III I III I III I III I III I III I III I III I III
1999 2000 2001 2002 2003 2004 2005 2006 2007 2008 2009 2010 2011 2012 2013
5 25
20
15
10
0
Figure 4 NFD x Brazilian safety margin
Source: Banco Central do Brasil and Instituto Brasileiro de Geografi a e Estatística. Self-Elaboration.
Table 3 summarizes the results of Figures 3 and 4, using the average values of all the ratios for each of the three analyzed periods:
Table 3 BOP Information to external operational fragility measures
Period 1999-2002 2003-2007 2008-2013
NFD/Average Export. Goods 16.950 11.441 12.920
NFD/Average Intern. Reserves 6.353 4.783 2.351
NFD/Average GDP 0.408 0.372 0.332
Source: Banco Central do Brasil and Instituto Brasileiro de Geografi a e Estatística. Self-Elaboration.
Values from Figures 3 and 4 and from Table 3 indicate that all safety margins had their worst results concerning NFD during the fi rst period, became robust concerning NFD in the second period and maintained their path of relative improvement in the third period, the exception being only in the third period for exports of goods, that suffered a minor setback in their path of relative improvement, but presented a performance close to that of the previous pe-riod and thus much more satisfactory than the one observed in 1999-2002.
These results suggest that Brazil, since 2003, is gradually acquiring greater ability to sustain its external accounts. Although, in the third pe-riod, the external sector has submitted its worst operating results, charac-terizing the unsustainable Ponzi scheme, the accelerated growth of NFD was not enough to spoil their Safety Margins.
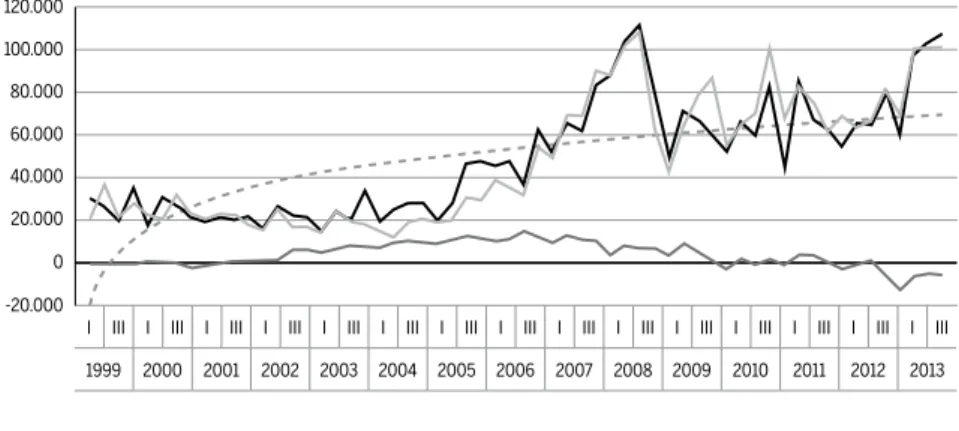
Finally, Figure 5 shows the relationship between current revenues, the total demand for foreign exchange and the participation of foreign fi nanc-ing in the balance of BOP accounts, the latter calculated in accordance
0,30 0,50
0,45
0,40
0,35
0,25
NFD/GDP Tendency Curve NFD/GDP
with Table 4. The Figure also shows the trend curve of this last:
Table 4 BOP Information that compose Foreign Financing
Foreign Financing
Foreign direct investment credit; Foreign portfolio direct investment credit; Commercial Credit Infl ow – LT Suppliers; IMF Infl ow;
Infl ow of Other regularization operations Infl ow of Other LT Loans;
Infl ow of Loans and Financing – other LT sectors.
Source: Banco Central do Brasil. Self-Elaboration.
Figure 5 Current revenue, total demand and foreign fi nancing for BOP closure (US$ Million)
Source: Banco Central do Brasil. Self-Elaboration.
Across all years analyzed, there was a signifi cant disparity between income and demand for current resources. For that reason, external fi nancing has always had a majority stake in the role of ensuring the provision of foreign currency resources to the global closure of BOP. Since this participation is directly affected by the expansion of operational fragility, it realized, in the last period, its highest growth compared to the previous periods.
Results presented so far induce a question on the sustainability of BOP in the two periods in which the external sector was classifi ed as Ponzi. The 1999 and 2001 crisis marked the only moments during the analyzed time frame in which the increased demand for foreign resources was not ac-companied by a proportional supply of external fi nancing. This mismatch
0 80.000
60.000
40.000 120.000
100.000
20.000
-20.000
Total Demande Foreing Financing
I III I III I III I III I III I III I III I III I III I III I III I III I III I III I III
between supply and demand has forced the country to use much of its foreign exchange reserves and to adopt a forced adjustment process of its external accounts to rebalance BOP and restore the confi dence of for-eign markets in the Brazilian economy. Therefore, the two currency crises leave no doubt about the inability of the country to ensure the balance of its external accounts during the period 1999-2002.
On the other hand, in the second Ponzi period, the rapid expansion of operational fragility led the country to an average demand for external resources 3 times higher than that of the fi rst Ponzi period. However, un-like what happened in 1999 and in 2001, this time, the fi nancial markets made an offer of foreign capital which, at various times, surpassed in large measure, the amount required for closing the BOP15. Thus, in this second Ponzi moment, the balance of the BOP was easily reached, showing that the progress of operational fragility was not enough to shake the confi -dence of international markets on the economy.
Explanations for the differences in the behavior of the external fi nancial market in both Ponzi periods are developed throughout this section. For now, it was argued that the performance of the safety margins in relation to operational external fragility of the country was much higher in the sec-ond Ponzi period, which contributed to the more favorable expectations of creditors in the last period, ensuring better external fi nancing conditions.
3.2 Structural external fragility
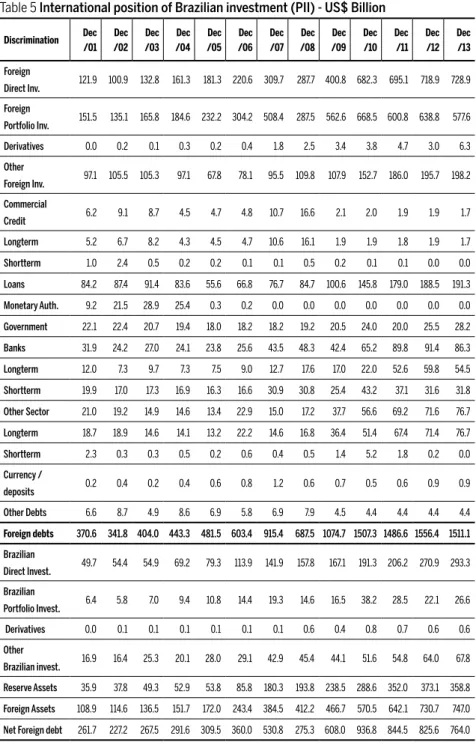
Table 5 presents the categories of capital from International Position of Brazilian Investment (PII) between December 2001 and December 201316:
We start evaluating Gross Foreign debt (GED) from item OFI, where the bigger part of the foreign debt is. From 2001 to 2013, OFI increased 104%, going from US$97.1 billion to US$198.2 billion. Despite the expansion path, OFI have been losing share in GED. In 2002, they represented 30.9% of GED, against 39.5% of FPI and 29.5% of FDI. In 2013, their participation dropped considerably, reaching 13.2%, against 38.2% of FPI and 48.2% of FDI.
15 The excess supply of foreign currency was so expressive that it enabled an extraordinary accumulation of foreign exchange reserves, the subject matter in the next subsection, reach-ing, in 2012, US$379 billion, a historical record for Brazil.
Table 5 International position of Brazilian investment (PII) - US$ Billion Discrimination Dec /01 Dec /02 Dec /03 Dec /04 Dec /05 Dec /06 Dec /07 Dec /08 Dec /09 Dec /10 Dec /11 Dec /12 Dec /13 Foreign Direct Inv.
121.9 100.9 132.8 161.3 181.3 220.6 309.7 287.7 400.8 682.3 695.1 718.9 728.9
Foreign Portfolio Inv.
151.5 135.1 165.8 184.6 232.2 304.2 508.4 287.5 562.6 668.5 600.8 638.8 577.6
Derivatives 0.0 0.2 0.1 0.3 0.2 0.4 1.8 2.5 3.4 3.8 4.7 3.0 6.3
Other
Foreign Inv. 97.1 105.5 105.3 97.1 67.8 78.1 95.5 109.8 107.9 152.7 186.0 195.7 198.2
Commercial Credit
6.2 9.1 8.7 4.5 4.7 4.8 10.7 16.6 2.1 2.0 1.9 1.9 1.7
Longterm 5.2 6.7 8.2 4.3 4.5 4.7 10.6 16.1 1.9 1.9 1.8 1.9 1.7
Shortterm 1.0 2.4 0.5 0.2 0.2 0.1 0.1 0.5 0.2 0.1 0.1 0.0 0.0
Loans 84.2 87.4 91.4 83.6 55.6 66.8 76.7 84.7 100.6 145.8 179.0 188.5 191.3
Monetary Auth. 9.2 21.5 28.9 25.4 0.3 0.2 0.0 0.0 0.0 0.0 0.0 0.0 0.0
Government 22.1 22.4 20.7 19.4 18.0 18.2 18.2 19.2 20.5 24.0 20.0 25.5 28.2
Banks 31.9 24.2 27.0 24.1 23.8 25.6 43.5 48.3 42.4 65.2 89.8 91.4 86.3
Longterm 12.0 7.3 9.7 7.3 7.5 9.0 12.7 17.6 17.0 22.0 52.6 59.8 54.5
Shortterm 19.9 17.0 17.3 16.9 16.3 16.6 30.9 30.8 25.4 43.2 37.1 31.6 31.8
Other Sector 21.0 19.2 14.9 14.6 13.4 22.9 15.0 17.2 37.7 56.6 69.2 71.6 76.7
Longterm 18.7 18.9 14.6 14.1 13.2 22.2 14.6 16.8 36.4 51.4 67.4 71.4 76.7
Shortterm 2.3 0.3 0.3 0.5 0.2 0.6 0.4 0.5 1.4 5.2 1.8 0.2 0.0
Currency / deposits
0.2 0.4 0.2 0.4 0.6 0.8 1.2 0.6 0.7 0.5 0.6 0.9 0.9
Other Debts 6.6 8.7 4.9 8.6 6.9 5.8 6.9 7.9 4.5 4.4 4.4 4.4 4.4
Foreign debts 370.6 341.8 404.0 443.3 481.5 603.4 915.4 687.5 1074.7 1507.3 1486.6 1556.4 1511.1
Brazilian
Direct Invest. 49.7 54.4 54.9 69.2 79.3 113.9 141.9 157.8 167.1 191.3 206.2 270.9 293.3
Brazilian Portfolio Invest.
6.4 5.8 7.0 9.4 10.8 14.4 19.3 14.6 16.5 38.2 28.5 22.1 26.6
Derivatives 0.0 0.1 0.1 0.1 0.1 0.1 0.1 0.6 0.4 0.8 0.7 0.6 0.6
Other
Brazilian invest. 16.9 16.4 25.3 20.1 28.0 29.1 42.9 45.4 44.1 51.6 54.8 64.0 67.8
Reserve Assets 35.9 37.8 49.3 52.9 53.8 85.8 180.3 193.8 238.5 288.6 352.0 373.1 358.8
Foreign Assets 108.9 114.6 136.5 151.7 172.0 243.4 384.5 412.2 466.7 570.5 642.1 730.7 747.0
Net Foreign debt 261.7 227.2 267.5 291.6 309.5 360.0 530.8 275.3 608.0 936.8 844.5 825.6 764.0
A second feature of the composition of OFI that stuck throughout all ana-lyzed time frames was the majority of Long Term (LT). Short Term (ST) OFI never represented more than 6.3% of GED, lying, must of the time, below 4% and, in 2012 and 2013, in 2.1% and 2.2%, respectively. On an annual average, from 2001 to 2013, LTOFI17 represented 13% of GED, while STOFI represented only 3.7% of GED.
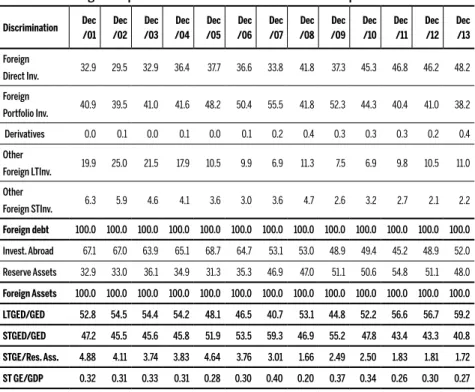
Information OFI participation in GED can be found in Table 6, which illustrates the percentage composition of the main items of debts and for-eign assets in Brazil:
Table 6 Percentage composition of the international investment position of Brazil
Discrimination Dec /01 Dec /02 Dec /03 Dec /04 Dec /05 Dec /06 Dec /07 Dec /08 Dec /09 Dec /10 Dec /11 Dec /12 Dec /13 Foreign
Direct Inv. 32.9 29.5 32.9 36.4 37.7 36.6 33.8 41.8 37.3 45.3 46.8 46.2 48.2
Foreign
Portfolio Inv.
40.9 39.5 41.0 41.6 48.2 50.4 55.5 41.8 52.3 44.3 40.4 41.0 38.2
Derivatives 0.0 0.1 0.0 0.1 0.0 0.1 0.2 0.4 0.3 0.3 0.3 0.2 0.4
Other Foreign LTInv.
19.9 25.0 21.5 17.9 10.5 9.9 6.9 11.3 7.5 6.9 9.8 10.5 11.0
Other
Foreign STInv. 6.3 5.9 4.6 4.1 3.6 3.0 3.6 4.7 2.6 3.2 2.7 2.1 2.2
Foreign debt 100.0 100.0 100.0 100.0 100.0 100.0 100.0 100.0 100.0 100.0 100.0 100.0 100.0
Invest. Abroad 67.1 67.0 63.9 65.1 68.7 64.7 53.1 53.0 48.9 49.4 45.2 48.9 52.0
Reserve Assets 32.9 33.0 36.1 34.9 31.3 35.3 46.9 47.0 51.1 50.6 54.8 51.1 48.0
Foreign Assets 100.0 100.0 100.0 100.0 100.0 100.0 100.0 100.0 100.0 100.0 100.0 100.0 100.0
LTGED/GED 52.8 54.5 54.4 54.2 48.1 46.5 40.7 53.1 44.8 52.2 56.6 56.7 59.2
STGED/GED 47.2 45.5 45.6 45.8 51.9 53.5 59.3 46.9 55.2 47.8 43.4 43.3 40.8
STGE/Res. Ass. 4.88 4.11 3.74 3.83 4.64 3.76 3.01 1.66 2.49 2.50 1.83 1.81 1.72
ST GE/GDP 0.32 0.31 0.33 0.31 0.28 0.30 0.40 0.20 0.37 0.34 0.26 0.30 0.27
Source: Banco Central do Brasil. Self-Elaboration.
The most representative accounts of GED during the analyzed time frame were FPI and FDI. In the fi rst two phases, their stocks followed their growth
trajectories. However, the fi rst item expanded, in general, at greater speed when compared to the second. Therefore, in every year between 2001 and 2007, the FPI values exceeded those of FDI and the difference between them increased year by year. On the other hand, from 2008 to 2013, there was a change in the behavior of these series. While the FDI followed a general trend of growth, the FPI alternated years of growth and downturn. As a result, in this third phase, the stock of FDI not only surpassed that of FPI, with one exception in 2009, but also grew at higher rates. Table 7 can evidence this change in the behavioral pattern of the stocks:
Table 7 FPI and FDI stock differences
Discrimination Dec /01
Dec /02
Dec /03
Dec /04
Dec /05
Dec /06
Dec /07
Dec /08
Dec /09
Dec /10
Dec /11
Dec /12
Dec /13
FPI-FDI 29.5 34.3 33.0 23.3 50.8 83.6 198.7 -0.2 161.8 -13.9 -94.3 -80.1 -151.4
Source: Banco Central do Brasil. Self-Elaboration.
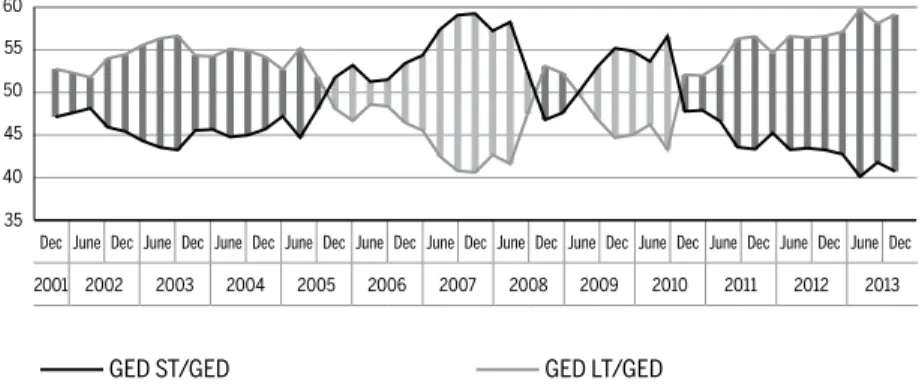
At the end of Table 6, the accounts that compose the Brazilian foreign debt were grouped, according to their bias of short term (ST GED) or long term (LTGED), and presented according its participation in GED18. The evolu-tion of these series is in Figure 6, quarterly valued. The green bars show periods and dimensions in which LTGED/GED exceeded ST GED/GED, while red bars show the opposite:
Figure 6 Brazilian external debt composition
Source: Banco Central do Brasil. Self-Elaboration.
18 STGED accounts are: FPI, derivatives and STOFI. LTGED accounts are: FDI and LTOFI.
Dec June Dec June Dec June Dec June Dec June Dec June Dec June Dec June Dec June Dec June Dec June Dec June Dec
2001 2002 2003 2004 2005 2006 2007 2008 2009 2010 2011 2012 2013
35 45 60
55
50
40
Generally, short-term capital participation in GED was higher during the period characterized as euphoria of international markets and strong re-covery of Brazilian macroeconomics indexes. On the other side, this par-ticipation falls during the period when there is a greater mistrust of those markets on the country, in 2001 and 2002, as well as during the post-crisis scenario of 2008, that was characterized by domestic measures of specu-lative capital control and by the increasing infl ux of FDI in the country19.
With Brazilian GED already described, now presented is the foreign assets item20 that is relevant for the measuring of the external structural fragility, reserve assets.
Between 2001 and 2005, reserve assets had a small ascendant trajec-tory, going from US$35.9 billion to US$53.8 billion, a movement strongly accelerated from 2006 on, with the beginning of the aggressive policy of reserve composition. These interventions, motivated by the necessity of diminishing excessive currency volatility and reducing the country’s exter-nal fragility, resulted in as even-fold increase of the reserves, if compared to 2005, reaching the mark of US$358.8 billion in 2013. Therefore, this item gained, gradually, greater participation in the country’s foreign assets, going from 32.9% in 2001 to 54.8% in 2011 and 48% in 2013, as shown in Figure 7. The green bars show periods and the dimension in which the reserves have exceeded other investments in the composition of foreign assets, while red illustrate the opposite.
From equation (7), described in the subsection 2.2.2, Figure 8 shows the evolution of Brazilian structural external fragility, quarterly valued, be-tween 2001 and 2013, and its trend curve.
A fi rst observation of the ratio STGED/Reserve Assets is that, along all time frames, forms of debt with short-term bias exceeded the assets of imme-diate liquidity. This means that in the event of a severe currency crisis, with the entire liabilities of greater volatility escaping to the exterior, the country would be “uncovered.” Thus, in relation to structural external fragility, it is clear that the country has always been in speculative or Ponzi position.
19 The performance of FDI in the last period served as a major damper to the economy against the contagion effect produced by fi nancial instability in developed countries due to the euro crisis deepening, counterbalancing the unstable trajectory of speculative capital. (Prates; Cunha, 2013).
Figure 7 Brazilian foreign assets composition
Source: Banco Central do Brasil. Self-Elaboration.
Figure 8 Structural external fragility of Brazil
Source: Banco Central do Brasil. Self-Elaboration.
On the other hand, a comparative assessment shows that the structural fragility showed, in general, a sharp downward trend from 66% during the years analyzed. Between 2001 and 2013, although the STGED has grown 3.5 times, foreign exchange reserves increased 10 times. As a result, the ratio plummets from a value of almost 5 in 2001 and 2002 to 1.62 in 2013.
Therefore, despite the insuffi ciency of the movement to disfi gure the speculative or Ponzi position adopted by the Brazilian external sector, the fact is that the latter is structurally less vulnerable in these recent years than it was thirteen years ago.
Dec June Dec June Dec June Dec June Dec June Dec June Dec June Dec June Dec June Dec June Dec June Dec June Dec
2001 2002 2003 2004 2005 2006 2007 2008 2009 2010 2011 2012 2013
Dec June Dec June Dec June Dec June Dec June Dec June Dec June Dec June Dec June Dec June Dec June Dec June Dec
2001 2002 2003 2004 2005 2006 2007 2008 2009 2010 2011 2012 2013
35 55
50
45
40 70
65
60
30
Reserve Assets/Foreign Assets Gross Foreign Invest/Foreign Assets Gross
2,00 5,00
4,00
3,00
1,00
3.3 External fragility: joint assessment of the operational and structural fragilities and its consequences on the Brazilian exter-nal sector
The fi rst index analyzed here is the one proposed in equation (3), which was developed in subsection 2.2. This equation is built for the Brazilian economy, according to Table 8:
Table 8 BOP information that compose EFFI
Open Financial Positions
Real
M: imports Imports of goods
Dj: interest expenses Income Expenses
Dos: other services expenses
Services Expenses;
Current Unilateral Transfers Expenses; Unilateral Transfer of Capital Expenses
A: amortizations
Amortization of commercial credit – LT suppliers; Amortization IMF;
Amortization of others regularization operations; Amortization of others LT loans;
Amortization of loans and fi nancing–other LT sectors; Foreign direct investment debt
Virtual
CST: short-term capitals 1 Stock of derivatives;
Stock of other foreign investments - short-term trade credit; Stock of other foreign investments - short term loans to banks; Stock of other foreign investments - loans to other short-term sectors;
Stock of other foreign investment - Currency and deposits
PLA: liquid investment in portfolio2 Stock of foreign portfolio investments
Available Resources
Current Revenue and International Reserves
X: exports Exports of goods
Rj: interest revenue Income Expenses
Ros: other services revenue Services Expenses;
Current Unilateral Transfers Expenses; Unilateral Transfer of Capital Expenses
Loans and Financing of Medium and Long Term
Id: foreign currency Direct investments
Credit of foreign direct investment
Eml: medium andlongterm loans Infl ow of commercial credit – LT suppliers; Infl ow IMF;
Infl ow of other regularization operations; Infl ow of other LT loans;
Infl ow of loans and fi nancing – other LT sectors
Source: Banco Central do Brasil. Self-Elaboration.
1 Values from December 2001 on were extracted from the International Position of Brazilian Investment
(PII do Brasil). Previous values come from the series “Gross Short-Time External Debt”, made available by BCB.
2 Values from December 2011 on were extracted from PII of Brazil. Previous data were calculated from
the sum, since 1990, of FPI fl ows (net) of the BOP.
Figure 9 shows the quarterly evolution of the EFFI between 1999 and 2013 and its trend curve:
Figure 9 External fi nancial fragility index
Source: Banco Central do Brasil. Self-Elaboration.
According to Figure 9, EFFI was always over 1 (one), which indicates that real and virtual obligations in foreign currency exceeded the country’s payment capacity throughout the entire evaluated time frame. Therefore, Brazil has always depended on refi nancing in the external markets to fulfi l a part of its most immediate fi nancial commitments with non-residents, assuming, hence, a speculative or Ponzi position.
On the other hand, it appears that the external fragility followed, gen-erally, a downward path of 61% between 1999 and 2013, ranging from a ratio that went from 3.79, in 2000, to 1.47. Thus, the real and virtual
I III I III I III I III I III I III I III I III I III I III I III I III I III I III I III
1999 2000 2001 2002 2003 2004 2005 2006 2007 2008 2009 2010 2011 2012 2013
0 2,00 4,00
3,00
1,00
external obligations of the economy were increasingly being covered by a combination of current income, LT external fi nancing sources and foreign exchange reserves.
According to the EFFI, the Brazilian foreign sector was more vulnerable to destabilizing factors, precisely during the period comprising the two cur-rency crises suffered by the country between 1999 and 2002. At this stage, the high operational imbalances amounted to the worst composition of the external fi nancial structure observed throughout the time frame.
In the next phase, between 2003 and 2007, the external fragility has de-creased, being at an intermediate level in respect to the other two periods. This was due to the signifi cant recovery of CA surpluses associated with the fall of the ratio between the stocks of short-term liabilities and assets with immediate liquidity.
Finally, between 2008-2013, the fi nancial structure of the Brazilian ex-ternal sector was in its least fragile condition of the entire series. While un-der the operational perspective the fragility has submitted its worst results of all the time frame, under the structural perspective the fragility was the lowest among all the periods, with structural results more than enough to offset the operating defi cits.
Assessing the EFFI trend curve, it is evident that its overall downward trend slows in 2012 and stabilizes in 2013, suggesting that it should remain more or less stable, that is, with values hovering around 1.5, over the com-ing years in the short term.
Thus, if the fragility of the external sector followed a downward path, then the balance of the BOP was reached gradually with greater ease. The most robust external fi nancial structure resulted in increased cred-ibility of the economy with international markets, better return expecta-tions of applied investments and greater optimism about its ability to remain solvent. Therefore, there was an increase in supply of external fi nancing available to the country, which facilitated the closure of BOP accounts. As a result of better fi nancing conditions, BOP instabilities be-came gradually less likely and frequent, as well as their real and fi nancial consequences being lower.
Table 9 BOP information that compose current EFFI
Current demand for foreign currency (DECME) Current availability of foreign currency (DICME)
Imports of goods Exports of goods
Services expenses Services revenues
Income expenses Income revenues
Current unilateral transfers expenses Current unilateral transfers revenues
Unilateral capital transfers expenses Unilateral capital transfers revenues
Debt with Brazilian direct investment Credit with Brazilian direct investment
Debt with foreign direct investment Credit with foreign direct investment
Brazilian portfolio investment application Brazilian portfolio investment return
Debt with foreign portfolio investment Credit with foreign portfolio investment
Derivatives - liabilities (net) Derivatives - assets (net)
Disbursement with LT loans and fi nancing Amortization received from LT loans and fi nancing
Other LT and ST liabilities (net) Other LT and ST assets (net)
Commercial credit – LT Suppliers - Amortization Commercial credit – LT Suppliers - Infl ow
IMF – Amortization IMF – Infl ow
Other regularization operations - Amortization Other regularization operations – Infl ow
Other LT loans – Amortization Other LT loans– Infl ow
Loans and fi nancing - other LT sectors - Amortization
Loans and fi nancing - other LT sectors - Infl ow
Source: Banco Central do Brasil. Self-Elaboration.
Figure 10 shows results of current EFFI applied to Brazilian economy:
Figure 10 Current external fi nancial fragility index
Source: Banco Central do Brasil. Self-Elaboration.
The results of the oscillation amplitudes indicate that the BOP fl ows have had, over the years, less and less frequent levels of instability, while the
I III I III I III I III I III I III I III I III I III I III I III I III I III I III I III
1999 2000 2001 2002 2003 2004 2005 2006 2007 2008 2009 2010 2011 2012 2013
0,7 1,1 1,3
0,9