1
Equity Valuation - Pirelli & C. SpA
André Rolhas Bernardino
152413029
Supervisor: Professor José Carlos Tudela Martins
August 2015
Dissertation submitted in partial fulfillment of requirements for the degree
MSc in Finance, at the Universidade Católica Portuguesa, 2015.
2
RESEARCH NOTE
Pirelli & C. SpA is the fifth largest tyre manufacturer in the world with a commercial presence in more than 160 countries with 19 factories in 13 countries. Pirelli distinguishes from its competitors in terms of innovation, product excellence and a strong brand.
In an overall view, replacement tyre market continues and is expected to keep growing. In addition, with the stabilization of the Brazilian and European markets, Pirelli has great prospects of growth and expansion in the near future.
The key risks existing in Pirelli’s business that might influence negatively the next year’s results include: lower than expected sales volume for light vehicle and truck tyres in Europe and both North and South America; an exponential increase in rubber and crude oil prices; and unstable currency fluctuations, especially for the Euro, Brazilian Real and the Russian Ruble.
Revenues are expected to grow 6,43% in 2015 and 5,86% in 2016, and at the same time it is expected a cost reduction to 81,29% of revenues in two years, due to prior investments. With the same capital structure, it is projected a WACC of 8,22% and growth in perpetuity of 1,50%. Combining all estimations, it is believed of a total value for Pirelli of 9 154 032 044 Euros.
RECOMMENDATION
BUY
TARGET PRICE€ 14,39
Price at 31-Dec-2014 € 11,21 Shares Outstanding 475 388 592 Performance €millions 2015 2016 Revenues 6 405 6 780 EBITDA 1 202 1 268 EBITDA Margin 18,8% 18,7% Net Profit 477 558Dep & Amo 305 303
∆ NWC -86 41
CAPEX 382 387
Share price evolution 09-14
0 2.5 5 7.5 10 12.5 2 0 0 9 2 0 1 0 2 0 1 1 2 0 1 2 2 0 1 3 2 0 1 4
3 ABSTRACT
Title: Equity Valuation - Pirelli & C. SpA Author: André Rolhas Bernardino
This thesis has the purpose to value Pirelli & C. SpA at 31st of December of 2014. Pirelli is publicly traded in the Milan Stock Exchange, Borsa Italiana, and it is known as the fifth largest tyre manufacturer in the world with a great focus on high-end premium tyres. To valuate Pirelli’s equity a discounted cash flow methodology is used with an outcome of a 14,39 Euros price per share. To complete the valuation it is put in place a relative valuation, which supports the author’s recommendation to buy, since the price at that time was 11,21 Euros. Finally, a comparison to a J.P. Morgan report is made where the investment bank estimates a price of 13,00 Euros followed by a neutral recommendation as it is expected no underperformance nor outperformance while compared to the market.
4
ACKOWLEDGEMENTS
This thesis was an exercise that enhanced and complemented my knowledge on the field of Equity Valuation.
Firstly, I would like to thank my supervisor Professor José Carlos Tudela Martins for all the teachings in Firm Valuation and his guidance and understanding that allowed the completion of this thesis.
I would also like to express my gratitude to Pirelli’s investor relations team for the promptness and availability to answer all my questions.
Thank you so much Alice, João, Henrique, Mariana, and many more for the companionship, the support, and the motivation during the whole Master. And a special thanks to my parents, because without them nothing would be possible.
5 TABLE OF CONTENTS RESEARCH NOTE ... 2 ABSTRACT ... 3 ACKOWLEDGEMENTS ... 4 TABLE OF CONTENTS ... 5 1. INTRODUCTION ... 7
2. LITERATURE REVIEW ON VALUATION MODELS ... 8
2.1. DISCOUNTED CASH FLOW MODELS ... 8
2.1.1. DISCOUNT RATE ... 9
2.1.2. TERMINAL VALUE ... 9
2.1.3. ADJUSTED PRESENT VALUE ... 10
2.1.4. DIVIDEND DISCOUNT MODEL ... 10
2.2. RELATIVE VALUATION ... 11
2.3. MODELS BASED ON PROFITABILITY ... 11
2.3.1. VALUE ADDED MEASURES ... 12
2.3.2. RESIDUAL INCOME VALUATION ... 12
2.4. OPTION PRICING MODELS ... 12
2.5. VALUATION IN EMERGING MARKETS ... 13
2.6. VALUING PIRELLI ... 14
3. TYRE INDUSTRY PROFILE ... 15
4. PIRELLI & C. SPA OVERVIEW ... 18
5. PIRELLI & C. SPA VALUATION ... 22
5.2. DISCOUNTED CASH FLOW ... 22
5.2.1. REVENUES ... 22
5.2.2. OPERATING EXPENSES ... 23
5.2.3. DEPRECIATION AND AMORTIZATION ... 23
5.2.4. TAXES ... 24
5.2.5. CAPITAL EXPENDITURES ... 24
5.2.6. NET WORKING CAPITAL ... 25
5.2.7. PROVISIONS ... 25
5.2.8. FREE CASH FLOW TO THE FIRM ... 25
5.2.9. WEIGHTED AVERAGE COST OF CAPITAL ... 26
5.2.10. TERMINAL VALUE ... 27
5.2.11. SHARE PRICE ... 27
6
5.3.1. PEER GROUP... 27
5.3.2. MULTIPLES ... 28
6. INVESTMENT BANK REPORT COMPARISON: J.P. MORGAN ... 30
CONCLUSION ... 32
ANNEXES ... 33
7
1. INTRODUCTION
The thesis in hand intents to obtain a value for a public traded company, and for the current exercise, the Italian tyre manufacturer Pirelli & C. SpA was chosen.
In order to appraise Pirelli, the thesis starts with a brief summary of the most used valuations methods in the financial world. From that point it is described the ones that are suitable for such valuation.
Then a chapter is dedicated to explain the current tyre industry in order to gain a better understanding of functioning, size, and even the inputs in tyre production. This chapter is followed by a section with an overview of Pirelli operations and business strategies for the next few years.
Later, for the valuation itself, the discounted cash flow methodology and a relative valuation approach will be applied with the purpose of obtaining the fair price per share at 31st of December of 2014. For the discounted cash flow it is possible to see all calculations and assumptions described to achieve the free cash flows to the firm and to figure the discount rate, namely the weighted average cost of capital. Whereas for the relative valuation, one can have a clear view on the construction of the peer group and the multiples computation.
Finally, a comparison is made between the findings of this thesis and a report prepared by the investment bank J.P. Morgan regarding the market performance of Pirelli.
8
2. LITERATURE REVIEW ON VALUATION MODELS
This chapter is dedicated to obtain a broad understanding of the current “state of the art” methodology used to determine the value of a financial asset. In general terms, the valuation process of an asset is usually based on variables which regard either on future investment returns or on comparison with similar assets (Stowe et al, 2002). Within the wide spectrum of valuation models there are some more sophisticated and others much simpler, and Damodaran (2005) categorizes the several approaches in four different areas: the first, the discount cash flow models, relate the value of an asset to the present value of expected future cash flows; the second, relative valuation, aims to find a price for the asset by comparing it to similar assets on the market; the third, models based on profitability assess the existing assets of a company with book value estimates to estimate fair value; and the fourth measures assets that perform in the same way of options, using real option valuation models.
2.1. DISCOUNTED CASH FLOW MODELS
In DCF models, we attribute a value to an asset believing that such asset will be able to generate in the future a certain amount of cash flow to all investors, both equity and debt holders, being the free cash flow to the firm (FCFF) the most used approach (Koller et al., 2010). Furthermore the DCF can be split in two problems, being the first the forecast of expected future cash flows, whereas the second is to choose the proper rate to discount those cash flows to the present.
(1) 𝑉𝑎𝑙𝑢𝑒 𝑜𝑓 𝑎𝑛 𝑎𝑠𝑠𝑒𝑡 = ∑ 𝐸[𝐶𝐹𝑖]
(1+𝑟)𝑛
𝑛
𝑖=1
Where: 𝐸[𝐶𝐹𝑖] is the expected cash flow of each period, r is the discount rate, and n is the life expectancy of the asset.
To estimate each individual cash flow, commonly known as free cash flow, it is calculated as the following: projected income after taxes, plus depreciation and amortization, less capital expenditures, less working capital increases. In a simplified form, the free cash flow is the sum of all sources of cash, less the capital expenditures necessary to stay in business and continue to grow at the expected rate (Gilbert, 1990).
According to Gilbert (1990) there are numerous ways to determine the cash flow of each year, it is possible to use simple models where there is found a mathematical relationship
9
between sales and employees, or others more complex which take into account non-linear relationships between many variables.
The free cash flow to the equity (FCFE) is very similar to the FCFF, with the exception that instead of valuing the assets of the company, the valuation removes the cash flows from or to the debtholders, leaving only the cash flows available to equity investors. To the FCFF we must subtract the interest expense, add the proceeds of new debt issue, and remove the principal repayments (Damodaran, 2000).
2.1.1. DISCOUNT RATE
The discount rate is one approach for risk adjusting in DCF models in terms of opportunity cost of raising both debt and equity financing (Damodaran, 2005). The weighted average cost of capital (WACC) is the most common used discount rate by analysts and investors, as it takes into consideration the cost of shareholder’s equity and debt after tax in proportion of their use , and for a constant capital structure (Fernández, 2002). To discount to the present value in the FCFE, the discount rate used should be the cost of equity (Parrino, 2005).
(2) WACC = Debt
Debt+EquityKD(1 − tax rate) +
Equity
Debt+EquityKE
Where: KD(1 − tax rate) represents the cost of debt minus the tax shields obtained from the interest expenses, and KE the cost of equity.
2.1.2. TERMINAL VALUE
One problem that arises in valuing the cash flows is that in theory all companies have infinite life despite not being possible to project cash flows forever. Gilbert (1990) state that typically investors and analysts estimate five to ten years of individual cash flows plus a terminal value, an estimate of what should be the price at the end of all periods. After estimating the explicit period investors can assume that a business has reached the maturity and as a result it is proposed a terminal value, where at some point the company’s cash flow will grow at a constant rate equal or lower to the growth rate of the economy in which the firm operates (Damodaran, 2000). All together we summarize the DCF in the following equation:
(3) 𝑉𝑎𝑙𝑢𝑒 𝑜𝑓 𝑎𝑛 𝑎𝑠𝑠𝑒𝑡 = ∑ 𝐸[𝐶𝐹𝑖] (1−𝑊𝐴𝐶𝐶)𝑖 + 𝑇𝑉𝑡 (𝑊𝐴𝐶𝐶−𝑔)𝑡 𝑡 𝑖=1
10
Where: 𝑇𝑉𝑡 is the terminal value at the end of the explicit period, and g is the constant growth rate at which the firm grows in perpetuity.
2.1.3. ADJUSTED PRESENT VALUE
Numerous times, it is not logical to assume a precise capital structure for a company, and the literature recommends using the adjusted present value (APV). The APV approach splits the valuation in two processes (Parrino, 2005).
The first step is evaluating the company as if it is only financed only with equity, then discount those cash flows with an unlevered WACC. The second is to add the present value of interest tax shields discounted at the cost of debt, and deduct the expected bankruptcy costs associated (Parrino 2005). To estimate present value of bankruptcy costs, Damodaran (2005) reports as a product between the probability of bankruptcy and the cost of bankruptcy, where the probability of bankruptcy is given by the bond rating of the firm, and the cost of bankruptcy as percentage of the firm value which is empirically found to be ranged from 10% to 25% (Andrade and Kaplan, 1998).
2.1.4. DIVIDEND DISCOUNT MODEL
Rappaport (1986) describes the dividend discount models (DDM) as a valid approach to price the stock of a company, where the goal is to determine the value per share of projected dividends based on expected future cash flows. The author divides the purpose of DDM in two branches, being the first to build a theoretical stock price from the estimated dividends and discount rate, and the second to find an expected rate of return for the equity investors.
The share price computed with DDM is similar to the computation of most DCF models, as the investor or analyst divide the future in two stages, being the first the explicit period of forecast of dividends and a second stage which assumes a company reaches maturity, the dividend payout ratio continues steady and dividends will grow at a constant rate (comparable to the terminal value). All together it is possible to price the stock using the next formula: (4) 𝑃0 = ∑ 𝐷𝐼𝑉𝑖 (1+𝐾𝐸)𝑖 𝑡 𝑖=1 + 𝐷𝐼𝑉𝑡(1+𝑔) (𝐾𝐸−𝑔)𝑡
Where: 𝑃0 represents the equity value, 𝐷𝐼𝑉𝑖 is the dividend of each year, g stands for the growth rate in perpetuity and 𝐾𝐸 is the cost of equity.
11 2.2. RELATIVE VALUATION
Among the vast valuation methodologies, the relative valuation is extensively used by investors and analyst due to its simplicity and straightforwardness. The relative valuation purpose is to price an asset by comparing it to similar assets using market value and book value multiples (Stowe et al., 2002).
Goedhart et al. (2005) argue that the use of multiples are many times misunderstood and misapplied when financial analysts try to estimate a “fair” valuation with the relative valuation approach. Instead, the scholars recommend using the relative valuation to complement more extensive valuations such as DCF models, for example in its forecasts. To properly evaluate the price of an asset, similar peers must be found. Goedhart et al. (2005) recommend starting by analyzing the company’s industry and examine through the companies’ financials and specifics in order to locate the ones with similar figures and prospects to the business in study.
After establishing the group of comparable firms, known as the peer group, it is adequate to begin the relative valuation. Within the relative valuation approach there are an innumerous selection of multiples, being the most used ones the price multiples which are based on the business’s capitalization, and the enterprise value multiples which regard the company’s value, as the name suggests (Fernández, 2001).
Multiples can be described as a way of value the earnings that an asset can generate, and Damodaran (2005) refers to price multiples as an approach to price a stock on the capability to generate proceeds for an equityholder, using for example a price/earnings ratio, whereas the enterprise value multiples should be more useful for an investor or an analyst that has interest in assessing the whole value of a business as a multiple of the operating income.
2.3. MODELS BASED ON PROFITABILITY
According to Koller et al. (2005) models that estimate the future cash flows of companies are not able to provide an appropriate perception of the business performance, and many managers and analysts focus on understanding where value comes from, usually looking at other performance measures that might explain where and how the companies generate value. Value added measures and residual income valuation are two approaches which are based on a business’ profitability. Asset
12 2.3.1. VALUE ADDED MEASURES
Peterson and Peterson (1996) explain that the measure of performance of a company is, in broad terms, the ability to add value, and this added value is associated to the economic profit that a company generates. In other words, the amount by which operating income exceeds the cost of capital. The authors also claim that the economic value added (EVA) and the market value added (MVA) are the two most used value added techniques to estimate the value of a firm.
Adserà and Viñolas (2003) explain the EVA as “the spread between the return on existing investments and the average cost of capital of those investments”. This approach splits the value of the firm two parts, being the first the base value without new investments and growth opportunities, and the second part the expected return of the new investments made by the company. The MVA is explained by Peterson and Peterson (1996) as a “measure of what the firm’s management has been able to do with a given level of resources (the invested capital)”, where the computation is simply done by subtracting the market value of the debt and equity by the amount of capital invested.
2.3.2. RESIDUAL INCOME VALUATION
Residual income valuation is built concerning a similar concept as the value added models. The residual income is computed for each period of time subtracting the cost of capital (in value) to the proceeds earned during that period.
Lee (2003) states that to transform a single-period residual income into a valuation method it is necessary to estimate the residual income for future periods and discount to the present and sum to the current capital base. The author also explains the valuation can be done by several approaches depending if we are valuing the residual income for equityholders and debtholders, or to shareholders. The most common approach regards only the shareholders, assuming the book value of equity as the capital base and discount at the cost of equity rate.
2.4. OPTION PRICING MODELS
Alike to DCF models, option pricing models take into consideration the present value of current assets in place and the present value of future investment opportunities, however instead of pricing the expected proceeds of investments and future investments, the option pricing models value the decision of potential investments, disinvestments, or defer of investments. Trigeorgis (1996) claims that option pricing models goes beyond cash flow
13
approaches as it accounts the value of management investment decision, valuating a business more closely and with higher flexibility.
The most common approach in option pricing models is to treat the company under valuation just like an option and value it like real options. Even so, Damodaran (2005) advises the use of the real option approach if only the company shares option characteristics, as it can be very hard to apply and consequently avoiding an erroneous value.
Chance and Peterson (2002) use binomial trees to compute growth, dispose and defer of options. This provides the opportunity for managers the flexibility to decide to expand, abandon or postpone investment decisions, which will have a direct impact on the performance and profitability of the company. Another approach proposed by the authors is the continuous time Black-Scholes model to value real options, however they enhance the importance of some characteristics of the underlying asset that cause the valuation a challenge for analysts, such as option volatility, exercise price, discount rate, and time to expiration. Copeland and Antikarov (2005) conclude that real options is an reasonable approach to value a business, nevertheless the scholars aware to the fact that Black-Scholes model fails as it does not account for the payout of dividends during the its life cycle.
2.5. VALUATION IN EMERGING MARKETS
Emerging markets are viewed by international companies as good investment opportunities, as they are fast-growing economies (Goedhart and Heden, 2003), have fine “pay for performance” indicators (Du and Choi, 2010), and for the easy access to natural resources (Ploeg, 2011).
Harvey (1995), and several of other scholars, evoke that despite the high expected returns, emerging markets should be associated with large exposure to risk factors, including accelerated inflation, exchange rate fluctuations, and macroeconomic and political distress. Meaning, that while making an investment decision on an emerging market, it is necessary to take into account the opportunity cost between risk and return.
Goedhart and Heden (2003) corroborate that individual risk in each country is indeed high, however they also claim that emerging markets have low correlation with each other, supporting the premise that the overall performance of an emerging market
14
portfolio can be quite sable if it is well diversified. On the other and Carrieri et al. (2006), while studying the impact of emerging markets on global equity prices, claim that the verified low correlation is time varying and the currency risk is significant, and reinforce the importance of contemplating a country risk premium in asset pricing.
2.6. VALUING PIRELLI
From all methodologies described, only a few will be used in order to determine the value of Pirelli. Within the DFC models, the FCFF will be chosen to evaluate the firm, estimating the free cash flows for the next seven years plus a terminal value. The second approach will be the relative valuation, which will be used to complement the cash flow analysis, comparing the firm to its peers using enterprise value and price multiples, namely the price-earnings ratio, price to EBITDA, price to sales, enterprise value to EBITDA, and enterprise value to sales.
Although Pirelli has a stable policy regarding dividend payments, the DDM will not be used in this thesis as it would most likely generate similar results to the DCF analysis. Even so, for a future analysis the DDM could be applied to value Pirelli’s equity as it can be easier to estimate and more straightforward than a FCFE. Furthermore, approaches based on profitability as EVA, MVA or residual income models will also be discarded, due to its lower importance while comparing to more exhaustive methods like the FCFF. The option pricing models will not be used as they do not apply to Pirelli, since replicating a portfolio of an industrial business as big as Pirelli and with several levels of risk is very challenging and it could lead to an inaccurate pricing.
Even so, to properly evaluate Pirelli we must understand the market where it plays and the company itself. In that way, the next chapter illustrates the current tyre industry and a brief portrayal of Pirelli’s business and strategies of today and the next few years.
15
3. TYRE INDUSTRY PROFILE
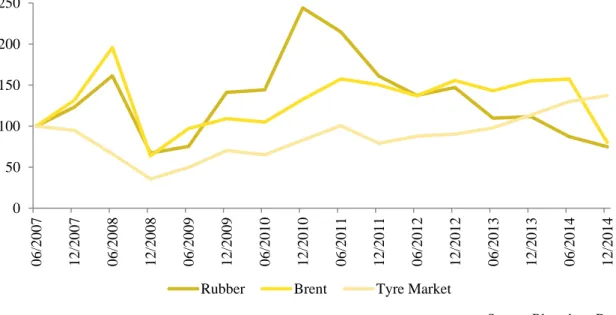
The global tyre market has been irregular throughout the past years, where in some periods global sales grew more than 10% and others with a slight decrease. This irregularity is due to a combination of factors. The global macroeconomic conditions usually dictate the evolution of the tyre market, an example is the latest global crisis which had a negative impact on tyre sales, especially in developed economies, as the demand in both consumer and industrial markers decreased1. The volatility in the prices of the raw materials used has also made a notorious impact in the emerging countries like China and India, as crude oil reached a maximum in 20082 and rubber prices peaked in 2010. In the second half of 2014 we witnessed a decrease on the oil and rubber prices that had a positive impact on the industry as many costs associated with the tyre production did in fact diminished. All together it can be observed that since 2008 the prices of these commodities have been fluctuating, resulting in a slightly unpredictable tyre market (see figure 1).
Figure 1: Rubber prices, Brent prices and Tyre Market Index, June 2007 to December 2014
Source: Bloomberg Data. Tyres are mainly made from natural and synthetic rubber, where natural rubber is extracted from the rubber-tree which is only found in equatorial parts of the globe, and synthetic rubber is produced from crude oil. Other important component is the carbon
1Pirelli & C. SpA – Interim management statements at March 31, 2009 2Pirelli & C. SpA – Quarterly Report at September 30, 2008
0 50 100 150 200 250 0 6 /2 0 0 7 1 2 /2 0 0 7 0 6 /2 0 0 8 1 2 /2 0 0 8 0 6 /2 0 0 9 1 2 /2 0 0 9 0 6 /2 0 1 0 1 2 /2 0 1 0 0 6 /2 0 1 1 1 2 /2 0 1 1 0 6 /2 0 1 2 1 2 /2 0 1 2 0 6 /2 0 1 3 1 2 /2 0 1 3 0 6 /2 0 1 4 1 2 /2 0 1 4
16
black that is also derived from crude oil (and in some cases natural gas). Therefore, the production costs suffer from impacts on these prices, which will have a direct impact on the profitability of this sector.
Regarding the tyre market, it consists of more than 75 tyre manufactures worldwide, but not all manufacturers obtain most their revenues from tyre production, even so the aggregated tyre market was valued at EUR 112 500 millions in 2014, a decrease of 16 b.p. regarding the previous year. Despite the number of tyre manufacturers, the five largest players control most of the market. In 2014, the sales by production of Bridgestone represented 20,33%, Michelin 18,06%, Goodyear 12,63%, Continental 9,02%, and Pirelli 5,55%. As a result the top companies have power over 65% of the global tyre industry.
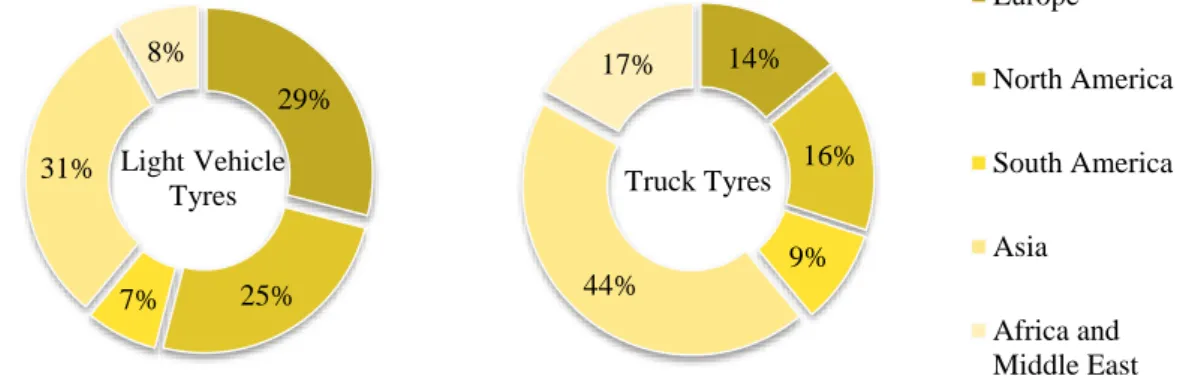
Figure 2: Global demand for light vehicle and truck tyres, in 2014
Source: Manufacture Française des Pneumatiques Michelin. On the topic of tyres, they are divided in three categories: light vehicle tyres which represent 60% of all tyre production revenues, truck tyres with 30%, and the other 10% are specialty tyres which include agricultural, motorcycle, aircraft and others. And within each category, tyre sales are separated in two classes: original equipment and replacement tyres. Original equipment are the tyres that are sold to vehicle manufacturers as a component for its production, while replacement tyres are the ones that are sold individually. The replacement tyres account for 75% of the production versus the 25% of original equipment, a statistic that has been somewhat constant through the years3. The largest tyre maker, Michelin, estimates that in 2014 was produced 1,6 billion tyres worldwide, being 1,4 billion for light vehicles and 180 million truck tyres. The next figure summarizes the tyre consumption for 2014.
3 Michelin 2014 Annual and Sustainable Development Report 29% 25% 7% 31% 8% Light Vehicle Tyres 14% 16% 9% 44% 17% Truck Tyres Europe North America South America Asia Africa and Middle East
17
In tyre manufacturing there is always a considerable amount of resources spent in research and development, as tyres are a reasonably homogeneous product there is a need to distinguish between them with several characteristics like durability or advanced technologies inside. Therefore it is exceptionally important for a tyre manufacturer to keep up with the competition in terms of product features, in order to avoid losing its position in the market. The research and development expenses for the top five producers represents, on average, for 3,5% of sales revenue, a figure that is quite stable within companies and time. And due to such expenses we can have tyres than last for more than 120 000 km, whereas forty years ago it would last around 30 000 km4. Technology also introduced proper tyres for different types of roads, weather conditions, or even for the type of drive desired by the consumer. In more premium products it is already possible to find run-flat technology, or the Pirelli’s Cyber Tyre that informs the driver the state of the tyre and road conditions5.
4 http://www.tirerack.com/tires/tiretech/techpage.jsp?techid=138, May 2015 5 Pirelli & C. SpA, website, May 2015
18
4. PIRELLI & C. SPA OVERVIEW
In 1872, Pirelli was founded as an Italian producer of rubber products and derivative processes. In 1879 Pirelli expanded the business for electrical cables and after a few years later it started producing tyres for bicycles. Then in the beginning of the twentieth century, Pirelli developed its cable segment to produce telecommunication cables and introduced car tyres in the tyre segment, molding the business to what would be the next one hundred years of business.
Pirelli & C. SpA is listed on the Milan Stock Exchange since 1922 and is currently the fifth major tyre manufacturer worldwide. As for the cable segment, it was sold in 2005 to another Italian company, Prysmian, and nowadays tyre sales account for 99% of Pirelli’s revenues.
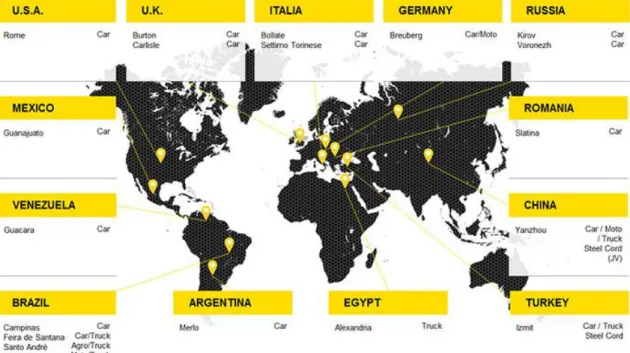
Pirelli has a global commercial presence in more than 160 countries and nineteen plants in thirteen countries, in both mature and emerging markets (see figure 3). The installed capacity through its plants allow the production of 72 million car and moto tyres and 6,5 million truck and agricultural tyres. The plants in emerging markets are extremely relevant in the Pirelli’s business, as they produce almost 80% of all car and moto tyres and 100% of truck and agricultural tyres due to its competitive lower costs; whereas the other plants in more mature markets work on a smaller scale and with a higher focus on premium products.
Figure 3: Pirelli plants in the world
19
Pirelli’s diversification allows dispersing some risks and set strategies and objectives by region. This way it is possible to adapt and plan accordingly to the macroeconomic scenario and market trends of each location. Pirelli divides the globe in six parts: Europe, Russia, MEAI (Middle East, Africa and India), APAC (Asia and Pacific Countries), Latin America, and North America.
Europe (except Russia and some Nordic countries) represents one third of revenues and a large amount of resources is spent on the development of this area. As for the strategy, the most relevant topics are the focus on the partnerships with premium and prestige car manufacturers for original equipment, the brand positioning and awareness, a large commercial distribution chain, and the six factories that produce mostly for the Premium segment in the domestic market. Their goal is to become “the reference partner for the premium market and achieve the highest brand consideration”, strengthen current ventures and expanding the premium retail market with geomarketing and new franchising deals.
Russia and the rest of Europe (4% of Pirelli’s revenues) are separated from the previous topic because of the market needs of the region. In this area, demand is lower for general premium tyres, and their sales are mainly from medium class and specialty winter tyres. The strategy here also differs from the previous as Pirelli is aiming to triple sales by 2017 by the increase in premium winter products supply and variety, thru the synergies of the partnerships with car makers, and by increasing the presence of Pirelli tyres in shelves. 8% is the MEAI contribution to the Pirelli’s revenues. In this region a large amount of revenues come from the industrial business, the truck and agricultural tyres account together for 61% of the region revenues. The next target is to preserve the market leadership in the industrial business and try to capture some margin in car premium and superpremium tyres. To keep the record in the industrial business, Pirelli will upgrade and expand the truck tyre mix and increase the sales force where it already has some significant influence. There will also be created a new truck business in South Africa. For the expansion in the car segment, Pirelli will leverage with the European supply and develop the distribution channel where the premium and superpremium cars exist in more quantity, again the geomarketing is put in place.
APAC is the region with the highest economic growth and expected growth for the next years, mainly because of China’s development. Similarly to the MEAI region, APAC also
20
represents 8% of the Pirelli’s revenue, although the sales are quite different. In China alone, Pirelli accounts with a double digit market share in superpremium tyres. In the rest of the region, Pirelli has a unique position in the replacement tyres segment due to the relationship with the European car manufacturers and the local car dealers, where customers have higher brand loyalty with the original tyres of their cars. For the next years, Pirelli expects to capture the growth in the premium segment in the markets that is already installed and expand for new ones, namely South Korea, Malaysia, Thailand, and Indonesia using the same strategy that is already using there: strengthening the relationships with previous partners and creating with new ones.
Latin America is the most important region for Pirelli in terms of revenues (36%) and that importance is projectable to continue. The region GDP is expected to continue to grow more than 3,9% until 2017, mainly due to the growth of the internal demand and higher prospects for the foreign investment in the region. Pirelli is a market leader in Latin American countries with a market share superior to 20% in Brazil and 30% in Argentina. Pirelli is also the only manufacturer that supplies for all tyre segments and a major player in the original equipment for the car sector (40% share in Brazil and Argentina). The goal is to continue to be the market leader and for that Pirelli will increase the focus on premium equipment in terms of production and expansion of the car and moto tyre products, reinforce the medium segment with more supply and a competitive offering, and continue the past relations with car producers and dealers.
The last region, Mexico, USA, and Canada, represent 11% of all revenues and it is seen by Pirelli as a region with a large investment and growth opportunities as the average GDP growth rate is close to 3% (versus the 1,27% in Europe) which implies an increase in car registrations (5,7% for premium and prestige cars and 10,7% for motorcycles, according to Pirelli). Although medium tyres are sold in a large quantity, more than 300 million pieces in 2014, the strategy for the region is the expansion of top-end tyres and increase the current market share of 10% on premium. Unlike the other plants, in 2013 the USA and Mexico production on met 30% of the demand and for that Pirelli will engage on a local investment to double that number, aiming for a better efficiency in terms of supply chain and quality of customer service. In the next years, Pirelli aims to increase their position in the original equipment by creating new partnerships with local car makers, a difficult task because of the large presence of Goodyear.
21
Pirelli’s business distinguishes from its competitors due to a growing focus on the premium segment. It is expected that in 2016 this segment will weight 60% of the car tyre revenues, maintaining as the leader in the premium segment. Pirelli represents approximately 50% of the global market in the prestige original equipment and 20% in the premium, essentially because of the high-end technology, the long joint ventures with car makers such as Ferrari, Maserati, Lamborghini, Bentley, Audi, BMW and Mercedes, and the brand name which is commonly associated with top quality and high performance. That association happens mostly because of the motorsports events where Pirelli is always present, for example being the tyre supplier for Formula 1 and the World Superbike Championship. Other large marketing ventures include the sponsorship of F.C. Internazionale Milano since 1995 and the famous Pirelli Calendar which dates from 1964.
22
5. PIRELLI & C. SPA VALUATION
In this part it will described the whole methodology, assumptions and forecasts to obtain the price per share of Pirelli at 31 of December of 2014. Two approaches are used: the Discounted Cash Flow and the Relative Valuation.
5.2. DISCOUNTED CASH FLOW
The DCF analysis will be divided in small sections corresponding to the steps made to obtain the expected cash flows for Pirelli for an explicit period of seven years, from 2015 to 2021. This section will start with the forecast of the income statement and then the other items necessary to find each year’s cash flow, and at last the WACC and terminal value in order to get the estimated the price per share of Pirelli.
5.2.1. REVENUES
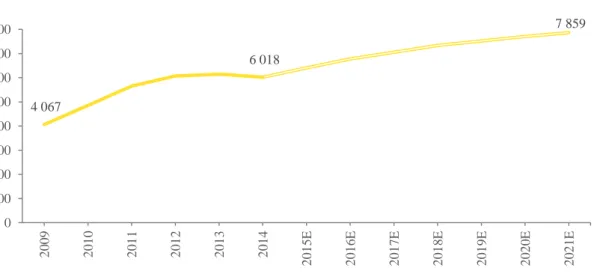
Revenues estimation is one of the most important exercise in a valuation, as it is the starting point of the estimation of several other figures. Since 2009 Pirelli’s revenues have been growing with the exception of 2014 due to a slowdown in the South American market. The following figure summarizes the evolution of the revenues for the next years.
Figure 4: Revenues in millions of Euros
Source: Annual reports and own calculations. The current strategy focuses on each geographic area of the globe with an overall expansion worldwide. Pirelli’s financials aim for a revenue growth of 6,4% in 2015 and a 5,9% in 2016, mainly due to the premium class business. From that point, Pirelli will strengthen their position as the top premium tyre producer until the end of 2018 and maintain their leading position for the following years. In that way the expectation for revenues growth is of 4% per year in 2017 and 2018, and 2,5% in the next two years and
4 067 6 018 7 859 0 1 000 2 000 3 000 4 000 5 000 6 000 7 000 8 000 2 0 0 9 2 0 1 0 2 0 1 1 2 0 1 2 2 0 1 3 2 0 1 4 2 0 1 5 E 2 0 1 6 E 2 0 1 7 E 2 0 1 8 E 2 0 1 9 E 2 0 2 0 E 2 0 2 1 E
23
2% for 2021, resulting in a revenue volume of 6 018 million Euros in 2014 to over than 7 858 million Euros in 2021. Although it is a slightly lower growth than the expected world GDP (according to IMF database), it must be taken into consideration that Pirelli is already a mature company subject to several levels of systematic risk and with limited expansion opportunities.
5.2.2. OPERATING EXPENSES
Pirelli’s operating expenses are highly correlated with the revenues (0,997 for the period of 2009 to 2014) and so the forecast was made assuming a percentage of the revenues, alike to Goedhart et al. (2010) recommendation. For the first two years of the explicit period, Pirelli is expecting a cost reduction resulting from prior global investments in production efficiency and sustainability which started in 2008.
Figure 5: Operating expenses in millions of Euros
Source: Annual reports and own calculations. Research and development is a small but vital part of the operating expenses. As stated before in the tyre industry profile chapter, tyres are typically a very homogeneous and Pirelli tries to differentiate from its competitors by incorporating technology and aiming for top premium markets, and for that there is a great need for continuous study and investigation. Historically R&D expenses have been between 3% and 4% of the revenues and since 2009 Pirelli has applied for almost one hundred patents related with tyres, tyre production and tyre assembling. It is this constant level of innovation that assures the growth and the leading position in the high-end tyre market.
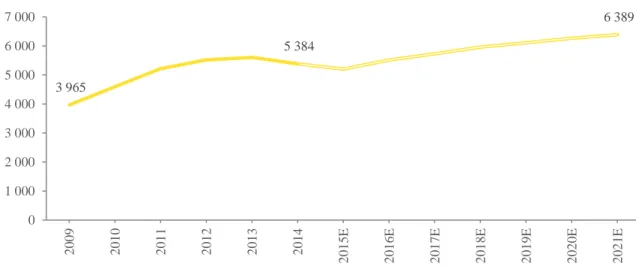
5.2.3. DEPRECIATION AND AMORTIZATION
Fernandez (2004) warns that estimating depreciations and amortizations should not be based on revenues, instead depreciation must be related to property, plant and equipment,
3 965 5 384 6 389 0 1 000 2 000 3 000 4 000 5 000 6 000 7 000 2 0 0 9 2 0 1 0 2 0 1 1 2 0 1 2 2 0 1 3 2 0 1 4 2 0 1 5 E 2 0 1 6 E 2 0 1 7 E 2 0 1 8 E 2 0 1 9 E 2 0 2 0 E 2 0 2 1 E
24
and amortization related to intangible assets. Since 2009 Pirelli has not suffered major changes to its business and in terms of disposals and acquisitions the tendency is a continuous small growth, which is reflected on the property plant and equipment. Therefore it is expected that both property, plant and equipment and intangible assets to perform similarly to Pirelli’s turnover.
5.2.4. TAXES
The estimation of taxes is generally based on the past effective tax rates on EBIT, nevertheless in 2015 Pirelli is expecting the same rate as the previous year, 35,48%, and for 2016 and increase to 36,18% is anticipated. For future periods the effective tax rate will be 36,18%, as tax rates have been varying in the past years (between 33,61% and 43,15%) and using an historical average would be an obtuse approach since Pirelli’s business will not alter greatly in the upcoming years.
5.2.5. CAPITAL EXPENDITURES
For the period of 2014 to 2017, Pirelli is planning an investment of 1 500 million Euros in production lines for all classes of tyres, which will be reflected on the capital expenditures. For the following years, it is expected a smaller but continuous growth that was assumed as a percentage of revenues, as they are also projected to grow for the explicit period. Figure six abridges the evolution of capital expenditures for the exercise period.
Figure 6: Capital expenditures in millions of Euros
Source: Annual reports and own calculations.
223.2 367.2 392.9 0 100 200 300 400 500 600 700 2 0 0 9 2 0 1 0 2 0 1 1 2 0 1 2 2 0 1 3 2 0 1 4 2 0 1 5 E 2 0 1 6 E 2 0 1 7 E 2 0 1 8 E 2 0 1 9 E 2 0 2 0 E 2 0 2 1 E
25 5.2.6. NET WORKING CAPITAL
The net working capital was computed by subtracting the current assets by the current liabilities. However to discover each years’ current assets and current liabilities was necessary to look at each component individually (see annex 1). Pirelli divides the current assets in cash, accounts receivable, inventories, short-term investments, and other current assets; where for the current liabilities it is divided in accounts payable, short-term borrowings and other short-term liabilities. For the purpose of this thesis it was used the same items and the estimation was made as a percentage of revenues for the whole explicit period.
For the valuation exercise it is necessary to determine the changes in net working capital, which is merely the difference of working capital from one period to the next.
5.2.7. PROVISIONS
Provisions mentioned in Pirelli’s annual reports are for current and non-current liabilities and charges (for example legal current obligations which derived from past events), for employee benefits and for deferred tax liabilities. Provisions are included in the computation of the free cash flow for the firm, as they are a non-cash expense with a large impact on the company’s financials.
Historically, changes in provisions were quite stable with the exception of 2012 where it increased considerably and decreased in the next year to a normal value. Therefore, the estimation of provisions was made as a percentage of revenues as an average of the past two years.
5.2.8. FREE CASH FLOW TO THE FIRM
Combining the estimations made it is possible to compute the expected free cash flows for the exercise, as it is demonstrated in the next figure.
Figure 7: FCFF output in millions of Euros 2015 E 2016 E 2017 E 2018 E 2019 E 2020 E 2021 E EBIT x (1-Tax) 580.0 604.5 601.7 622.8 641.5 657.5 670.6 + Depreciation & Amortization 303.4 321.2 334.0 345.7 356.1 365.0 372.3 - Capital Expenditures 381.9 387.2 363.1 364.9 375.9 385.3 393.0 - ∆ Working Capital 86.2 -40.5 -29.3 -26.6 -23.6 -20.3 -16.6 + ∆ Provisions 43.7 42.5 30.7 28.0 24.8 21.3 17.5 = FCFF 459.0 621.6 632.6 658.2 670.1 678.8 684.1
26
5.2.9. WEIGHTED AVERAGE COST OF CAPITAL
As stated in the literature review, the weighted average cost of capital (WACC) will be used to discount the free cash flow. And in order to find the WACC it is necessary to compute Pirelli’s cost of equity, cost of debt and the capital structure, as equation number two describes.
Cost of Equity was estimated on a monthly basis since 2005 and computed based on the capital asset market pricing model with an addition of a country risk premium to the formula:
(5) 𝐾𝐸 = 𝑅𝑓+ 𝛽 ∗ 𝑅𝑃𝑀+ 𝐶𝑅𝑃
Where, KE is the cost of equity, RF is the risk free rate, β is the beta, RPM is the market risk premium and CRP is the country risk premium. The risk free chosen was the 10 year German Bund yield which is considered the benchmark for the risk free rate in Europe (0,54%). The beta of 1,12 was estimated as the relationship between Pirelli’s monthly returns and the Italian stock exchange (Borsa Italiana). For the market risk premium the computation was made by subtracting the risk free to the average monthly returns of the Borsa Italiana, resulting in an annual return of 7,55%. The country risk premium of 2,26% derives from the Damodaran’s website, from which it was selected the country risk premium of each region where Pirelli operates and it was weighted according to the average returns of each region. All together is obtained a cost of equity of 11,24%. Cost of Debt was estimated based on the issued bonds and loans at December 2014. The details of Pirelli’s debt were accessed via Bloomberg, and at that time Pirelli had two bonds and four loans outstanding. Weighting the yields to maturity and the amount outstanding a value of 2,02% was reached for the cost of debt, which after tax (38,92%) will result in an after-tax cost of debt of 1,24%.
Finally, for the purpose of computing the WACC, one should consider the market value of equity and debt in order to figure the capital structure of Pirelli. To estimate the market value of equity it was multiplied the number of all shares outstanding for the price at the end of 2014; and to estimate the debt value it was divided the interest expense reported on Pirelli’s income statement by the cost of debt estimated before. The result was a weight of 69,75% for equity and 30,25% for debt, which brings a WACC of 8,22%.
27 5.2.10. TERMINAL VALUE
The expected growth for perpetuity was assumed as 1,5%, using Damodaran (2010) guidelines for the estimation of the terminal value where the growth should never surpass the economy in which Pirelli operates. And adding the fact that Pirelli is already a large and mature company with limited growth opportunities, one decided that the growth must not be equal but lower than the world GDP, Pirelli runs its business worldwide. Correspondingly, the expected terminal value in December 2021 is 10 339,6 million Euros.
5.2.11. SHARE PRICE
Bringing all cash flows and terminal value to December 2014, one obtains Pirelli’s enterprise value of 9 154 032 044 Euros. Then, by removing the market value of debt and adding cash and cash equivalents one gets the equity value, which divided by 475 388 592 ordinary shares outstanding results in a price of 14,39 Euros per share.
5.3. RELATIVE VALUATION
As stated in the literature review, the relative valuation will be used to complement the discounted cash flow model. This next segment will be divided in the choice of Pirelli’s group of similar companies and in the multiple estimation.
5.3.1. PEER GROUP
To correctly apply the multiples one must find the suitable peer group, and as different companies have different characteristics it is essential to filter which companies have the akin features, in this case with Pirelli.
The first step in the methodology to find the peer group was selecting from Bloomberg information regarding thirty six different manufacturers, the ones where tyre sales account for more than 98% of revenues and with relevant information in Bloomberg’s data base (as there are a few smaller companies with little or almost no data). Afterwards, to diminish the group of tyre manufacturers, a centroid analysis was made in order to divide the thirty six in four smaller groups. Such selection was made based on three parameters: EBITDA margin, return on assets and return on invested capital. All factors chosen are ratios based on profitability at several levels, the first is a simple measure of the operational cost structure on revenues, the second allows to evaluate the efficiency of each firm’s assets, and the last one measures the ability to generate returns based on past
28
investments. The final outcome was a peer group of seven companies plus Pirelli (see figure 8).
Figure 8: Pirelli peer group
EBITDA Margin Return on Assets
Return on Invested Capital
Pirelli & C. 19,02 4,25 10,66
Michelin (Cgde) 16,81 4,78 11,93
Toyo Tire & Rubber Co Ltd 18,27 4,21 9,31
Kumho Tire Co Inc 15,84 2,72 7,11
Nexen Tire Corp 17,81 5,32 8,22
Nan Kang Rubber Tire Co
Ltd 14,86 1,63 1,69
Multistrada Arah Sarana Tbk 16,62 0,08 0,97
Goodyear Indonesia Pt 10,96 2,32 5,95
Source: Bloomberg’s data base. 5.3.2. MULTIPLES
Five multiples were chosen to make the comparison of Pirelli and its peers, three price multiples and two enterprise value multiples. Since there is no correct multiple, it was selected several of the most used multiples, namely the price-earnings ratio, price to EBITDA, and price to sales to have a perspective for the equityholders, and enterprise value to EBITDA and enterprise value to sales for an overall comprehensive look. Although each multiple have its own disadvantages, the goal is to obtain a fair comparison and validate the DCF valuation.
The computation of the multiples was made using a normal average of each of the seven competitors’ data, then for each multiple the appropriated figures were applied. Besides the figures from Pirelli’s 2014 report, it was also projected one year forward multiples with the estimations made in the DCF valuation for 2015. Figure 9 summarizes the peer group multiples data and figure 10 contains the final output for Pirelli’s multiples.
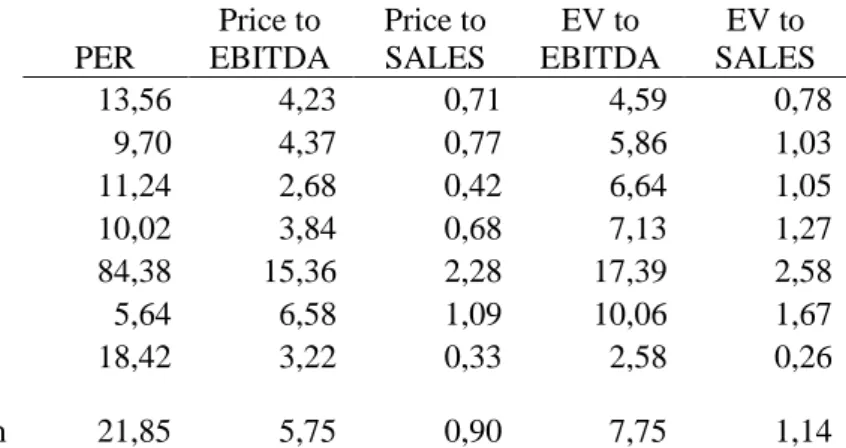
Figure 9: Peer group multiples
PER Price to EBITDA Price to SALES EV to EBITDA EV to SALES Michelin (Cgde) 13,56 4,23 0,71 4,59 0,78
Toyo Tire & Rubber Co Ltd 9,70 4,37 0,77 5,86 1,03
Kumho Tire Co Inc 11,24 2,68 0,42 6,64 1,05
Nexen Tire Corp 10,02 3,84 0,68 7,13 1,27
Nan Kang Rubber Tire Co Ltd 84,38 15,36 2,28 17,39 2,58
Multistrada Arah Sarana Tbk 5,64 6,58 1,09 10,06 1,67
Goodyear Indonesia Pt 18,42 3,22 0,33 2,58 0,26
Mean 21,85 5,75 0,90 7,75 1,14
29
Figure 10: Pirelli price with multiples
in Euros PER P/EBITDA P/SALES EV/EBITDA EV/SALES
31st December 2014 14,68 14,14 11,38 16,63 12,07
1Yr Forward 21,90 15,00 12,11 17,39 12,60
Source: Bloomberg’s data base and own calculations. Even though results vary, it is noticeable that the multiples can support the DCF valuation on the price per share of 14,39 Euros at the end of 2014, as they average at 13,78 Euros. The one year forward estimations average at 15,80 Euros, due to the high figure of price-earnings, which if ignored the average would be 14,27 Euros.
30
6. INVESTMENT BANK REPORT COMPARISON: J.P. MORGAN
In this next section a J.P. Morgan report concerning Pirelli will be compared to this thesis. The report dates from 7 of November of 2014 and presents predictions up to 2016.
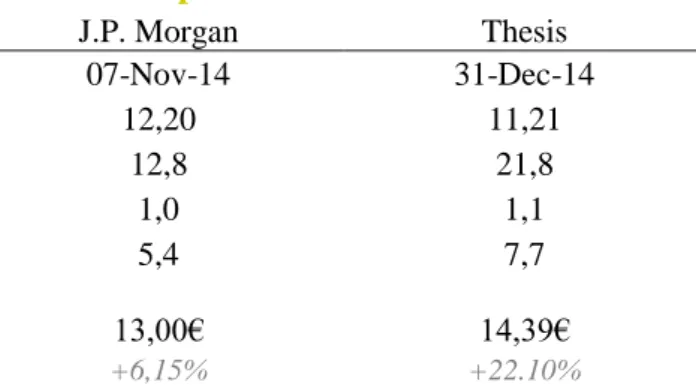
Figure 11: J.P. Morgan and thesis valuation comparison
J.P. Morgan Thesis
Date 07-Nov-14 31-Dec-14
Price 12,20 11,21 Industry PER 12,8 21,8 Industry EV/Sales 1,0 1,1 Industry EV/EBITDA 5,4 7,7 Target Price 13,00€ 14,39€ +6,15% +22.10%
Source: JP Morgan report and own calculations. Figure 11 illustrates some differences in the valuations, but the major difference is that J.P. Morgan opted to value Pirelli based only on one multiple, the enterprise value to sales, where the main valuation approach of this thesis was the discounted cash flow model. Even so, in the past section it was computed the enterprise value to sales and the target price would be 12,07 Euros, this difference happens mainly because of two reasons: J.P. Morgan estimated the last quarter of 2014 and the companies selected in the industry peer group were also different.
Nevertheless, J.P. Morgan recommendation is neutral, as they expect the stock to perform in line with the market in the next six to twelve months, whereas the thesis recommendation is to buy, expecting an increase in the share price for the nearest term. Note to the fact that J.P. Morgan’s reports never recommend buying neither selling a stock. Their comments are concerned to the performance of the company relatively to the market, namely it is underweight, overweight, or neutral, if it is expected to underperform, outperform, or perform according to the average market return.
Although the investment bank valuation lies on one multiple, J.P. Morgan presents some estimations which are based on current market industry events, news and announcements made by Pirelli. Alike this thesis, J.P. Morgan expects a growth in the replacement tyre market, as well as a cost saving forecast, which stands in line with Pirelli’s goals.
31
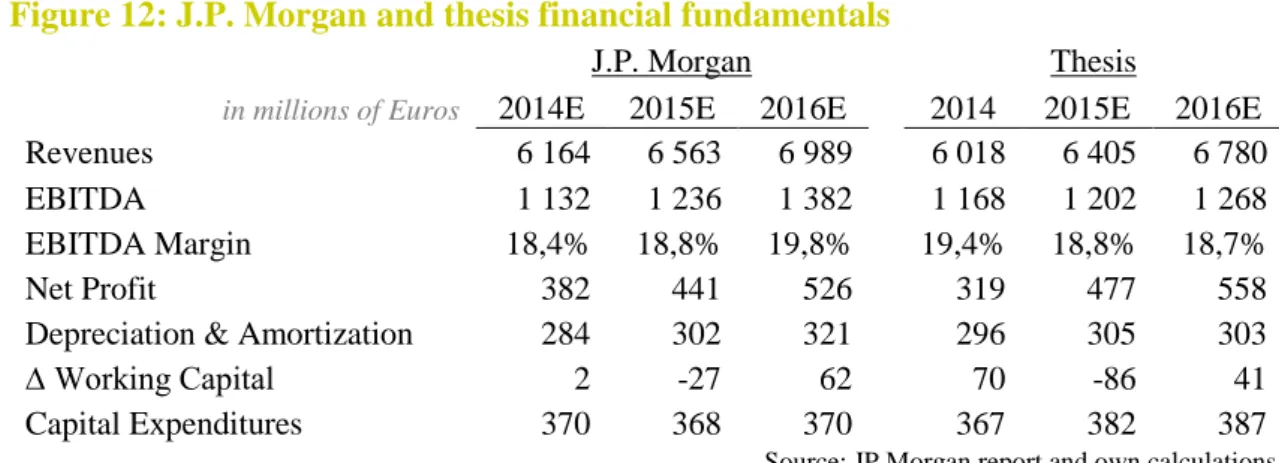
Figure 12: J.P. Morgan and thesis financial fundamentals
J.P. Morgan Thesis
in millions of Euros 2014E 2015E 2016E 2014 2015E 2016E
Revenues 6 164 6 563 6 989 6 018 6 405 6 780
EBITDA 1 132 1 236 1 382 1 168 1 202 1 268
EBITDA Margin 18,4% 18,8% 19,8% 19,4% 18,8% 18,7%
Net Profit 382 441 526 319 477 558
Depreciation & Amortization 284 302 321 296 305 303
∆ Working Capital 2 -27 62 70 -86 41
Capital Expenditures 370 368 370 367 382 387
Source: JP Morgan report and own calculations. Looking at figure 12, it is possible to see that most projections are similar between both exercises with the exception of the changes in working capital, where in 2014, the investment bank predicted a difference of two million Euros and it was seventy million. This difference is explained in part by the revenues from the South American market in the last quarter of the year, which are typically high and in 2014 lead to an increase in both receivables and inventory.
32
CONCLUSION
The thesis was a great academic exercise which allowed an enhancement of knowledge in the field of finance studies. Being the goal to valuate an asset, in this case Pirelli, many findings were discovered.
Several methodologies can and could be applied to retrieve a share price for Pirelli, and although there is no proven correct approach, the DCF was the one applied since it is believed as complete and relevant method. The final result was a current enterprise value of 9 154 032 044 Euros and a share price of 14,39 Euros, meaning that under the assumptions made in this thesis the price would be 22,10% higher and subsequently a great investment opportunity.
Obviously there are several assumptions that could have driven the final price towards other directions, being the most relevant ones the growth rate in perpetuity and the WACC. It was assumed a growth of 1,50% because it is my belief that a company as big and competitive as Pirelli will continue generating profits in the long-run. Regarding the discount rate, simple alterations would have made an impact on the share price, for example the option to not use a country risk premium, or the periodicity of the data applied for the estimation of the cost of capital.
For a further study on Pirelli’s value, the dividend discount model can be put in place, due to the quite stable dividend policy of the company. Other validation methods for a result can also be applied, for example a sensitivity analysis or a value-at-risk study. While comparing the thesis results to the ones reported by J.P. Morgan, it can be seen that both show a higher value for the price per share and similar estimations for financial figures in the future. Although J.P. Morgan has a neutral opinion regarding Pirelli, it cannot be considered as a bad investment opportunity, because if it is in line with the market, and if it is believed that markets keep growing on the long-run, an investor might consider having Pirelli on the portfolio.
33 ANNEXES
34
BILIOGRAPHY
Adserà, X., and Viñolas, P., (2003). "FEVA: A Financial and Economic Approach to Valuation”, Financial Analysts Journal, 59,2:80-88.
Andrade, G., and S.N. Kaplan. (1998). “How costly is financial (not economic distress)? Evidenced from Highly Leveraged Transactions that became distressed”, Journal of Finance, 53, 1443-1494.
Carrieri, F., Errunza, V., and Majerbi, B., (2006). “Does Emerging Market Exchange Risk Affect Global Equity Prices?”, The Journal of Financial and Quantitative Analysis, Vol. 41, No. 3, pp. 511-540.
Chance, D., and Peterson, P., (2002). “Real Options and Investment Valuation”, Research Foundation of CFA Institute.
Copeland, T.E., and Antikarov, V., (2005). “Real options: Meeting the Georgetown Challenge”, Journal of Applied Corporate Finance.
Damodaran, A., (2005). “Valuation approaches and metrics: a survey of the theory and evidence”. Foundations and Trends in Finance Vol. 1. No 8.
Damodaran, A., (2010). “The Dark Side of Valuation: Valuing Young, Distressed, and Complex Businesses”, 2nd ed.
Du, J., and Choi, J.N., (2010). “Pay for performance in emerging markets: Insights from China”, Journal of International Business Studies, Vol. 41, No. 4, pp. 671-689.
Fernández, P., (2001). “Valuation using multiples: How do analysts reach their conclusions?”.
Fernández, P. (2002). “Valuing Companies by Cash Flow Discounting: Ten Methods and Nine Theories”, IESE Business School.
Gilbert, G., (1990). “Discounted-Cash Flow Approach to Valuation”, Research Foundation of CFA Institute.
Goedhart, M., and Haden, P. (2003). ‘’Emerging markets aren’t as risky as you think’’, The McKinsey quarterly, special edition.
Goedhart, M., Koller, T., and Wessels, D., (2005). “The right role for multiples in valuation.”. Harvey, C., (1995). “Predictable Risk and Returns in Emerging Markets”, The Review of Financial Studies, Vol. 8, No. 3, pp. 773-816.
Koller, T., Goedhart, M., and Wessels, D. (2005). “The right role for multiples in valuation”, McKinsey on Finance.
Koller, T., Goedhart, M., and Wessels, D. (2010). “Valuation: measuring and managing the value of companies”.
35
Lee, C., (2003). “Choosing the Right Valuation Approach”, AIMR Conference Proceedings: Equity Valuation in a Global Context.
Parrino, R., (2005). “Analyzing, Researching, and Valuing Equity Investments”.
Peterson, P. P., and Peterson, D.R. (1996). “Company Performance and Measures of Value Added”.
Ploeg, F., (2011). “Natural Resources: Curse or Blessing?”, Journal of Economic Literature, Vol. 49, No. 2, pp. 366-420.
Rappaport, A., (1986). “Creating Shareholder Value: The New Standard for Business Performance”.
Stowe, J.D., Robinson, T.R., Pinto, J.E., and McLeavey, D.W. (2002). “Analysis of Equity Investments Valuation”.
Trigeorgis, L., (1996). “Real options: Managerial flexibility and strategy in resource allocation”, The MIT Press, Cambridge.