Dissertation submitted in partial fulfillment of the requirements for the degree of MSc in
“The Role of European Emerging Markets in Europe’s transition to
renewable energy: A managerial outlook of the cases of Bulgaria and
Romania”
António Andreta Morais
152118059
Abstract
Dissertation Title: The Role of European Emerging Markets in Europe’s transition to renewable energy: A managerial outlook of the cases of Bulgaria and Romania
Author: António Palminha Andreta Morais
As Europe aims to simultaneously reduce its prevailing energy dependency on imports and its CO2 emissions, there is a rising need for a sustainable, affordable and secure energy system transition, capable of addressing challenges and creating value. The encouragement of diversification of the EU's energy mix with renewable energy has been the key measure fostering this transition. However, evolving to renewable energy is challenging in regard to implementation, as it possesses limitations such as intermittency, rising energy prices and difficult integration to the grid.
Emerging markets are a peculiar set of countries characterized by their strong economic growth and transition to more inclusive institutions, which present opportunities for this transition in the long run. Accordingly, Bulgaria and Romania are thoroughly studied to understand what role and impact they will have in Europe’s transition to renewable energy. The findings rely deeply on policymaking and, by performing analyses to secondary data and conducting expert interviews with energy specialists, two scenarios were achieved. One relies on positive prospects such as more diversified support-schemes, proper decisions regarding current energy sources used, and encouraged foreign direct investment. The other relies on the continuance resistance towards renewable energy sources and its limitations without pursuing strategies to soothe it. With proper policymaking and adequate incentives suited to their socioeconomic environments and in the right renewable energy sources, these markets can not only help Europe transit faster to clean energy, but also disincentivize Russia, the main supplier of EU’s energy, of producing crude oil and petroleum products.
Key words: emerging markets, energy dependency, renewable energy, energy consumption, policymaking, biomass, nuclear, Europa, FDI, energy transition, electricity, post-monopoly
Resumo
Título da Dissertação: O Papel dos Mercados Emergentes Europeus na Transição Energética da Europa para Energia Renovável: Uma perspetiva dos Casos da Bulgária e da Roménia Autor: António Palminha Andreta Morais
No caminho em que a Europa se encontra focada em reduzir a sua significativa dependência energética em importações e as suas emissões de CO2, há uma crescente necessidade de transição para um sistema energético sustentável, acessível e seguro, capaz de responder a desafios e criar valor. O encorajamento das energias renováveis tem sido a principal medida para alcançar esta transição. No entanto, a evolução para energia renovável é desafiante na sua implementação devido a várias limitações, tais como a sua intermitência, preços altos e a complexa integração na rede.
Os mercados emergentes são um conjunto peculiar de países caracterizados pelo seu forte crescimento económico e transição de instituições exclusivas para inclusivas, representando oportunidades para ajudar nesta transição. Por este motivo, a Bulgária e a Roménia são minuciosamente estudadas de forma a entender o seu papel e o impacto que terão. Os resultados demonstram a elevada importância de políticas e, complementando com dados secundários e entrevistas com especialistas de energia, dois cenários com foco no futuro foram construídos. O primeiro baseia-se em perspetivas positivas como uma maior diversificação de apoios, investimentos nas energias renováveis com maior potencial e criação de incentivos para investimento estrangeiro. O segundo, baseia-se na continuação das políticas atuais e na resistência à energia renovável, sem seguir estratégias que atenuem as limitações. Dependendo das estratégias seguidas, não só conseguem estes mercados apoiar a transição energética da Europa, mas também desincentivar a Rússia, a principal fonte de importações de energia da UE, na sua produção de combustíveis fósseis.
Palavras-chave: mercados emergentes, dependência energética, energia renovável, consumo de energia, elaboração de políticas, biomassa, nuclear, Europa, investimento estrangeiro, transição energética, eletricidade, pós-monopólio
Acknowledgments
Behind the realization of this dissertation and the effort invested in it, there are a number of people who have contributed either directly or indirectly to it, who deserve to be mentioned. Firstly, I would like to thank the opportunity of developing this thesis with Professor André Pinho’s supervision, who helped me to improve the quality of this dissertation and was always available to give the best advice.
To my family who have supported me throughout my whole academic journey in every way, my sincere thank you.
I also want to acknowledge my colleagues at EDP, specially Hugo Nogueira, for allowing me to have a great work experience during my thesis semester and for always being flexible with anything related to school.
Lastly, to my close friends who have supported me in this time and who gave me strong advice whenever I needed, highlighting Raquel Peralta and Diogo Ribeiro, I express my gratitude.
Table of Contents
1. Introduction 7
2. Literature review 8
2.1 The energy sector 8
2.2 Renewable Energy vs. Conventional Energy Sources 9
2.3 Drivers of Renewable Energy Implementation 10
2.3.1 The Role of Policy Design and Support Schemes 10 2.3.2 The Role of Entrepreneurship and Private Investment 11
2.4 Emerging markets 12
2.4.1 Inherent risks 12
2.4.2 Romania and Bulgaria: The Up-and-Coming Economies 13
2.5 Energy sector in Romania and Bulgaria 13
2.6 Post-monopoly Context 14
3. Methodology 16
3.1 Methodology design 16
3.2 Data Collection 17
4. Analyses 18
4.1 Characterizing the Energy Market of Bulgaria and Romania 18 4.1.1 Inconsistencies Between Emerging and Developed Markets 21
4.2 Policy instruments for Renewable Energy Boosting 21
4.2.1 Romania’s Context 21
4.2.2 Bulgaria’s Context 22
4.3 Characterizing EU’s Energy Market Path 23
4.3.1 Energy Consumption and Response Capabilities Throughout the Years 24
4.4 The Position of Bulgaria and Romania in the EU 25
4.5 Achieving the Targets and Contrasting to the Leading Countries in RE 26
5. Discussion and findings 28
5.1 The Ramification of other Energy Sources 28
5.1.1 Biomass in Romania 28
5.1.2 Nuclear Power in Bulgaria 29
5.2 The Impediment of Energy Costs and Price 30
5.3 Policy Designs and Their Success Rate Across Europe 30 5.4 Implementation of RES in Romania and Bulgaria vs. in Developed Markets 31 5.5 Implementation of RES in the EU: Future Prospects and Implications 32
5.5.1 The Influence of Energy Dependence
5.5.2 The Role of Electrification in RES 32
5.6 Can Bulgaria and Romania achieve the 2030 RE Targets? 33
6.1 The Context of Europe 35
6.2 Sustainable Development Scenario 35
6.3 Current Policies Scenario 37
7. Conclusion 39
8. References 40
9. Appendices 4444
Figures Index
Figure 1. Energy mix of the gross inland consumption of Bulgaria in Mtoe (1996-2016) 18
Figure 2. Energy mix of the gross inland consumption of Romania in Mtoe (1996-2016) 18
Figure 3. Contribution of renewable energy in final energy consumption of Bulgaria and Romania (%) 20
Figure 4. Dependency rate on energy imports in Romania from 2008 to 2017 20
Figure 5. Dependency rate on energy imports in Bulgaria from 2008 to 2017 20
Figure 6. Comparison of grid access costs and lead times between different types of European Markets 21
Figure 7. Gross inland consumption by fuel, EU-28, 1990-2017 23
Figure 8. Electricity production by source, EU-28, 2018 23
Figure 9. EU primary and final energy consumption and linear trend from 24
2005 to 2020 targets Figure 10. Russian gas exports and destinations (billions of cubic meters) 24
Figure 11. Share of Renewable energy in total final energy consumption, in %, 2017 26
Tables Index
Table 1. Interviewees’ Professional Positions, Type of Company and Range of revenues 17 Table 2. Potential of Renewable Energy in Bulgaria and Romania in ktoe 18Table 3. Production Capacities per energy source of Bulgaria and Romania 19
List of Acronyms
RES Renewable Energy Sources RE Renewable Energy
RE-HC Renewable Energy - Heating and Cooling RES-E Renewable Energy Sources - Electricity Mtoe Million Tonnes of Oil Equivalent
Ktoe Kilotonne of Oil Equivalent kWh kilowatt hour
EU European Union
1. Introduction
This paper intends to scrutinize both Romania and Bulgaria’s future prospects of the energy sectors, as well as the EU’s necessity to transit to clean energy. This necessity is leading to a growing pressure within EU members to boost the share of renewable sources from total energy consumption (Hilmarsson, 2012). However, with all their benefits, these energy sources possess various limitations compared to conventional energy sources, which are described and analyzed in this paper. As such, this dissertation examines the role of these two emerging countries in Europe’s transition to renewables, based on policy design and its trade-offs on matters such as price, efficiency and energy poverty. More precisely, it aims to investigate current energy policies and accurately perceive how effectively can policy design influence the different scenarios of future developments.
The objective of this research is to assess to what extent Bulgaria and Romania can impact the European energy market’s transition to renewables, given this market outlook. In order to successfully achieve conclusions, three research questions were formed:
1) What is Bulgaria and Romania’s potential for renewables and its technological and political limitations?
2) How can renewable energy be successfully fostered?
3) What role can Bulgaria and Romania play in the European Energy market in the future? Romania and Bulgaria were chosen due to their similar economic and social structures. Both share a similar historic development, being ex-communist countries that later joined the EU simultaneously in 2007 (Davidescu et al., 2018). Likewise, both countries are homogeneous in their transitions from central planning to market economies, which development took effect within the decade of 1990 to 2000 (Ahrens et al., 2012). The countries chosen also distinguish themselves by the need to fill the infrastructure gap between developed countries and emerging markets, which, among other factors, reshapes the strategy of companies that wish to invest in the sector (Marinescu, 2019).
2. Literature review
This chapter tackles the most relevant concepts regarding the research questions. These include renewable energy’s disadvantages against fossil fuels, emerging markets and their inherent risks and the drivers of renewable energy. Furthermore, not only it is studied the energy sector of Bulgaria and Romania, but also it is investigated the post-monopoly implications, which entail connotations to the development of the industry as a whole.
2.1 The energy sector
The energy sector in Europe is heavily regulated, which, among other factors, derives from the concept of public service and its ramifications to the basic necessity it satisfies (Zamfir et al., 2016). Moreover, for the past years, the EU has carried out an array of reforms regarding the distribution of affordable energy to consumers, boosting energy security and decarbonizing the sector (Shivakumar, 2019). These reasons demonstrate the large interest of the sector for governments and their citizens, which consequently also leads to a great dependence on public intervention, regardless of its source (Zamfir et al., 2016). Also, for the past twenty years, the energy sector has been through significant developments and changes, from competition rules being tailored to consumer welfare to markets being liberalized (Tanțău et al., 2019). The world’s dependence on fossil fuels is also concerning when looking at the population growth and living quality (Baruah et al., 2018). Thereupon, due to the energy sector’s role in that dependence, the energy policy sector is being modernized, in light of sustainability concerns towards the use of resources (Tanțău et al., 2019).
Energy security, which is the capability of a country to deliver the energy necessary to ensure its welfare, is also a factor that policymakers pay a lot of attention at, in order to provide stable prices and prevent supply disruptions (Colesca, 2018). The EU’s energy dependence in 2017 was 55%, which means more than half of the necessary energy was supplied by imports (Brito et al., 2019). Russia is the main supplier of EU’s energy, accounting for 30% of petroleum imports, 39% natural gas imports and 40% of coal imports (Brito et al., 2019). Diversification of supply to decrease this dependence is, therefore, one of the key objectives of the EU (Colesca, 2018).
Between the years of 2000 and 2010, renewable energy’s gross consumption in the EU increased significantly by 77.8%, and from 2010 to 2016 the growth accounted was 23.6% (Marinescu, 2019). The continuous growth is fitting following a directive that came to the scene
by the end of 2018, establishing a new target for the share of renewable energy on gross consumption, appointing a minimum of 32% by 2030. This indication surpassed the previous established share of 20%. Therefore, EU’s policymakers must be aware of the change and set plans to leverage it (Papieża et al., 2019).
2.2 Renewable Energy vs. Conventional Energy Sources
Some of the EU’s key objectives are sustainable development and reduction of energy dependence and, in order to achieve them, one crucial measure is diversifying energy sources. This includes tide, wind, solar, biomass, wave, geothermal and hydro energy. However, these energy sources are not as competitive as it is desired (Abrell et all., 2019).
Renewables is the term used for all forms of energy that are naturally restored and are non-fossil (Marinescu, 2019). Investing in these energy sources has numerous interests for the society and the economy. Reducing the countries’ dependence on fossil fuels and reducing geopolitical risks coming from the import dependency are among them (Zamfire et al., 2016). Also, nuclear power represents risks for society due to its wastes and building new nuclear plants demands more technical and safety resources than renewables (Nanda, 2015). Furthermore, renewable energy technologies have been showcasing a decrease in costs, which are expected to continue (Zamfir et al., 2016).
However, one significant concern is that renewable energy technologies have not yet achieved cost competitive prices compared to fossil fuels technologies (Gillingham et al., 2012). Additionally, renewable energy coming from wind and solar sources present a high heterogeneity in terms of spatial availability and temporality (Abrell et all., 2019). This leads to an inability to satisfy significant fluctuations in electricity consumption, which is an obstacle to the arrangement of renewables and a difficulty to fully replace fossil fuel sources (Marques et al., 2018). In addition, renewable energy is linked with landscape, flora and fauna changes and visual pollution (Zamfir et al., 2016).
Despite the existence of other alternatives to fossil fuels, renewables will be the most efficient one considering the unapparelled amount of venture capital investment they have attracted throughout the years (Nanda, 2015).
2.3 Drivers of Renewable Energy Implementation
The implementation of renewable energy electricity generators is still highly dependent on economic support opportunities and on supportive policy environment (Shivakumar et al., 2019). As policy certainty is considered to be a key facilitator of the success of renewable energy operations, projections of future trends in this sector are vital to assess the impact of policies (Shivakumar et al., 2019). Additionally, society also plays an important role in promoting sustainable and innovative energy practices (Tsagarakis et al., 2018). Accordingly, education, information and standards can be used as an indirect instrument to support renewable electricity (Zamfir et al., 2016).
Support schemes can be grouped in two different ways: price-driven instruments or quantity-driven instruments. The former, such as feed-in tariffs, set an assured price for renewable electricity to encourage renewable sources stationing while the latter, such as green certificates based on quotas, bring a constraint on quantity which impacts the market price of renewable electricity (Zamfir et al., 2016).
2.3.1 The Role of Policy Design and Support Schemes
Economics of renewable energy support have been studied to a wide extent. Policy design for such industry is not definitive on whether it should be subsidized or whether carbon pricing is the best alternative (Tientenberg, 2013). However, carbon pricing, a tax to disincentive greenhouse emissions, is the best option in terms of cost and efficiency on most cases (Abrell et al., 2019). Despite that, promotive policies for renewable energy such as wind and solar power are the most commonly used, mostly due to political reasons towards carbon pricing (Meckling et al., 2017).
The complexity of policy design for renewable energy begins with its own intrinsic business model. The bridge between intermittent renewable energy sources and efficient policy design must not only be differentiated to reflect their environmental value, but most importantly, the way renewable energy is financed is crucial in policy design (Meckling et al., 2017). In addition, the impact of renewable energy policies on electricity prices varies significantly depending on whether wind or solar energy is subsidized (Abrell et all., 2019). Moreover, if the option for carbon pricing is unavailable, renewable energy support policies that are optimized can be regarded as the best option in terms of cost (Abrell et al., 2019).
The promotion of renewable energy sources should not be done exclusively by increasing production (new wind farms or PV plants). This boosts inefficiency in resource allocation by not being able to exploit power plant’s full capacity, due to RES intermittency (Marques et al., 2018). Likewise, excess capacity is an inaccurate strategy due to the guaranteed prices over long term contracts, originated by feed-in tariffs. This unpredictability of wind and solar power has put a significant pressure on the electricity production system, in which hydropower and its energy storage capability alone has proven not to be enough to secure demand. Bioenergy, on the other hand, is viewed as a possible key renewable energy source in assisting other renewable sources to grow because of their intermittency and occurrent consumption peaks (Marques et al., 2018).
While some countries choose exclusively one support scheme for renewable energy, as in the case of both Latvia and Lithuania that rely on feed-in tariffs to achieve their RES targets, others use a mixed support scheme, as is the case of Belgium and Italy. Support schemes should be chosen according to local conditions of renewable energy sources and the costs on the technological maturity of the country (Zamfir et al., 2016).
2.3.2 The Role of Entrepreneurship and Private Investment
Foreign Direct Investment (FDI) is one of the main factors driving energy business investment in emerging markets (Devine et al., 2019). Likewise, the relationship between the degree of FDI and energy consumption in emerging markets is significantly positive (Kunofiwa et al., 2018). Notwithstanding, financial and economic development is positively correlated with renewable energy consumption (Anton et al., 2019). Furthermore, openness to international trade, which relates to the amount of FDI a specific market is able to attract and to the effectiveness in which they diffuse international trends, fosters the introduction of new technologies in a country (Santacreu, 2015; Karolyi, 2015). Specifically, the energy sector is dynamic and has been through significant changes. Its success depends heavily on being on the frontier of investment (Karolyi, 2015). Moreover, the creation and development of more efficient technology significantly helps embody renewable energy more efficiently in the energy mix (Abrell et al., 2019).
The business models used by the renewable energy sector are under-researched, making it harder to identify the skills associated with its success (Baruah et al., 2018). Nonetheless, entrepreneurship has been essential for the economic development and growth of the sector in many emerging countries (Surie, 2017). Also, as a result of public intervention on the
renewable energy sector and its volatility, private investment entails a significant political risk (Zamfir et al., 2016). Moreover, the internationalization of firms and the corporation’s investment in social responsibility are positively correlated. This shows the increasing concern of most companies for sustainability in the process of internationalization (Attig et al., 2016). Corporate mergers and acquisitions have also played an important role in encouraging renewable energy since various firms have increased their value due to synergies, greater market share and risk diversification in this industry (Yoo et al., 2013). Also, M&A promote the integration of national economies and their internationalization in order to enhance their competitiveness and diversification of portfolios in the global market (Karolyi, 2015).
2.4 Emerging markets
Emerging markets differentiate themselves by carrying a history of null foreign investment and later transition to market economies (Mody, 2004). This transition is mainly economical but also institutional, aiming at a more inclusive environment and at policymaking that developed markets already enjoy (Mody, 2004). However, it can not be expected that emerging markets are evolving into an identical western economy (London et al., 2004). In addition, they represent higher volatility environment in comparison to developed markets. Political risk is considered the most impactful factor towards growth (Schindler, 2004). Therefore, the challenge in policymaking in these markets is the combining the volatility and the transitional features of emerging markets (Surie, 2017).
Nevertheless, these markets are characterized by having significant growth in numerous variables such as GDP and population. The middle class is exponentially increasing and, as the economy and the middle class grow, the energy demand rises as well (EY, 2013). These markets are, therefore, gaining recognition from multinational companies (London et al., 2004).
2.4.1 Inherent risks
Investing in emerging markets entails risks, regardless of the industry. These risks represent an impediment for the inflow of capital in emerging markets (Marcum, 2018). These mainly include political risks due to the volatility of policymaking and some companies pay large amounts of money to avoid its repercussions, which in the long run will reduce the cost of funding projects (Hilmarsson, 2012; Marcum, 2018). It is not clear whether the government should issue guarantees for the private sector since there is an undesirable risk of liability.
However, in case of poor management of infrastructure, which entails a significant risk, it is appropriate that the investor endures it, therefore ensuring more chances of success compared to the scenario where the government assumes the risk (Hilmarsson, 2012).
Besides the widely used corporate governance as risk buffer to protect companies, the World bank provides insurances to foster investment and mitigate risk in these markets (Chang et al., 2015). There are several examples of risk mitigation products, which attract private capital investment in infrastructure, such as IBRD/IDA, partial risk guarantees (PRGs) and MIGA political risk insurance (PRI) (Delmon, 2009). The last two were expressly advised for energy infrastructures in these markets because, while PRGs cover risks from changes in law and difficulty or failure to enforce contracts and issue licenses, PRIs cover risks deriving from restrictions transference and expropriation, among many others. (Hilmarsson, 2012). In case the investors face risky situations, these collaterals compensate them, by reducing both the project costs and the inherent risk (Hilmarsson, 2012).
2.4.2 Romania and Bulgaria: The Up-and-Coming Economies
Bulgaria and Romania, as well as other eastern European countries, have been through strong economic reforms and transitions such as joining the EU (Jednak, 2017). They are connected to the level of economic development and its significant growth and they both joined the EU in the same year (Jednak, 2017). These two countries, which are considered emerging markets by the International Monetary Fund, present similarities in terms of the post-communist political background, which hindered their growth. Currently, they are transitioning to a developed market. This also created significant path dependencies in their energy transitions and the way they interact with EU policies (Davidescu et all., 2018). Renewable energy is an attractive option for emerging markets as it relies on locally accessible energy resources, mitigates environmental concerns, while being able to satisfy the rising demand for energy to sustain economic growth (Surie, 2017).
2.5 Energy sector in Romania and Bulgaria
As for the liberalization of the energy industry, Romania and Bulgaria are in line with the EU’s requirements, since they have removed barriers of entry for foreign investors and also empowered consumers. As an example, large energy companies have invested in Romania’s energy sector from ENGIE to ENEL, demonstrating that liberalization succeeded, and attractiveness has improved significantly (Tantau et al., 2019).
Romania is one of the countries in Europe with the highest share of intermittent renewables, such as solar and wind, on total electricity consumption and has gone through significant changes in the energy sector (European Bank, 2018). Between 2008 and 2016, Romania recorded a decrease of 35% on CO2 emissions mainly due to the shut-down of several coal-based power plants. Those that remained active reduced their emissions by 40% (Dragos et al., 2015). The total of accredited electricity producers from renewable energy went up from 23 in 2008 to 629 in 2014 and has improved the lack of connectivity of the energy network in rural areas (Lazar, 2017). Following the implementation of green certificates in 2014, Romania’s renewable energy market became more attractive for companies (Tantau et al., 2019).
Bulgaria’s energy sector is still highly dependent on energy imports, with a 35.4% dependency, mainly consisting of oil and gas (Nikolaev et al., 2017). Bulgaria has a National Renewable Energy Action Plan, which includes 38 measures to achieve the targets imposed by the EU. These measures thoroughly address the trajectories of renewable energy in relevant areas of energy consumption such as electricity and transmission (Nikolaev et al., 2017). In addition, Bulgaria is highly affected by significant energy poverty, since it has the highest share of population in the EU not able to keep its their residencies properly warm (European Commission, 2019).
The state still has a dominant position in the energy sector in these two countries, which influences its development by possessing a vigorous path dependence on energy regulation and distribution (Davidescu et al., 2018). Notwithstanding, Bulgaria and Romania have already reached their 2020 targets for renewable energy share, which is explained partially by their rich potential (Davidescu et al., 2018).
2.6 Post-monopoly Context
At a certain time, across Europe, the energy sector was nationalized and fully controlled by the state (Tanțău et al., 2019). And, even though privatization is not a mandatory fulfillment for liberalization, it is clear that privatization carries benefits, notably if combined with effective restructuring, regulation, and competition (Jamasb et al., 2005). The liberalization process in the EU entailed that companies needed to adjust to different frameworks of regulation (Capece et al., 2013). Currently, energy is considered a commodity, opening a wide range of opportunities for foreign companies to invest in this market (Tanțău et al., 2019). These changes have allowed the energy sector to be more consumer centric and competitive (Erdoğdu, 2014).
Nevertheless, there are asymmetric strategies among former monopolies, primarily used to maintain their dominant position and barriers of entry (Bonardi, 2003; Capece 2013). This happens because former monopolies, after many years of working with the government, use defensive policies to their advantage (Bonardi, 2003). In addition, the EU’s directives that aim to decrease market power of dominant incumbents continue to be ineffective (Erdoğdu, 2014). When both the host and home governments are involved, their international relationships dictate the smoothness of the internationalization of the firm (Bonardi, 2003). If the interests of the host government and the former monopoly are aligned, that might, consequently, hurt those who wish to enter the market (Bonardi, 2003; Erdoğdu, 2014).
3. Methodology
This chapter presents the methodology used to build this dissertation and consequently present reliable proposals and conclusions. The chapter consists by its design followed by an explanation of the data collected throughout the analyses and validation.
3.1 Methodology design
In order to pursue the main purpose of this dissertation, which is to understand the impact of Bulgaria and Romania’s current and future potential in Europe’s transition to clean energy, a bottom-up approach was followed. The analyses start with the countries’ outlook followed by a European perspective and then consolidate both in order to achieve plausible recommendations and conclusions.
Firstly, Bulgaria and Romania’s energetic markets were studied by analyzing their energy mix throughout the years. Accordingly, it is studied their full potential in energetic matters, their evolution possibilities and the support schemes and policies currently available and followed. The same process was done for the EU. Finally, the role of these two countries in the EU scope was studied, such as their positions in the renewable energy race, their share of total energy production in the EU and the gap between the targets made for their energetic development and their policies’ potential to do so. Finally, it is examined how this will evolve in the future, showcasing different scenarios based on expert interviews.
3.2 Data Collection
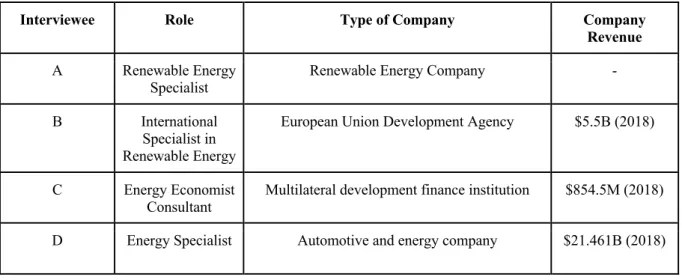
In order to provide credible and relevant conclusions and recommendations, this dissertation was based both on primary and secondary data. Firstly, it was conducted an analysis on secondary data from various sources in order to describe the countries’ energy path and the EU’s, including their potential, current policy situation and future prospects in terms of growth and investment, complementing with relevant studies. Moving forward, to complement and validate the secondary data analysis it was chosen a primary data collection through expert interviews. As such, the primary data was collected by conducting interviews with energy specialists and energy policy specialists who have deep knowledge and experience with not only the environment of the energy sector in the EU but also renewable energy and its dynamics. Their roles and types of company they work at are represented in table 1. These interviews aimed to understand the main drivers of renewable energy, from the best policy
options to the trade-offs for countries such as Romania and Bulgaria, given their political, economic and environmental standpoints, and draw conclusions for the future. These lead to the construction of two scenarios, sustainable development scenario and current policies scenario that are based on different assumptions discussed during the interviews.
Interviewee Role Type of Company Company
Revenue
A Renewable Energy
Specialist Renewable Energy Company -
B International
Specialist in Renewable Energy
European Union Development Agency $5.5B (2018)
C Energy Economist
Consultant Multilateral development finance institution $854.5M (2018)
D Energy Specialist Automotive and energy company $21.461B (2018)
4. Analyses
4.1 Characterizing the Energy Market of Bulgaria and Romania
Figures 1 and 2 validate that both countries exhibit a great predominance of fossil fuel consumption (solid fuels and petroleum and products) throughout the years. However, the second biggest predominant energy consumed in each country differs. In Bulgaria, nuclear consumption was and remains highly significant in the energy mix. On the other hand, in Romania, gases steadily hold the second spot, even though nuclear gained some traction in the last decade. Natural gas holds the highest share of the gas consumption in these markets (EU ODP, 2016). In addition, in both countries, RES consumption started holding a significant share after 2010, mostly due to support schemes and focus on developing clean energy (Nikolaev et al., 2017). However, figures 1 and 2 demonstrate that Romania was quite ahead of Bulgaria in renewable share in total gross inland consumption, before and after 2010.
Renewable Source Bulgaria’s Technical Potential, in
ktoe
Romania’s Technical Potential, in ktoe
Hydropower 1290 3440
Solar energy (Thermal + PV) 7462 (6396 + 1066) 1536.2 (1433 + 103.2)
Wind energy 12000 1978
Biomass 1524 7597
Geothermal energy 331 167
Table 2: Potential of Renewable Energy in Bulgaria and Romania in ktoe (Kilotonne of Oil Equivalent)
(Source: NREAP)
Despite the growing and dominant investment of RES in wind and solar, one source that is scarcely exploited in Romania is biomass energy generation. Among the different renewable Fig. 1 Energy mix of the gross inland consumption
of Romania in Mtoe (1990-2016) (Source: EU ODP)
Fig. 2 Energy mix of the gross inland consumption
of Bulgaria in Mtoe (1990-2016) (Source: EU ODP)
energy sources, biomass represents the highest potential for Romania among renewable energy sources, as we can see from table 2. Yet, with little government attention (Zamfir et al., 2016). In Romania, 51.61% of RE potential comes from biomass, including agricultural waste, which is a segment scarcely used for energy production (Colesca et al., 2016). Romania is very rich in natural resources, among which are the hydrological networks and extensive water deposits. The region is characterized by having 4 very distinct seasons, with very hot and dry summers and rainy springs. The annual mean of rainfall is 637 mm and the duration of sunshine differs from the plain areas being 2100 to 2200 hours a year and in the lower area a total of 1800 hours. Additionally, the wind energy potential is very significant, mainly because Romania is composed by 31% mountains (the Carpathians) and 31% hills. The Carpathians are also very important for Romania’s hydrographic network (Colesca et al., 2013). Bulgaria, on the other hand, owes its rising renewable energy share mainly to hydropower (Nikolaev et al., 2017). However, as table 2 exhibits, its biggest renewable energy sources potential actually come from wind power, solar thermal specifically, and biomass.
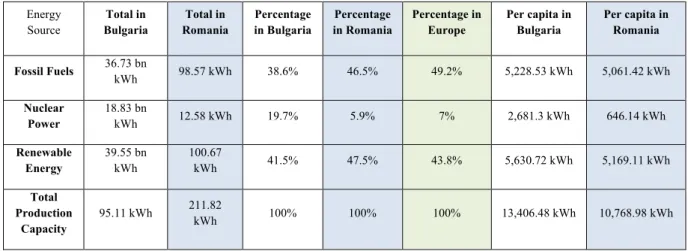
Energy Source Total in Bulgaria Total in Romania Percentage in Bulgaria Percentage in Romania Percentage in Europe Per capita in Bulgaria Per capita in Romania Fossil Fuels 36.73 bn kWh 98.57 kWh 38.6% 46.5% 49.2% 5,228.53 kWh 5,061.42 kWh Nuclear Power 18.83 bn kWh 12.58 kWh 19.7% 5.9% 7% 2,681.3 kWh 646.14 kWh Renewable Energy 39.55 bn kWh 100.67 kWh 41.5% 47.5% 43.8% 5,630.72 kWh 5,169.11 kWh Total Production Capacity 95.11 kWh 211.82 kWh 100% 100% 100% 13,406.48 kWh 10,768.98 kWh
Table 3: Production capacities per energy source of Bulgaria and Romania (Source: US Office of Public
Affairs)
Table 3 exhibits the full production capacities under ideal conditions. The values measure the generatable amount of energy that would be achieved under permanent and full use of all capacities of all power plants. Both Bulgaria and Romania present lower percentage of production capacities compared to Europe in all energy sources with two exceptions. Bulgaria has a 19.7% of nuclear power capacity against Europe’s 7% and Romania has a 47.5% capacity of renewables against Europe’s 43.5%. Between the two, Romania has a higher production capacity with 211.82 kWh. Contrastingly, Bulgaria has a higher total production capacity per capita, with 13,406.48 kWh. However, due to environmental restrictions, such as intermittency,
technological limitations and inefficiency in the process, the capacity of RES and the other energy sources are significantly smaller than the theoretical one that table 3 demonstrates (Nikolaev, 2017).
Following various incentives and external pressures, both countries have been showing a rising share of RE in its energy consumption throughout the years, reaching a value of 24% for Romania and 17% for Bulgaria, in 2016, as it can be drawn from figure 3. Both countries have reached their renewable energy targets for 2020 ahead of time, which were 24% for Romania and 16% for Bulgaria. In addition, as it is exhibit in figures 4 and 5, both Romania and Bulgaria have been experiencing a downward dependency on energy imports along the years, until 2015 for Romania and 2014 for Bulgaria. This is explained by a combination of low results of renewables, demonstrating again the intermittency of its nature, and a demand peak (Tantau, 2019). Both countries are among the 8 member states with the lowest energy dependency rate (Eurostat, 2017). Even though Romania demonstrates a significant difference in its low dependency compared to Bulgaria, both results relate to the increasing investment in their renewable energy potential, which allows both countries to be more self-sufficient. Romania has a 30% difference between its energy dependence share compared to the average of the EU (Zamfir et al., 2016). This richness allows Romania to be one of the lowest dependent countries in terms of energy with a 21.34% figure against the 53.83% average of the EU.
Fig. 3 Contribution of renewable energy in final energy
consumption (%) Blue: Romania, Green: Bulgaria (Source: Eurostat)
Fig. 4 Dependency rate on energy imports in
Romania from 2008 to 2017 (Source Statista)
Fig. 5 Dependency rate on energy imports in
4.1.1 Inconsistencies Between Emerging and Developed Markets
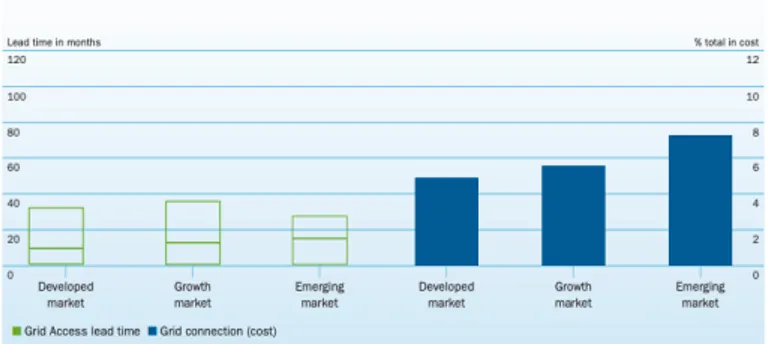
In respect to wind applications, the more developed the market in Europe is, the more transparent the decision-making process is (Petkova et al., 2013). However, emerging markets in Europe such as Bulgaria and Romania are stricter in following deadlines, due to the saturated administrative services in developed markets. Furthermore, even though in emerging markets there is a higher possibility of coming across significant problems, they are also the markets where delays are most uncommon (EWEA, 2010). While in emerging markets the average lead time is 27 months, the EU average is 42 months (EWEA, 2010). Figure 6 also demonstrates that because the projects of emerging markets are often connected to high voltage transmission lines, the costs of grid access are higher.
Considering these discrepancies, the most significant challenge is identifying the impact of a factor in a certain market since the duration of administrative policies and expected profitability of investment differs from each type of market (Shivakumar et al., 2019). It is therefore important to counterbalance what matters most in each investment.
4.2 Policy instruments for Renewable Energy Boosting 4.2.1 Romania’s Context
Romania’s support system for renewable energy is mainly focused on a quota system with tradable green certificates for low pollution, in which the government settles the maximum and minimum prices for them. Moreover, the Romanian Regulatory Authority for Energy (ANRE) has two objectives with this market, which are to reduce prices for the end consumer and to preserve the generator of renewable electricity (Zamfir et al., 2016).
Fig. 6 Comparison of grid access costs and lead times
between different types of European markets (Source: AEE and Fraunhofer ISI 2010, for WindBarries)
Additionally, the support scheme that complements the green certificates’ market is the co-funding of renewable energy projects through public intervention, whose main goal is to facilitate the implementation of economic and socially justifiable projects (Zamfir et al., 2016). This had one of the greatest impacts within the EU with two green certificates offered per MWh delivered, six certificates for photovoltaic energy producers and three green certificates for hydro energy producers (Zamfir et al., 2016).
Excessive development of this sector can lead to a decrease in competitiveness of European products due to the high costs of this industry, which leads to less affordability by consumers (Zamfir et al., 2016). This led the Romanian government to decrease the number of green certificates in 2013 and, in response, the government introduced a feed-in tariffs system for small producers, which is highly used in the EU (Zamfir et al., 2016).
4.2.2 Bulgaria’s Context
Bulgaria’s support scheme for renewable energy is more diversified than Romania’s. Even though it is more focused on a feed-in-tariffs scheme combined with quotas, which is determined by its regulatory entity annually, it also grants priorities of access to the grid (Nikolaev, 2017). Moreover, the regulatory entity states that all electricity transmission and distribution companies are obliged not only to widen their capacity to accommodate RES installations, but also to load shed, whose objective is to remove load from the power system when there is a disproportionate availability of electricity to its demand (Nikolaev, 2017). This system has set off great interest among local and international project developers (Kitzing, et al., 2012). In addition, there are certificates of origin, which allocates to the producers a certain amount of generated electricity, a production plant and a specific capacity and duration of production (Nikolaev et al., 2017).
Similarly to Romania, Bulgaria has conflicts with rising electricity prices due to growth of RES, which led to quotas being set to zero, with the exception of smaller producers (Nikolaev, 2017). Bulgaria’s regulator, TSO, struggled to accommodate the connection of all renewable projects into the grid because there were no simultaneous incentives to expand the grid to accompany successfully RE incentives. This represents a great obstacle since Bulgaria is one of the member states with the highest energy poverty (Andreas, 2018).
4.3 Characterizing EU’s Energy Market Path
Fig. 7 Gross inland energy consumption by fuel, EU-28, 1990-2017 (Source: Eurostat)
Figure 7 displays the EU’s energy sources during the period of 1990 and 2017. It demonstrates the dominance of fossil fuel over the years, with a slight fall-of starting in 2008 (Oil and petroleum products and solid fossil fuels). Renewables and biofuels, on the other hand, showcase a steady increase during this period, going from 100 million tonnes of equivalent to 200 million. This was due to the fact that investments in renewable energy technologies increased 5.5 times, between the period of 2004 to 2011 (Shivakumar, 2019). Notwithstanding, between 2011 and 2016, investments of RE fell by 60% as a result of political instability and investors’ uncertainty over policy changes that affect RE’s subsidies Future prospects for renewable energy rely deeply on developments of these factors, therefore there is an environment of uncertainty in Europe, which negatively influences investment (Shivakumar, 2019). Nevertheless, there is a directive aiming for a 20% RES share by 2020 and, in 2018, all member states signed an agreement to reach an adoption of at least 32% share of RES by 2030 to cut greenhouse emissions by 40% (Papiez, 2019).
The electricity sector is an area of great focus of decarbonization and it is expected that a figure close to half of electricity production in the EU will come from renewable sources by the year 2030 (Shivakumar, 2019). Furthermore, by the year 2040 there is an opportunity to establish additionally 843 GW of renewable capacity in the EU, representing a cost 1.2 trillion USD. This accounts for over 85% of total financing of all power generating capacity of Fig. 8 Electricity production by source,
Europe (Dentons, 2019). As of 2018, we can conclude from figure 8 that most of electricity produced is from conventional thermal (45.9%). However, wind, hydro and solar together represent a significant portion (28%). Therefore, the rising electrification process that has been overtaking sectors represents an growing opportunity for renewable energy.
4.3.1 Energy Consumption and Response Capabilities Throughout the Years
While primary energy consumption is a country’s demand for energy, final energy consumption is the total energy consumed by final users. Encouraging energy efficiency implies reducing final energy consumption, as energy is saved. The EU set a directive for a 20% energy efficiency target by 2020 (European Commission, 2019). As it is demonstrated in figure 9, the EU was successfully achieving lower final energy consumption values consecutively throughout the years, with the exception of 2010, until 2014. Since then, energy consumption has been rising and because of it, it is expected that the 2020 energy efficiency targets will not be attained (Thomas et al., 2019).
In response to these demand peaks, as it has been stated before, the EU is highly dependent on imports from Russia. Russia’s exports of petroleum products have increased from 100 Mt per year in 2005, to around 160 Mt per year in 2014, with EU as the main importer (IRENA, 2017). In addition, Russia’s production of crude oil increased in 2015 mainly due to the increase in exports to the EU (Gusev, 2013). Likewise, Russia’s gas exports to the EU have also been increasing, as we can see from figure 10. It shows that, not only is the EU its biggest exporter, but also the values grew from 127.8 in 2008 to 168 in 2018 in billions of cubic meters. Russia Fig. 9 EU primary and final energy consumption and
linear trend from 2005 to 2020 targets. (Source: Eurostat Energy Balance May 2018)
Fig. 10 Russian gas exports and destinations
has leveraged its market power to avoid competition and practice higher prices such as price discrimination between countries and predatory pricing (Zachmann, 2019). Encouraging the production and imports of these fossil fuels, not only hinder Europe’s implementation of RES, but also decreases its energy security and its subsequent factors like price (IRENA, 2017). The main sectors that affect energy consumption are transport, residential, services and industry. In addition, activity growth and energy efficiency are the two most critical factors that impact energy consumption (Thomas et al., 2019). Accordingly, the growth of energy consumption starting in 2014 represented in figure 9 results from activity growth ascending since the recession centered in 2012 with smaller energy efficiency gains every year, for the last decade. Nevertheless, an economic downturn coming from Brexit’s uncertainty, international trade’s tension and China’s economic growth deceleration pose great risks of a decline in energy consumption (Thomas et al., 2019).
4.4 The Position of Bulgaria and Romania in the EU
1990 1995 2000 2005 2010 2011 2012 2013 2014 2015 Share in EU-28, 2015 (%) EU-28 1085 1082.8 1133 1192 1164.5 1107 1108 1107.6 1061.7 1084 100 Bulgaria 16.4 11.4 9.1 10.2 8.8 9.3 9.2 8.8 9.0 9.5 0.9 Romania 40.8 27.0 22.8 24.7 22.6 22.8 22.8 21.8 21.7 21.9 2.0
Table 4: Final energy consumption, 1990-2015 (million tonnes of oil equivalent) (Source: Eurostat) As it is demonstrated in table 4, both Bulgaria and Romania’s final energy consumption grew
from 2014 to 2015, being in sync with EU’s trend. While Romania has a 2% share in EU’s total energy consumed in 2015, Bulgaria has a lower value of 0.9%. The countries with the highest shares are Germany (19.6%), France (13.3%) and the United Kingdom (12.1%). After Romania and Bulgaria entered the EU in 2007, both final energy consumptions diminished. Nonetheless, Romania and Bulgaria, being emerging markets and having a high economic growth, their tendency for final energy consumption is to increase (Davidescu et al., 2018). This represents an opportunity for RE to respond to this rise in demand because studies show that, in already high energy demand and developed countries, the transition to renewables is more challenging. It is difficult for renewable energy sources to generate power on the same large scale as fossil fuels do. As it is represented in table 3 in page 19, capacities of energy production are inferior in these two countries compared to the rest of Europe. Thereupon,
prioritization of security and need of accessible energy at all demand peaks becomes conflictual. In order to transit to renewables, policy makers must not only subsidize them but also encourage the development of energy storage development, making it a priority (Davidescu et al., 2018).
Figure 11 indicates the EU member states’ positions regarding their renewable energy share in 2017. It proves that Bulgaria and Romania have higher values than the EU’s average. Romania comes as the tenth member-state with the highest value with 25% and Bulgaria comes behind with almost 20%.
Moreover, Bulgaria has two scenarios for the integration of electricity from renewable energy sources to the grid in 2020 and 2030, presented by the Bulgarian Electricity System Operator (Nikolaev et al., 2017). One, which is more ambitious, aims for a 31% of RES-E share in the total electricity consumption by 2030 and is established on the assumption of accelerated innovation technologies to suppress the intermittency problem. These technologies include pump storage, responsive demand and accumulators. On the other hand, the other scenario is less ambitious based on an assumption of limited new technologies, aiming at 28.4% of RES-E share in 2030 (Nikolaev et al., 2017).
4.5 Achieving Targets and Comparing to the Leading Countries in RE
Romania intends to achieve a 28% target for RE in the gross final production of energy by 2030, a 40% target for RES-E and 31% for RE-HC. Bulgaria on the other hand, aims for a total target of 25% in terms of gross final production of energy by 2030, a shorter target of 17% for RES-E and a significant 44% for RE-HC (European Commission, 2019).
Fig. 11 Share of Renewable Energy in total final energy consumption, in
There is a significant contradiction in obtaining higher shares of RES, which is that acceleration of renewable energy implementation that is faster than technology development, as well as integrating it to the grid, can lead to higher prices for consumers. It is therefore relevant to compare with the most successful countries in this area.
Finland, the second most advanced country in renewable energy, invests a lot of resources on improving energy efficiency and energy audits (Motiva, 2019). Furthermore, it complements subsidies with carbon pricing, something Bulgaria and Romania have not done. As it was stated in the literature review, researchers believe carbon pricing could be more effective than subsidies. Sweden, another extremely advanced country in renewable energy, has a tax towards nuclear power, of about 0.75 Euro cents/kWh, and at the same time has subsidies for RE (World Nuclear Association, 2019). Complementing these policies, Finland is committed on being a leader in electromobility. Policies incentivizing consumers in purchasing electric cars allowed Finland to have an average emission for new vehicles in 2017 of 82gCO2/km while the EU target was 95gCO2/km (Nordic Energy Research, 2017). Denmark, on the other hand, also established a policy where 20% of shares of new wind farm must be sold to the communities in order to smooth the transition to clean energy and increase public investment (World Economic Forum, 2019).
The challenge is to overcome the price rise in order to successfully achieve the targets and positively impact the EU’s energy path in the years to come. Finland and Denmark’s social-economic environment have taken a big part in achieving high shares of renewables over the years (Motiva, 2019). Carbon policy is an example of such. However, their commitment to dynamic policies in incentivizing RES made a great difference.
5. Discussion and Findings
In this chapter, various insights were assembled from interviews with experts in the energy area.
5.1 The Ramification of other Energy Sources 5.1.1 Biomass in Romania
Interviews with experts were unanimous that even though Romania’s biomass energy potential can help achieve its RES targets, investing in it should be dependent on various factors and limitations. Firstly, it is not currently pursued because of a lack of logistical capability in saving and distributing biomass, and also because energy and trade policies do not recognize this as a priority. Investment in Biomass is most appropriate when there is cost-effective access to feedstock, industrial processes or other pathways, whilst addressing local energy demand. However, it is possible for the LCOE (levelized cost of energy) of solar and wind to be more competitive, which justifies the focus on these RES and not so much on biomass.
The most cost effective and environmentally beneficial sources of biomass are typically wastewater, municipal waste and waste streams from the agricultural, forestry and industrial sectors due to their easy accessibility and availability. However, in Romania, where vast forest land is already exploited to the limit, this could cross the limit of sustainability. These forests are under the laws of the Ministry of Environment, Water and Forests, which currently considers their residuals the only forestry biomass available for usage. So, the achievable potential is much lower than the theoretical potential due to environmental, economic and social limitations. As it has been regarded from the analysis, despite Romania’s wide range of crops and consequential agricultural waste, only a few of those are used for energy production. Additionally, the legislation around agricultural land is much easier to work around biomass investment. This could be a great opportunity for Romania since the demand for bioenergy is very high in European countries.
Based on the arguments above, we can conclude that Romania has advantages in investing in its high potential of biomass, even though not at a rate in which it should shift the focus that it has been putting on wind, solar and hydro. It should be gradually executed, taking advantage of sources that are easily accessed and are being wasted. Thus, insight 1 is postulated as follows:
Insight 1: “Romania should complement gradually its energy mix with biomass energy to
achieve its RES Targets, focusing on wastes from agriculture and industrial which are less costly and are easily accessible”
5.1.2 Nuclear Power in Bulgaria
Building new nuclear plants is expensive compared to the alternatives. In addition, Bulgaria had to shut down nuclear plants to enter the EU, so even though there have been discussions to open others, it is unlikely that it will happen. In recent decades, construction of new nuclear plants such as the UK's Hinkley Point C and Finland’s Olkiluoto, demonstrate that plants are increasingly running over budget and behind schedule. Broadly, the nuclear sector globally is in distress with several high-profile projects delayed, cancelled or in doubt of reaching financial closure. Indeed, installing a new nuclear plant demands great financial effort and technical knowledge regarding safety matters. This leads to problems such as residual management and safety concerns.
Nevertheless, nuclear power in its operation is carbon-free and for countries such as Bulgaria who have already installed nuclear power plants, this should be taken into account in the process of decarbonization. Still, the world is narrowing to a decentralized production of energy and an energy close to consumption, with benefits on the grid management level and to losses of energy, which all will lead to less space for nuclear. Therefore, existing nuclear generation fleet should be encouraged to stay online for as long as RES can become more dominant before nuclear retirements inevitably occur. Shutting down nuclear plants to replace their output with natural gas or coal is also undesirable given the carbon impact of these sources and emissions associated with natural gas extraction.
Based on the arguments above, we can conclude that Bulgaria, which has a significant nuclear power share, should remain as such because it can help renewable energy grow. Not only they are already installed, and its operations do not release harmful emissions in the process, but also because it helps attenuate renewable energy intermittency and respond to demand peaks. Thus, insight 2 is postulated as follows:
5.2 The Impediment of Energy Costs and Price
The imbalance between renewable implementation pace and technology development increases energy costs. Also, the necessary large investments with integrating renewables in the grid enhances this trend. While increasing flexibility in the grid to facilitate renewable integration may not be enough to keep costs low, reverse auctions have grown in popularity over the past decade due to their success in creating price transparency and driving innovation and competition. In result, it keeps prices for new-build RES low. They invert the role of buyer and seller as the buyer puts up a request for the service and sellers then place bids for the amount they are willing to accept. According to the interviewees, energy policymakers in Romania and Bulgaria should, therefore, study the reverse auction processes in locations such as India, Germany and the Australian Capital Territory (ACT) to see whether those examples could be learned upon and adapted for their own markets to drive RES. Reverse auctions can also be paired with local content requirements such as in the ACT and Victoria, where local content requirements have been successful in driving local employment, innovation and manufacturing. One interviewee, however, stated that since prices are fixed in Bulgaria, this not only demonstrates low competition but also an obstacle for inserting reverse auction and, therefore, RES implementation.
Based on the arguments above, we can conclude that the rise of energy prices can be a problem for RES implementation. However, policy makers in Romania and Bulgaria should study reverse auctions to try to attenuate the issue. Thus, insight 3 is postulated as follows:
Insight 3: “The rise of energy costs and its consequential damage to RES growth could be
attenuated with reverse auctions in the future”
5.3 Policy Designs and Their Success Rate Across Europe
From the interviews, it was clear that carbon pricing, despite having success rates higher than support-schemes, is a very challenging policy to adopt for various reasons. It was stated on the analyses that Finland uses carbon pricing and that the policy has been widely well received and has immensely fomented renewable energy. However, the prices of carbon can be very politically contentious, most predominantly in resource-rich countries with significant power and influence owing to its fossil fuel sector. Deciding between a positive incentive (green certificates) or negative incentive (carbon pricing) should be based on a country’s economic and social environments. This can be witnessed in France’s attempt to raise its fuel tax. Carbon pricing, even if taking a tax and dividend approach, has been successfully framed by
conservative opponents as being regressive and particularly financially stressful for the working and middle classes. Romania and Bulgaria, being emerging markets, are countries that have low purchasing power. Therefore, it would not be easy to implement carbon policy and it could have less favorable results. Finland, on the other hand, as a developed country has more access to other types of financing. Citizens of Romania and Bulgaria are not willing to pay more for green energy, and even less for energy production’s pollution. Policymakers that wish to pursue carbon pricing must take into account its political risks.
In addition, interviewees highlighted the role of private investment in order to decrease the dependency on public investment, which is riskier in emerging markets like Bulgaria and Romania. Renewable energy companies such as EDP Renewables, Iberdrola, Enel and RWE have been increasing their global footprint, and represent great opportunities for partnerships and M&A.
Based on the arguments above, we can conclude that the European countries, Romania and Bulgaria included, do have benefits on pursuing carbon policy. However due to its problematic and political implications, support-schemes are more attractive and carbon policy could come as complementary. Thus, insight 3 is postulated as follows:
Insight 4: “Support-schemes for RES are more feasible to implement than carbon pricing in
emerging markets”
5.4 Implementation of RES in Romania and Bulgaria vs. in Developed Markets
Firstly, interviewees stated that post-socialist countries like Bulgaria and Romania have inherited monopolistic market structures, in which few but large firms produce for the home market. This conditions strategy making for companies. Also, it was stated that the cost of capital can be higher in emerging markets due to higher financing costs, less experienced engineering, construction and deployment facilitators and other risks. These, however, can be overturned with favorable contracting policies such as priority grid access arrangements, government loans and long-term Power Purchase Agreements (PPAs) with government counterparts to increase investor confidence and drive cost parity with advanced economies. One interviewee, however, stated that the regulatory regime in Bulgaria is unpredictable and some American companies have witnessed difficulties in enforcing contracts, showcasing the political risk of emerging markets. This can lead to problems with regulation and corruption. Nevertheless, Romania and Bulgaria’s potential for renewable energy growth was reinforced,
demonstrating that investment in these countries can be very rewarding with due diligence and proper risk management. Allowing the state to own a specific share in renewable energy enterprises could increase the willingness to invest in it also.
Based on the arguments above, we can conclude that even though investing in European emerging markets can be more costly and riskier, it is however attractive due to its potential and available protective measures. Thus, insight 5 is postulated as follows:
Insight 5: “RES implementation in European emerging markets can be more costly and riskier
than in developed markets. However, such risks can become reduced with policies to increase investor confidence or having the state in the shareholder mix”
5.5 Implementation of RES in the EU: Future Prospects and Implications 5.5.1 The Influence of Energy Dependence
According to the energy specialists interviewed, diminishing energy dependence can be an even higher motivator for implementing RES than climate concerns. As it was shown in the analyses, even though these countries have been demonstrating lower energy dependency until 2014/15, and it has been increasing since. Interviewees, therefore, agree that these countries aim to be less vulnerable to disruptions from the supply side. In addition, the path dependence of Romania and Bulgaria with their political relationship with Russia has reinforced this. As it is unanimous that renewable energy has been a key factor in attenuating Romania and Bulgaria’s energy dependence, it is predicted that as there are more disruptions from supply, and a higher concern for avoiding them, RES will be incentivized as a way to defend that. Based on the arguments above, we can conclude that energy dependence is a key factor to increase RES due to its political implications and energy security level. Thus, insight 6 is postulated as follows:
Insight 6: “Diminishing energy dependence is one of the EU’s main focus, as is that of Bulgaria
and Romania. This will impact positively RES implementation”
5.5.2 The Role of Electrification in RES
Based on expert interviews, electrification of different sectors could bring upon tremendous opportunities for clean energy, if, of course, electricity is to be generated from renewables. This is, electrification of transport, for example, will have a positive impact in the development of
the electric transportation, however, it does not impact in the growth of RE generation. Also, by increasing the demand of electricity it can have the opposite effect. Therefore, this obligation would have to be political. Electrifying the transport sector has the potential to drive industry innovation in software and manufacturing, drive local employment and encourage implementation of more renewable energy. Companies and governments installing new charging infrastructure may sign Power Purchase Agreements (PPAs) with renewable energy contracts, thereby encouraging the construction and development of RES. Transport electrification has also added benefits by encouraging local jobs and opportunities in charging infrastructure, motor and electronics manufacturing, cleaner air and water and more livable cities. Additionally, families who purchase electric vehicles are more likely to be interested in installing rooftop solar and other energy technologies. Thus, EVs have the potential to drive further deployment of RES.
Based on the arguments above, we can conclude that the path of electrification growth that countries have been experiencing can have benefits on RES implementation, with proper political measures. Thus, insight 7 is postulated as follows:
Insight 7: “Rising electrification can encourage RES implementation, if there is a policy
specifying that it is exclusively sourced from renewables”
5.6 Can Bulgaria and Romania achieve the 2030 RE Targets?
From interviews, it is clear that Romania and Bulgaria have a lot of renewable energy drivers, despite the limitations that were stated previously. Encouraging RES increases energy security and reduces reliance on foreign countries for energy from imported Liquified Natural Gas (LNG) and other carbon-intensive sources. Renewable energy technologies have been following an exponential curve with downward costs occurring every year. This trajectory implies that renewable energy adoption will increase faster than expected in all countries. Nevertheless, these are intrinsically related with favorable government policies. Whether those policies take the form of feed-in tariffs, certificate scheme or government reverse auctions, the outcome will be the same, in some countries slower than others.
The most relevant obstacles for Romania and Bulgaria are the political and administrative uncertainties that these countries possess. Nonetheless, the fact that both countries achieved their 2020 targets beforehand demonstrates an advantage to other countries. They can leverage past strategies to understand how to reach 2030 targets, deriving on results they have achieved
and supporting themselves on the knowledge curve that these countries have acquired over the years.
Based on the arguments above, we can conclude that Romania and Bulgaria will most likely achieve its 2030 RES targets on time. Thus, insight 8 is postulated as follows:
Insight 8: “Given Romania and Bulgaria support-schemes and current positions in share of