Driver’s Fatigue State Monitoring using
Physiological Signals
Cláudia Sofia Alferes Ribeiro da Silva Silveira
M
ASTER’
ST
HESISIntegrated Master in Bioengineering
Internal Supervisor: Jaime dos Santos Cardoso, PhD External Supervisor: André Ribeiro Lourenço, PhD
c
Signals
Cláudia Sofia Alferes Ribeiro da Silva Silveira
Integrated Master in Bioengineering
I would like to express my sincere gratitude to my academic supervisor Jaime Cardoso for all the support and guidance. I really appreciate his wide knowledge, his patience and his ability to motivate me to work harder and be better. Best supervisor ever!
A special thanks goes out to all the members of CardioID Technologies, especially to my ex-ternal supervisor André Lourenço, for accepting me and letting me be a small part of the company during my journey. CardioID group provided me the funding for my work, technical support and material. This research would not have been possible without them.
I am also grateful to Christer Ahlström from the Swedish National Road and Transport Re-search Institute for providing valuable and reliable data to CardioID. This data was the base for almost all the work presented in this thesis.
Last but certainly not least, a very special thanks goes out to my family and friends: they are all it takes to make my life worth living. I especially want to thank my best friend (and my mom!) for tolerating my crazy mood swings and negativity (so not me!), but also for helping me to find happiness in being the person that I really am today.
Steve Jobs
Todos os anos, aproximadamente, 1.25 milhões de pessoas morrem, na estrada, em todo o mundo. Nos Estados Unidos da América, 3% dos acidentes fatais, em cada ano, são causados por uma condução sonolenta. Apesar de existirem medidas de prevenção, o número de mortes relativas a este tipo de condução tem vindo a ser consistente. Assim, os sistemas inteligentes de apoio à condução e à detecção de sonolência e fadiga têm vindo a ser estudados e introduzidos no mercado, uma vez que são uma maneira de conferir segurança aos condutores e de prevenir acidentes.
Estes sistemas inteligentes são, maioritariamente, baseados em características medidas a partir do veículo, e, como estas estão dependentes de condições externas, não podem ser consideradas fidedignas. Em contrapartida, os sinais fisiológicos são as medidas mais exatas, uma vez que monitorizam directamente o condutor, medindo o batimento cardíaco, o movimento dos olhos e a actividade cerebral. No entanto, a aquisição não intrusiva deste sinais continua a ser um desafio, uma vez que, devido ao mau contacto dos eléctrodos, são introduzidos erros e ruído de movimentos nos sinais. Para além disso, aquisições de dados em ambientes simulados podem levar a enganos na avaliação da sonolência e, portanto, estudos em ambientes reais poderão ser necessários.
Posto isto, esta dissertação de mestrado tem como objectivo a monitorização do estado de fadiga/sonolência de um condutor com base em sinais fisiológicos, medidos em condições reais, através do electrocardiograma (ECG) e do electrooculograma (EOG), e em dois ambientes opos-tos: ambientes “limpos”, relacionados com aquisições não intrusivas e de boa qualidade, e ambi-entes “ruidosos”, relacionados com aquisições intrusivas e de má qualidade.
A aquisição intrusiva de sinais EOG e ECG foi resultado de um estudo de naturalistic driv-ing (projecto ADAS&ME). Após pré-processamento, 16 características extraídas são baseadas no coração, mais propriamente na variabilidade do batimento cardíaco, e as restantes 25 car-acterísticas são baseadas no movimento dos olhos, essencialmente no pestanejar. De seguida, implementam-se algumas técnicas de machine learning para estudar a influência de diferentes classificadores, da redução da dimensão das características e de dependências em relação ao con-dutor, na classificação da sonolência. Ainda, métodos para modelar dados ordinais, sequenciais e não uniformes são avaliados.
Os melhores valores de exatidão, que foram obtidos combinando as características extraídas do ECG com as do EOG (no total, 41 características), são de 88%, usando o classificador gradient boosting tree, e 77%, usando o classificador support vector machine, para problemas com duas (acordado vs. sonolento) e três classes (acordado vs. médio vs. sonolento), respectivamente. A redução do número de características usando o método sequential floating forward selection revelou que 15 características eram suficientes para manter a mesma performance de classificação. No entanto, apesar dos resultados obtidos, o estado de sonolência, ou o “grau de sonolência”, continua a ser difícil de caracterizar.
Em relação aos sinais não intrusivos, electrocardiogramas foram adquiridos pelas mãos dos condutores, através de elétrodos devidamente colocados no volante, usando o sistema CardioWheel.
vi
Um pré-processamento baseado em filtragem e critérios de avaliação de qualidade dos sinais é pro-posto, com o objectivo de distinguir regiões degradadas de regiões que apresentem boa qualidade. Um trabalho exploratório é ainda apresentado, com vista a investigar como é que modelos desen-volvidos em cenários intrusivos podem ser adaptados a cenários não intrusivos e mais ruídosos, usando técnicas de transfer learning.
Com a tecnologia actual, é possível a implementação de sistemas não intrusivos nos carros, sem influenciar o normal comportamento do condutor. No entanto, uma vez que as aquisições não intrusivas dão origem a sinais fortemente contaminados com ruído, o processamento de sinal relevou ser uma ferramenta fundamental para ultrapassar essa limitação neste cenário.
Every year, approximately 1.25 million people die on road worldwide. In United States of Amer-ica, drowsy driving has been reported consistently as the cause of approximately 3% of total fatal crashes annually. Despite of the existing countermeasures, the number of fatalities regarding to drowsy driving has been consistent. In order to minimize injuries and prevent accidents, intelligent drowsiness monitoring systems have been introduced as a way of providing safety to drivers and some systems are already available in the market.
These driver’s state monitoring systems are mostly based on vehicle measures and, because these measures are dependent on several external conditions, they are not considered reliable mea-sures. On the other hand, physiological measures are the most accurate and reliable, by measuring physiological signals such as heart rate, eye movement and brain activity directly from the driver. However, the acquisition of physiological signals in a non-intrusive way still remains a challenge, since improper electrode contact produces movement artifacts and errors on the signals. Addition-ally, acquisitions in simulated environments may be misleading for drowsiness assessment and performing studies on road may be required.
Therefore, this thesis is aimed at monitoring the driver’s drowsiness/fatigue state based on physiological signals, measured on road by electrocardiogram (ECG) and electrooculogram (EOG), in two different scenarios: clean environments, related to good quality intrusive acquisitions, and noisy environments, related to bad quality non-intrusive acquisitions.
Based on intrusive ECG and EOG signals, resulting from a naturalistic driving study per-formed in the ADAS&ME project, a preprocessing step, that includes filtering, is perper-formed and 16 heart and 25 eye-based features are extracted, mostly related to heart rate variability and blink events, respectively. Then, supervised machine learning methods are implemented in order to study the influence of different classifiers, feature dimension reduction and subject dependency in drowsiness classification. Also, methods for modeling ordinal, sequential and imbalanced data are assessed.
The best accuracy values that were achieved combining ECG and EOG features (41 features) were 88%, using gradient boosting tree, and 77%, using support vector machine, for two class (awake vs. drowsy) and three class (awake vs. medium vs. drowsy) problems, respectively. Feature dimension reduction was performed using sequential floating forward selection (SFFS) method, and the use of 15 features revealed to be sufficient for maintaining the same performance in the classification. Regardless of the obtained results, drowsiness state, or “degree of drowsiness” is still difficult to evaluate and characterize.
Non-intrusive ECG signals were acquired by sensors properly placed on the steering wheel, using the CardioWheel system, allowing the acquisition through the driver’s hands. A prepro-cessing based on filtering and quality assessment criteria was proposed to distinguish between degraded regions and good quality regions. An exploratory work related to transfer learning is also performed in order to investigate how models build in intrusive scenarios can be adapted to non-intrusive scenarios.
viii
With current technology, it is possible to implement a non-intrusive system in the car, without influencing the normal driver behavior. However, because non-intrusiveness in the acquisitions results in signals strongly contaminated with noise, signal processing revealed to be a crucial tool for overcoming this limitation in this scenario.
1 Introduction 1
1.1 Context . . . 1
1.2 Motivation and challenges . . . 1
1.3 Research goals . . . 2
1.4 Contributions . . . 3
1.5 Thesis outline . . . 3
2 Literature review 5 2.1 Background . . . 5
2.2 Driver’s fatigue detection methods . . . 9
2.2.1 Subjective measures . . . 9 2.2.2 Objective measures . . . 10 2.2.2.1 Vehicle-based measures . . . 10 2.2.2.2 Behavioral measures . . . 11 2.2.2.3 Physiological measures . . . 12 2.2.3 Performance metrics . . . 21
2.2.4 Discussion of advantages, limitations and challenges . . . 23
2.2.5 Monitoring physiological signals using non-intrusive sensors . . . 24
2.2.6 Driver’s drowsiness detection and alert systems . . . 28
3 Simulated environments versus real world acquisitions 33 3.1 Differences, limitations and challenges . . . 33
3.2 Simulated environments: methodologies and existing databases . . . 34
3.3 Real world acquisitions: methodologies and existing databases . . . 36
4 Preprocessing and feature extraction 41 4.1 In-vehicle usage of electrocardiogram: preprocessing and extraction of heart rate signal features . . . 41
4.2 In-vehicle usage of electrooculography: preprocessing and extraction of eye move-ment features . . . 47
5 Driver’s state monitoring by machine learning methods 55 5.1 Introduction to machine learning . . . 55
5.2 Sources of information and feature reduction . . . 56
5.2.1 Feature selection . . . 56
5.2.2 Feature transformation . . . 57
5.3 Supervised classification: KSS values as classes . . . 57
5.4 Subject-dependent vs subject-independent classification . . . 58
x CONTENTS
5.5 Imbalanced class distributions . . . 59
5.6 Sequential data . . . 60
5.7 Ordinal data . . . 60
5.8 Classifiers and metrics for evaluating their performance . . . 61
5.8.1 Support Vector Machine . . . 61
5.8.2 Artificial Neural Network . . . 62
5.8.3 Random Forest . . . 62
5.8.4 Gradient Boosting Tree . . . 63
5.9 Results and discussion . . . 64
5.9.1 Different classifiers, sources of information and feature transformation . . 64
5.9.2 Feature selection . . . 69
5.9.3 Subject-dependent vs subject-independent classification . . . 75
5.9.4 Imbalanced class distributions . . . 78
5.9.5 Sequential data . . . 80
5.9.6 Ordinal data . . . 81
6 Towards driver’s state monitoring in noisy environments by transfer learning meth-ods 83 6.1 Preprocessing of noisy electrocardiogram signals and extraction of heart rate sig-nal features . . . 83
6.2 Introduction to transfer learning . . . 88
6.3 Discussion of limitations and challenges . . . 89
7 Conclusion and future work 91 7.1 Conclusion . . . 91
7.2 Perspective of future work . . . 92
2.1 Typical EEG waveforms according to person’s state . . . 6
2.2 Typical ECG waveform: P and T waves, QRS complex and RR interval . . . 7
2.3 Different categories of eye movements based on their velocity . . . 8
2.4 Typical EOG waveform: blinks and other eye movements . . . 8
2.5 Eyelid closure: PERCLOS . . . 11
2.6 ECG sensor with electrically conductive fabric electrodes in the steering wheel . 25 2.7 Signal block for ECG preprocessing . . . 25
2.8 ECG sensor with electrically conductive fabric electrodes in the driver’s seatback 26 2.9 Signal block for ECG preprocessing . . . 26
2.10 ECG monitoring system . . . 27
2.11 Prototype of the HARKEN project . . . 27
2.12 Prototype of CardioID Technologies . . . 28
2.13 Attention Assist: detection system . . . 29
2.14 Attention Assist: alert message . . . 29
2.15 StopSleep R . . . . 30
2.16 Specific warning with EB Assist Drowsiness Detection technology . . . 30
3.1 Driving simulator with vehicle and driving software . . . 35
3.2 Driving simulator with vehicle, driving software and a video camera . . . 35
3.3 Driving software: nighttime graphics and daytime graphics . . . 36
3.4 Equipment used in experiments on road . . . 37
3.5 Data from Stress Recognition in Automobile Drivers database . . . 37
3.6 KSS scores obtained from “driver03” . . . 38
4.1 Raw ECG signal acquired by “driver01” . . . 42
4.2 Filtered ECG signal acquired by “driver01” . . . 42
4.3 R peak detection with best threshold selected . . . 43
4.4 Templates extracted after R peak detection . . . 43
4.5 Selection of normal intervals . . . 44
4.6 Power spectrum density of heart rate variability signal . . . 45
4.7 Raw EOGv signal acquired by “driver01” . . . 47
4.8 Filtered EOGvsignal acquired by “driver01” . . . 47
4.9 Eye potential blink phases detection: actual blinks . . . 48
4.10 Eye potential blink phases detection: saccadic blinks . . . 48
4.11 Representation of an eye blink with corresponding features . . . 50
4.12 Eye saccade phases detection . . . 52
5.1 Distribution of classes for 2-class and 3-class problems . . . 60
5.2 (a) Multiple decision surfaces; (b) Optimal decision surface . . . 61
xii LIST OF FIGURES
5.3 Architecture of an ANN with 7 inputs, 10 neurons in each hidden layers S1 and
S2 and 3 outputs . . . 62
5.4 Architecture of a random forest classifier . . . 63
5.5 Gradient boosting based on the sum of predictions of individual trees . . . 63
5.6 Accuracy values of the best selected features from 1 to 16 ECG features, using SVM classifier, for 2-class and 3-class problems . . . 70
5.7 Accuracy values of the best selected features from 1 to 16 ECG features, using GBT classifier, for 2-class and 3-class problems . . . 70
5.8 Accuracy values of the best selected features from 1 to 41 ECG + EOG features, using SVM classifier, for 2-class and 3-class problems . . . 73
5.9 Accuracy values of the best selected features from 1 to 41 ECG + EOG features, using GBT classifier, for 2-class and 3-class problems . . . 73
5.10 Comparing DR values for subject-dependent and subject-independent classifica-tions using GBT classifier for all classes . . . 78
5.11 KSS values over time given by different drivers . . . 82
6.1 Raw ECG signal acquired by bus driver “A”: reasonable quality . . . 84
6.2 Raw ECG signal acquired by bus driver “A”: completely degraded region . . . 84
6.3 Filtered ECG signal using Savistsky-Golay filter . . . 85
6.4 Filtered ECG signal using Hamming window . . . 85
6.5 Filtered ECG signal using Butterworth filter . . . 86
6.6 Raw ECG signal acquired by bus driver “A”: saturation and normal beats . . . 86
6.7 Good R peaks detection: degraded region . . . 87
6.8 Good R peaks detection: good and degraded regions . . . 88
2.1 Karolinska Sleepiness Scale. . . 10
2.2 Time-domain features of heart rate variability. . . 13
2.3 Eye movement features extracted from EOG signals. . . 14
2.4 Previous studies on driver drowsiness detection using physiological signals. . . . 16
2.5 Confusion matrix of a binary classifier. . . 21
2.6 Performance measures for binary classification. . . 22
2.7 Advantages and limitations of subjective and objective measures. . . 24
4.1 Performance metrics for the R peak detection using clean signals. . . 44
4.2 Extracted ECG features. . . 46
4.3 Performance metrics for blink detection. . . 49
4.4 Extracted EOGv features. . . 51
4.5 Performance metrics for saccade detection. . . 52
4.6 Extracted EOGhfeatures. . . 53
5.1 KSS rating and their corresponding states for 2-class and 3-class problems. . . . 58
5.2 Training (using 10-fold cross validation) and test results (accuracy ± standard deviation) for all classifiers. . . 65
5.3 Confusion matrices using SVM classifier and ECG features. . . 65
5.4 Confusion matrices using SVM classifier and EOG features. . . 66
5.5 Confusion matrices using SVM classifier and ECG + EOG features. . . 66
5.6 Confusion matrices using ANN classifier and ECG features. . . 66
5.7 Confusion matrices using ANN classifier and EOG features. . . 67
5.8 Confusion matrices using ANN classifier and ECG + EOG features. . . 67
5.9 Confusion matrices using RF classifier and ECG features. . . 67
5.10 Confusion matrices using RF classifier and EOG features. . . 68
5.11 Confusion matrices using RF classifier and ECG + EOG features. . . 68
5.12 Confusion matrices using GBT classifier and ECG features. . . 68
5.13 Confusion matrices using GBT classifier and EOG features. . . 69
5.14 Confusion matrices using GBT classifier and ECG + EOG features. . . 69
5.15 Nine best feature combination selected by SFFS and SVM for ECG database. . . 71
5.16 Five and nine best feature combination selected by SFFS and GBT for ECG database. 71 5.17 Confusion matrices for 2-class problem using GBT classifier and ECG features. Left: classification with 16 features, right: classification with best five features. . 72
5.18 Confusion matrices for 3-class problem using GBT classifier and ECG features. Left: classification with 16 features, right: classification with best nine features. . 72
5.19 Fifteen best feature combination selected by SFFS and SVM for ECG + EOG database. . . 74
xiv LIST OF TABLES
5.20 Fifteen best feature combination selected by SFFS and GBT for ECG + EOG database. . . 74 5.21 Confusion matrices for 2-class problem using GBT classifier and ECG + EOG
features. Left: classification with 41 features, right: classification with best 15 features. . . 75 5.22 Confusion matrices for 3-class problem using GBT classifier and ECG + EOG
features. Left: classification with 41 features, right: classification with best 15 features. . . 75 5.23 Confusion matrices for 2-class problem using SVM classifier and ECG + EOG
features. Left: subject-dependent classification, right: subject-independent classi-fication. . . 76 5.24 Confusion matrices for 3-class problem using SVM classifier and ECG + EOG
features. Left: subject-dependent classification, right: subject-independent classi-fication. . . 76 5.25 Confusion matrices for 2-class problem using GBT classifier and ECG + EOG
features. Left: subject-dependent classification, right: subject-independent classi-fication. . . 77 5.26 Confusion matrices for 3-class problem using GBT classifier and ECG + EOG
features. Left: subject-dependent classification, right: subject-independent classi-fication. . . 77 5.27 Confusion matrices for 2-class problem using SVM classifier and ECG + EOG
features. Left: imbalanced classes, right: balanced classes. . . 79 5.28 Confusion matrices for 3-class problem using SVM classifier and ECG + EOG
features. Left: imbalanced classes, right: balanced classes. . . 79 5.29 Precision, recall and F1-score metrics for 2-class problem using SVM classifier
and ECG + EOG features. Left: imbalanced classes, right: balanced classes. . . . 79 5.30 Precision, recall and F1-score metrics for 3-class problem using SVM classifier
and ECG + EOG features. Left: imbalanced classes, right: balanced classes. . . . 80 5.31 Confusion matrices for 2-class problem using GBT classifier and ECG + EOG
features. Left: 41 features, right: 82 features, considering sequential data. . . 80 5.32 Confusion matrices for 3-class problem using GBT classifier and ECG + EOG
features. Left: 41 features, right: 82 features, considering sequential data. . . 80 5.33 Confusion matrices for 3-class problem using GBT classifier and ECG features.
Left: without considering order, right: considering order. . . 81 5.34 Confusion matrices for 3-class problem using GBT classifier and ECG + EOG
features. Left: without considering order, right: considering order. . . 81 6.1 Performance metrics for the R peak detection using noisy signals. . . 88
ANS Autonomic Nervous System DAUC Difference in the area under curve DWT Discrete Wavelet Transform ECG Electrocardiogram
EEG Electroencephalogram EMG Electromyogram EOG Electrooculogram FBN Fuzzy Bayesian network FFT Fast Fourier Transform
FMIWPT Fuzzy mutual-information-based wavelet packet transform FN False Negative
FP False Positive
GBT Gradient Boosting Tree HF High-frequency
HRV Heart Rate Variability
ICA Independent component analysis kNN k-Nearest Neighbors
KSS Karolinska Sleepiness Scale LDA Linear Discriminant Analysis LF Low-frequency
PCA Principal Component Analysis PSD Power Spectrum Density RDB Real Driving Database RF Random Forest
ROC Receiver Operating Characteristic SBS Sequential Backward Selection SDB Simulated Driving Database
SDLP Standard Deviation of Lane Position SFFS Sequential Floating Forward Selection SFS Sequential Forward Selection
SONFIN Self-organizing Neural Fuzzy Inference Network SPWVD Smoothed Pseudo Wigner-Ville Distribution SSS Stanford Sleepiness Scale
SVM Support Vector Machine SWV Steering Wheel Movement
xvi ABBREVIATIONS
TN True Negative TP True Positive
TVIPFM Integral Pulse Frequency Model with Time-varying Threshold VAS Visual Analog Scale
VLD Variation of Lane Deviation VLF Very low-frequency
Introduction
1.1
Context
According to available statistical data, road accidents are the main cause of death among people aged between 15 and 29 years old [1]. Every year, approximately 1.25 million people die on road worldwide [1]. Based on police reports, the U.S. National Highway Traffic Safety Administration reported that drowsy driving was the cause of 2.2 to 2.6 percent of total fatal crashes annually during 2005 through 2009 nationwide [2]. Drowsiness can happen after a long journey of travel, during night, after sleep deprivation and can also happen to drivers that are under influence of some medication [3].
Unfortunately, although the number of fatalities has been decreasing gradually, the percentage regarding to drowsy driving has been consistent [2]. Regarding all driving accidents, it was esti-mated that drowsy/fatigue driving is the cause of more than 100.000 crashes each year (up to 20% of all accidents), including 76.000 injuries, 1500 deaths and 12.5 billion dollars loss [4, 5].
In order to minimize injuries and prevent accidents, drowsiness detection systems have been introduced as a way of providing safety to drivers and are already available in several brands, such as Nissan [6]. These systems consist on monitoring several measures in order to evaluate the state of the driver and can also include an automatic alert if any drowsiness state is detected. Using warning systems with 0.5 seconds warning time, it is possible to avoid 60% of the overrun accidents and an extra second can prevent about 90% of collisions [7, 8].
1.2
Motivation and challenges
Finding an effective way of constantly evaluating the state of a driver has been a big challenge since each driver has different behavioral and physiological manifestations. Monitoring systems for driver’s drowsiness and fatigue detection can rely on subjective or objective measures that include vehicle-based, behavioral and physiological measures.
2 Introduction
Subjective measures are based on questionnaires answered by the drivers before, after or dur-ing drivdur-ing [9, 10]. Therefore, the impossibility of incorporatdur-ing these measures in an automatic and real time monitoring system is a serious limitation, contrary to objective measures.
Vehicle-based and behavioral measures are objective and can be acquired in an non-intrusive way. However, parameters based on vehicle measures are much more dependent on external fac-tors such as vehicle type and geometric characteristics of the road, becoming a non-reliable and limited measure [10, 11]. Also, since behavioral measures rely on cameras, their limitation is ob-viously related to lightning conditions. These measures can be widely used for detecting driver’s abnormal behaviors, but only as a complementary measure. Driver state cannot be correlated to driving performance based on behavioral measures alone [12].
Physiological measures are based on biological signals such as electrocardiogram (ECG), elec-tromyogram (EMG), electrooculogram (EOG) and electroencephalogram (EEG). Acquiring phys-iological signals in an non-intrusive way remains a challenge since improper electrode contact produces movement artifacts and errors on the signals [9]. Several approaches have been studied for this purpose, including the incorporation of ECG sensors on steering wheels and on driver’s seats [13]. However, non-intrusiveness in the acquisition results in signals strongly contaminated with noise.
In order to carry out experiments, researchers have to use simulated environments for drowsi-ness manipulation due to the fact that is not safe to perform tests on road. However, driver’s behavior is different on simulations since they do not perceive any risk. Overcoming this limita-tion can be a challenge, but some researches have been validated on simulated environments that are relatively similar to road experiments [14, 15], specially if related to physiological data [16].
1.3
Research goals
The first main goal of this dissertation is, therefore, to develop algorithms that detect drowsiness and fatigue, allowing driver’s state monitoring in real time. For that purpose, the electrocardiogram and electrooculogram signals acquired in an intrusive way are used, since physiological measures are the most reliable and accurate, comparing to subjective measures and other objective ones.
The development of such algorithms comprises several key steps, such as understanding which parameters are the most important for the analysis of ECG and EOG-based features and investi-gating methods for event detection, extraction and selection of drowsiness related features, as well as driver’s state classification.
As a second main goal, and since physiological signals acquisition in a non-intrusive way still remains a challenge, the purpose is to investigate new algorithmic solutions to work under this challenging scenario. Thus, sensors properly placed on the steering wheel are used, allowing the ECG acquisition through the driver’s hands in a comfortable way and without influencing normal driver behavior. Here, understanding how signals have to be preprocessed is crucial in order to obtain signals capable of providing useful information for drowsiness classification.
1.4
Contributions
In the following, the main contributions of this thesis for driver’s drowsiness detection are sum-marized.
• Based on a thorough literature review, a critical point of view related to drowsiness quantifi-cation based on subject and objective measures is presented, as well as a discussion about differences between simulation environments and real world.
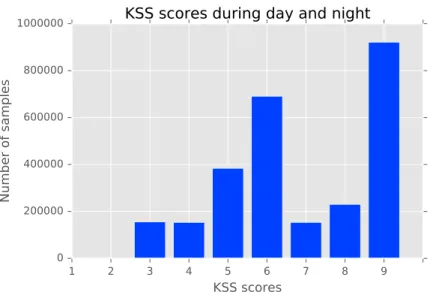
• Most of the previous studies collected data in simulator environments. However, in this work, drowsiness classification is assessed using data acquired in real world scenarios, with measurements performed during day and night.
• In contrast to other studies, this work investigates two different data division methods. The common one is the binary classification (awake vs. drowsy) and the second one is the multi-class approach with three multi-classes (awake vs. medium vs. drowsy). The “medium” multi-class represents the transition between the awake and drowsy states and, therefore, its detection makes all the difference when applied to drowsiness warning systems in order to prevent more accidents.
• This thesis also provides new insights into subject dependency and ordinal, sequential and imbalanced data, applied to data for drowsiness classification.
• In this work, an exploratory study of noisy environments, caused by non-intrusive ECG acquisitions in real world situations, are presented. Preprocessing and quality assessment methods are proposed for dealing with these noisy signals.
Part of the results of this thesis were included in an accepted abstract for the 6thNaturalistic
Driving Research Symposium.
1.5
Thesis outline
The remainder of this thesis is organized as follows.
Chapter 2 covers the background information about fatigue and drowsiness and also prior art in the area of fatigue detection, using both subjective and objective measures. It is specially focused on physiological signals and their relation to drowsiness and fatigue, as well as the description of different studies using these signals, including signal processing, features extracted, classification methodology and performance. Regarding electrocardiogram and electrooculogram, an overview of the most important features are presented.
Chapter 3 covers information about existing databases used in validation, different simulation methodologies to simulate real environments and real world acquisitions, with a special focus on the comparison between simulated and real data.
4 Introduction
Chapter 4 deals with the preprocessing of ECG and EOG signals and the detection of eye and heart movements. Afterwards, extracted features are introduced, mostly related to features extracted from blinks and from HRV signals.
Chapter 5 presents the results of drowsiness classification based on extracted features, men-tioned in the previous chapter, using machine learning methods. Several approaches are investi-gated: different combination of features and classifiers, different classes, subject dependencies and structure/organization of data. The results are presented along with a discussion and are always compared with each other.
Chapter 6 deals with noisy environments due to non-invasive ECG acquisitions. A preprocess-ing of these noisy signals is described and an exploratory study of transfer learnpreprocess-ing is presented.
Finally, Chapter 7 summarizes the results of this work, draws some conclusions and some considerations are also made in other to open rooms for future work.
Literature review
Driver’s fatigue monitoring has received great attention in terms of new technology and algorith-mic solutions. In this chapter, we start by covering the background information about fatigue, drowsiness and their relation and physiological and physical behaviors caused by drowsiness. Then, we describe subjective and objective measures used in this application, along with previous works, with especially attention on physiological measures. We end by emphasizing the need of further research in non-intrusiveness approaches, presenting the main improvements in this topic and the drowsiness alert systems already available in the market.
2.1
Background
Technically, drowsiness and fatigue are slightly different concepts but in practice are closely re-lated [17] due to the fact that the results are the same: a person who suffers from drowsiness or fatigue becomes less alert and with less concentration ability, leading in extreme cases to fall asleep [3]. Both drowsiness and fatigue can compromise the ability to drive safely since reac-tion time is slower, vigilance is reduced and processing and integrareac-tion of informareac-tion becomes deficient [18].
Strictly speaking, fatigue, also known as tiredness, is defined as a disinclination to perform a specific task and a lack of energy caused by monotonous activities [19] and is seen by some researchers as the transitory period between awake and sleep [20]. On the other hand, drowsiness, also known as sleepiness, is the biological need to fall asleep [17]. In this thesis, the two terms are used interchangeably.
Drowsiness is directly related to the sleep-wake cycle that follows a certain daily or circadian pattern (internal body clock) [17]. It is well known that physical and mental performances are quickly decreased if a person tries to stay awake against circadian clock schedule [21]. There are two types of sleep: rapid eye movement (REM) sleep and non-REM (NREM) sleep. Contrary to stage REM sleep, which is characterized by an intense brain activity, NREM sleep is characterized by a reduction in physiological activity [21] and can be subdivided into four stages:
• Stage I: time of drowsiness describing transition from awake to sleep.
6 Literature review
• Stage II: light sleep.
• Stages III and IV: deep sleep.
As sleep gets deeper, changes in brain activity are measured by electroencephalogram (EEG), usually recorded from multiple electrodes placed on the scalp (Figure 2.1).
Figure 2.1: Typical EEG waveforms according to person’s state (from [22])
The electrical activity of the brain is classified according to rhythms characterized by different band frequencies [23]:
• Slow delta waves (0.5 to 4 Hz) are present during transition period between drowsiness and sleep.
• Theta waves (4 to 7 Hz) that are associated with low levels of both alertness and information processing during drowsiness and sleep.
• Alpha waves (8 to 10 Hz) are related to an increase of eye closure. Alpha waves are usually associated with more relaxation states, also called as “relaxed wakefulness”.
• Fast beta waves (13 to 30 Hz) are associated with moments of higher alertness and excite-ment.
Hereupon, driver’s drowsiness and fatigue can be evaluated, analyzing only stage I of NREM sleep. With the increasing of sleepiness, brain waves get slower and have greater amplitude [21].
Additionally, as sleepiness increases, heart rate becomes lower but also irregular and blood pressure drops [21]. Autonomic Nervous System (ANS) controls the heart, and since system ac-tivity changes with extreme fatigue and drowsiness, so does the heart [24]. ANS has two branches
that in most of situations have opposite actions: sympathetic nervous system (“fight or flight” system) and the parasympathetic nervous system (“feed and breed” system) [25]. Wakefulness states are characterized by an increase in sympathetic and/or a decrease of parasympathetic activ-ities, while relaxation states are characterized by an increase in parasympathetic and/or a decrease in sympathetic activities [24, 26, 27]. These activities can be measured by means of the heart rate variability (HRV) signal obtained from surface electrocardiogram (ECG) or from a photo-plethysmogram (PPG) [28]. Regarding ECG (Figure 2.2), HRV signal describes variations of both instantaneous heart rate and intervals between two consecutive R peaks of the ECG [29], called RR intervals, and therefore, as the focus on the driving task decreases and heart rate becomes more irregular, HRV increases [30].
Figure 2.2: Typical ECG waveform: P and T waves, QRS complex and RR interval (adapted from [31])
Other physiological changes caused by drowsiness and fatigue are related to eye movement and muscle activity. Several eye movements (Figure 2.3) can be assessed by electrooculogram (EOG with vertical and/or horizontal channels), since it measures the electrical field generated between the cornea and the retina that reflects the orientation of the eyes (Figure 2.4). Muscle activity can be assessed by electromyogram (EMG). In fatigue situations, eye movements become slower and eye blinking becomes smaller but also faster, since drivers want to obviously fight against involuntary eye closure by opening their eyes [32]. Also, during sleep, muscle activity decreases [33].
8 Literature review
Figure 2.3: Different categories of eye movements based on their velocity (from [34])
Figure 2.4: Typical EOG waveform: blinks and other eye movements (from [35])
Several factors can increase drowsiness on drivers [3, 17]:
• Time of day influences circadian rhythm. Circadian low points occur between 03:00 AM and 06:00 AM [36], being the most critical hours to drive since there are a certain propensity to sleep.
• Medications, drugs or alcohol can have sedating effects and other damages that cause a decrease on driver’s performance.
• Poor quality of sleep has a direct effect on the level of alertness. It can be related to sleep deprivation, sleep disorders or even night or rotating shifts.
• Longer and monotonous trips driving at constant speed (such as on highways) can cause sleepiness.
Summing up, and according to National Sleep Foundation, the most frequently reported symp-toms of sleepiness are eye tiredness, yawning and difficulties concentrating on road [36]. As al-ready said, there are also physical signs such as frequent blinking and head nodding, increase of EEG amplitude waves and changes in heart rate (ECG) [37]. Cognitive signs are related to dif-ficulty of concentration, daydreaming, lack of memory (last few miles are not well remembered) and misjudging traffic situations. According to different symptoms and signs, several driver’s fatigue detection methods have been developed and are reported in the next section.
2.2
Driver’s fatigue detection methods
2.2.1 Subjective measures
Subjective measures rely on drowsiness rating estimation after or during driving, by the drivers before or by an external observer and they are used to validate and label data acquired in an experiment [38]. The most common scales are Visual Analogue Scales (VAS) or Likert Scales, such as Stanford Sleepiness Scale (SSS) and Karolinska Sleepiness Scale (KSS).
Visual Analogue Scales applied to this field are based on 10 centimeter lines labeled with a “Not sleepy/drowsy” in the left and a “Very sleepy/drowsy” in the right-end. It is a continuous scale without numeric numbers to evaluate the state of the driver putting a mark on the line in-dicating their feeling at the moment. Since it is used for detecting changes within an individual, this method removes any impulse for the driver to remember what was the answer given on the previous evaluation [39].
Stanford Sleepiness Scale is a 7-graded self-rating scale to measure sleepiness in a progressive way and the stages are numbered from one to seven (1: Feeling active and vital; alert; wide awake; 7: Almost in reverie; sleep onset soon; lost struggle to remain awake) [40]. SSS revealed high correlation with performance on monotonous tasks, being sensitive to sleep loss and partial recovery effects [41].
Karolinska Sleepiness Scale has been widely used for several studies of shift work, jet lag, driving abilities, attention and performance and clinical settings [42]. It has nine points verbally anchored as shown in Table 2.1 [9].
This scale is used in several studies to confirm drowsiness state, along with other subjective and objective measures [43, 44]. Some researches used KSS for self-reporting every two minutes and disagreements were found between KSS labels and the objective measure variation of lane deviation (VLD) [44]. Although objective measures are much more reliable, there are also studies proving that sleep deprivation has effects in KSS scores (recorded every minute), specially for drivers with four hour sleep deprivation [45]. Also, other researches showed that there is a relation between KSS (collected every 5 minutes) and objective indicators: with higher scores in KSS, the standard deviation of the lateral position increases and eye blinking becomes longer [10].
10 Literature review
Table 2.1: Karolinska Sleepiness Scale.
Rating Verbal Description
1 Extremely alert
2 Very alert
3 Alert
4 Fairly alert
5 Neither alert nor sleepy 6 Some signs of sleepiness 7 Sleepy, but no effort to keep alert 8 Sleepy, some effort to keep alert
9 Very sleepy, great effort to keep alert, fighting sleep
This scale was also validated against physiological measures with EEG variables (alpha and theta power density and alpha attenuation coefficients) and behavioral indicators of sleepiness (median reaction time) [42]. It was shown that with higher KSS scores, these indicators increase [42].
On the other hand, since subjective rating is not continuously measured, sudden variations are not detected using subjective measures [9]. Additionally, physiological and behavioral changes were not reported until subjective sleepiness was considerable (> 7) [46].
Being a subjective classification, large individual differences can be observed [42] and drivers become more alert if they are evaluating themselves, reducing their drowsiness level [9]. The dif-ficulty of obtaining drowsiness feedback from a driver in a real driving situation is also a serious limitation. Therefore, these measures are much more useful in simulated environments and objec-tive measures may be better suited for being incorporated in an automatic and real time drowsiness detection system.
2.2.2 Objective measures
2.2.2.1 Vehicle-based measures
A complementary source of information is available from the vehicle system, since drowsy drivers tend to lose control of the vehicle. Vehicle-based measures can be obtained by placing sensors in the car. Although some researchers found that high variability in the speed is related to drowsiness states, sensors are usually placed on the steering wheel and not on the acceleration pedal [47]. Two most commonly used vehicle-based measures are steering wheel movement (SWV) and standard deviation of lane position (SDLP).
SWV can be measured by an angle sensor. According to [48], as drivers get drowsy, the number of micro-corrections to the steering wheel decreases, since drowsiness negatively impacts on driver’s ability to maintain the car’s trajectory [45]. Specifically, small steering movements (one to five degrees) decrease with drowsiness, while larger steering movements (six to ten degrees)
increase [49]. This situation is due to the fact that when drivers become sleepy, they also lose their attention and therefore normal deviations in the trajectory are not immediately detected. Once detected, larger steering wheel movements are needed to correct those deviations [49, 50].
Regarding the deviations already mentioned, the other parameter that can be used to evaluate the level of drowsiness is the SDLP, measured by external cameras. According to [10], higher drowsy levels are related with an increase in standard deviation of the lane position. However, large individual differences were detected and values were quite different among the subjects.
Vehicle-based measures are quite unreliable, since they depend on several external factors, such as geometric characteristics of the road and vehicle type. Also, it was verified that these measures can be influenced by other factors, such as drugs, caffeine and specially alcohol, having similar effects in drivers as drowsiness [10, 51, 52, 53].
2.2.2.2 Behavioral measures
Behavioral measures have been used to detect levels of drowsiness. As drivers get drowsy, their fa-cial expression and movements change, including changes in head pose, state of the eyes, blinking and yawning [54, 55]. In order to evaluate those measures, cameras have been used and algorithms for face detection, region segmentation and feature extraction have been developed [56].
Blinking is usually used as a complementary parameter in drowsiness detection, since behav-ioral measures are not reliable enough to be used alone [12, 38]. Specifically, percentage of eye closure, also known as PERCLOS, has been analyzed in several studies [28, 57, 58, 59, 60] (Fig-ure 2.5). With the increase of drowsiness, blinks become more frequent and slow and therefore PERCLOS increases [61]. Using an appropriate threshold, it is possible to detect drowsiness. PERCLOS measure can be obtained with an algorithm of face and eyes recognition and tracking, and eye position and pupil’s shape are detected. When eyes start to close, pupils become more elliptical [61]. However, according to [57], the complexity of fatigue is too high to distinguish between normal and fatigue samples using only PERCLOS method.
Figure 2.5: Eyelid closure: PERCLOS (from [62])
Several studies have combined yawning, head pose and PERCLOS features to classify driver’s behavior as “drowsy” or “normal” [55, 63, 64, 65, 66]. Detecting several regions such as face, eye and mouth, includes capturing video and applying techniques such as Hough Transform, Gradient Edge Detection and Gabor Filter. Feature extraction methods are used to extract the parameters and are mostly based on wavelet decomposition [64, 65, 67]. In order to classify driver’s state, studies have used Support Vector Machine (SVM), Fuzzy, Neural Networks and Linear Discriminant Analysis (LDA).
12 Literature review
Camera-based systems are normally sensitive to external conditions, such as lightening and occlusions. According to [68], eye tracking can be compromised if drivers wear glasses. However, systems have been developed in order to solve this problem using infrared lights [69]. Also, behavioral measures are prone to errors since drivers can change their facial expression due to several reasons that are not related to drowsiness.
2.2.2.3 Physiological measures
Physiological measures are based on biological signals such as electrocardiogram (ECG), elec-tromyogram (EMG), electrooculogram (EOG) and electroencephalogram (EEG). Also, few re-searchers reported studies using unusual signals, including photoplethysmogram (PPG), respira-tion and electrodermal activity (EDA). Driver drowsiness detecrespira-tion using physiological signals can combine several sensors to measure different signals, creating a more complete but also complex system.
A physiological-based system requires a preprocessing of raw signals, since acquisitions may be prone to errors and noise caused by the movements involved in driving. This preprocessing consists on noise and artifacts removal by applying digital filters, such as low-pass and high-pass filters, and applying some thresholding on some parameters such as time and standard deviation of signal amplitude. This preprocessing is dependent on the type of signal and sampling frequency.
After preprocessing, several features can be extracted from the processed signals using several feature extraction techniques in time or/and frequency domains. Feature extraction is obviously dependent on the type of signal.
Regarding ECG signal, most commonly extracted features are related to heart rate variability (HRV) [13, 38, 58, 70, 71, 72, 73, 74, 75, 76, 77, 78, 79]. HRV, as already said, measures beat-to-beat changes in the heart rate, describing instantaneous variations on RR intervals, also called normal-to-normal (NN) intervals [29]. HRV signal can be obtained through R peak detection algorithms, or more specific, QRS complex detection (association between Q, R and S waves of the ECG signal) algorithms, such as Pan-Tompkins algorithm [73]. In order to extract HRV features, frequency or time methods can be followed.
Frequency domain methods are based in power spectral density (PSD) analysis. This analysis provides basic information of how power (variance) distributes as a function of frequency [29]. Fast Fourier Transform (FFT) is the simplest, fastest, more accurate and most well-known method for computing PSD. Parameters such as power in the VLF (very low-frequency) band (0.003 to 0.04 Hz), in the LF (low-frequency) band (0.04 to 0.15 Hz) and in the HF (high-frequency) band (0.15 to 0.4 Hz) and even ratio LF/HF can be extracted. Some researchers considered that LF and HF are reliable measures of sympathetic and parasympathetic activity, respectively, and the ratio LF/HF describes the balance between those activities [71, 72, 77, 80, 81]. Therefore, since wake-fulness states are related to an increase of sympathetic activity and relaxation states are dominated by a parasympathetic activity, a transition from wake to sleep can be noticed as an increase of HF power or a decrease in LF, and a consequently decrease in LF/HF ratio [13, 72, 76, 81, 82]. On the other hand, awake states present higher LF/HF [71]. Specifically, according to [19], the
first moment of drowsiness is represented by an abrupt fall of heart rate variability maintaining a constant value after few beats, followed by a higher frequency of HRV. Since fatigue is a transition period from wake to sleep, these features are implemented in most studies of driver’s fatigue and drowsiness detection. Regarding time domain methods, statistical features are commonly used [71, 74] and are identified in Table 2.2 [29]. According to [74], better sensitivity, specificity and accuracy can be achieved using a combination of frequency and time domain features.
Table 2.2: Time-domain features of heart rate variability.
Feature (standard unit) Description
SDNN (ms) Standard deviation of NN intervals
RMSSD (ms) Square root of the mean of the sum squares of successive differences between adjacent NN intervals
SDSD (ms) Standard deviation of differences between adjacent NN intervals
NN50 Number of pairs of successive NNs that differ by more than 50 milliseconds
pNN50 (%) Proportion of NN50 divided by total number of NNs
EEG is the most commonly used signal to detect drowsiness [9]. Studies using this kind of signals rely on band frequency division into EEG sub-bands (delta, theta, alpha and beta waves). Several methods can be used such as discrete wavelet transform (DWT) and FFT [33, 78, 83, 84, 85, 86]. Wavelet transformations are considered more efficient for detecting transitions between wake to sleep [28, 87]. Similar to ECG, power spectrum analysis (PSD) can be performed in EEG signals and power band features can be extracted. Studies have demonstrated that after sleep deprivation or with monotonous and long driving, activity of beta band (fast wave, related to alertness) decreases [84, 88, 89]. In addition, changes in theta and alpha bands reflect changes in drowsy state [90, 91, 92]. More specifically, with sleepiness, EEG wave gets slower, since beta and alpha waves give place to lower frequency bands, such as theta and even delta waves [20, 33, 93]. Some researchers have used EOG for detecting eye movement. Although some movements are quite similar, it is possible to detect eye blinks from EOG signal (vertical channel), saccades or fast eye movements (vertical and horizontal channels) and also slower movements (mostly horizontal channel). These types of movements are distinguishable using peak detection techniques and velocity analysis, including thresholding and first order derivative methods [94, 95, 34, 96, 97, 98], respectively.
14 Literature review
Based on blinks and saccades, several features can be extracted and the most important ones are identified in Table 2.3 [67, 99]. In most cases, and as already said, rapid eye movements (shorter blinking durations and shorter pauses) are related to awake states and slower ones (longer blinking durations, higher closing times and longer pauses) are related to drowsiness states [20, 67]. EOG signals are used together with other physiological signals for better estimation of drowsi-ness state [93] or for labeling the users’ state as “awake” or “sleepy” in some studies [100].
Table 2.3: Eye movement features extracted from EOG signals.
Feature (standard unit) Description
Blink/Saccade duration (ms) Time between start and end of a blink/saccade
Blink 50% duration (ms) Time between half rise and fall amplitudes of a blink
Blink/Saccade Amplitude (µV ) Amplitude of a blink/saccade
Blink/Saccade Frequency Number of blinks/saccades per time unit
Blink energy (µV2) Sum of the square of differences between amplitude values and amplitude of the start value of a blink
Blink closing time (ms) Duration of closing phase of a blink
Blink opening time (ms) Duration of opening phase of a blink
Blink reopening time (ms) Time interval between the start of the opening phase of a blink and maximum velocity point in the same phase
Blink closure speed (µV /ms) Average speed during closing phase, defined as the ratio between amplitude and duration of closing phase
Blink opening speed (µV /ms) Average speed during opening phase, defined as the ratio between amplitude and duration of opening phase
Saccade average speed (µV /ms) Ratio between amplitude and duration of a saccade
PERCLOS (%) Percentage of eye closure of a blink (proportion of time for which the eyes are more than 80% closed)
increasing the accuracy of the detection [93]. EMG signal changes from higher frequencies to lower ones in the transition of wake to sleep and, therefore, can be a measure of fatigue [20, 33].
Regarding feature selection, methods that pick up the most important extracted features, sev-eral studies have used Principal Component Analysis (PCA) and some extensions such as Kernel Principal Component Analysis [57, 84, 86]. According to [57], a separation between normal and fatigue samples may be possible if an appropriate kernel and ECG data is used. Other methods have been used, such as Wilks’ lambda minimization criterion [71] and feature ranking based on the difference in the area under curve (DAUC) of a classifier based on a specific feature and a random classifier. Therefore, DAUC can be related to the power of a feature [58]. Since the num-ber of extracted features is reasonable, most of studies have not used feature selection. Simpler physiological features related to HRV (LF/HF ratio and standard deviation of RR intervals) and heart and respiration rates have higher importance than more complex ones, that present lower discrimination power [58].
In this case, classification methods are usually used to classify data as “sleep”/“drowsiness” and “awake” or “safe”, “warning” and “dangerous” [59]. Researchers have studied several classi-fication methods such as Bayesian [38, 70, 58, 59], Linear Discriminant Analysis (LDA) [38, 59, 71, 72, 73, 80], k-Nearest-Neighbors (kNN) [74, 80], Support Vector Machine (SVM) [58, 80, 99], Artificial Neural Networks (ANN) [33, 93], etc. Some researchers have used more than one clas-sification method, leading to different performances. In the study presented in [58], SVM had the best accuracy, followed by Decision Trees and Bayesian classifier. An overview of previous works on driver drowsiness detection using physiological signals is presented in Table 2.4.
16
Literature
re
vie
w
Table 2.4: Previous studies on driver drowsiness detection using physiological signals.
Reference Signals Preprocessing Feature Extraction Feature Selection Classification
Miyaji (2014) [70]
ECG, EEG,
EOG None
Frequency domain HRV features (Fast Fourier
Transform) None Bayes Vicente et al. (2016) [71] ECG
Signal qualification block based on standard
deviation of ECG amplitude
Frequency domain HRV features (Integral pulse frequency modulation model
with time-varying threshold (TVIPFM)) Wilks’ lambda minimization criterion Linear Discriminant Analysis (LDA) Wu et al.
(2012) [57] ECG None Time domain HRV features
Kernel Principal
Component Analysis None
Vicente et al. (2011)
[72]
ECG
Low-pass filter and signal qualification block based
on standard deviation of ECG amplitude
Frequency domain HRV features (Smoothed Pseudo
Wigner-Ville Distribution (SPWVD))
None Linear Discriminant Analysis
Wang et al.
(2010) [73] ECG None
Time and frequency domain HRV features (Power Spectrum
Density)
Kernel-based class separability
Linear Discriminant Analysis
v er’ s fatigue detection methods 17
Reference Signals Preprocessing Feature Extraction Feature Selection Classification
Begum et al.
(2012) [74] ECG Time thresholding
Time and frequency domain HRV features (Power Spectrum
Density using Fast Fourier Transform)
None
Euclidean distance, Fuzzy similarity and k-Nearest Neighbors Rigas et al. (2011) [58] ECG and respiration Low-pass Butterworth filter and smoothing
filters
Power Spectrum Density using Fast Fourier Transform for frequency HRV and respiration
features
Feature ranking based on difference in the area
under curve
Support Vector Machine, Decision Trees and Naive
Bayes Healey and Picard (2005) [38] ECG, EEG and respiration
Averaging and low-pass filters
Power Spectrum Density for frequency HRV, skin conductivity and respiration
features
None Linear Discriminant Analysis and Bayes
Jung et al.
(2014) [75] ECG
Amplification, high-pass and low-pass filters
Time and frequency domain
18
Literature
re
vie
w
Previous studies on driver drowsiness detection using physiological signals (continued).
Reference Signals Preprocessing Feature Extraction Feature Selection Classification
Lee and Chung (2012) [59]
ECG and
respiration None
Heart rate and blood pressure
features None
Fuzzy Bayesian network (FBN) Ro-driguez Ibañez et al. (2011) [101] ECG, EEG, EOG and respiration
Second order Butterworth
low-pass filter Breathing variability features None Threshold
Gupta
(2014) [76] ECG
Second order Butterworth low-pass filter
Frequency and time HRV features (Power Density
Spectrum) None Threshold Khushaba et al. (2011) [80] ECG, EEG
and EOG Low-pass filter
Fuzzy
mutual-information-based wavelet packet transform
(FMIWPT)
Kernel-based class separability
Linear Discriminant Analysis, Support Vector
Machine, k-Nearest Neighbors
v er’ s fatigue detection methods 19
Reference Signals Preprocessing Feature Extraction Feature Selection Classification
Patel et al.
(2011) [77] ECG
Band-pass filter and thresholding
Frequency domain HRV features (Power Spectrum Density using Fast Fourier
Transform)
None Neural Networks
Lin et al.
(2012) [83] EEG
Independent component analysis (ICA) decomposition
Power Spectrum Analysis using
Fast Fourier Transform None
Self-organizing Neural Fuzzy Inference Network
(SONFIN)
Akin et al. (2008) [33]
EEG and EMG
Band-pass filter and
Visual Inspection Discrete Wavelet Transform None
Artificial Neural Network (ANN) Back Propagation
Liu et al.
(2010) [84] EEG
Least Mean Square and
Visual Inspection Wavelet-packet Analysis
Principal Component Analysis
Hidden Markov Model and Euclidean distance
Lin et al.
(2010) [85] EEG Low-pass filter Fast Fourier Transform None Mahalanobis distance
Kurt et al. (2009) [93]
EOG and EMG
Low-pass filter and
20
Literature
re
vie
w
Previous studies on driver drowsiness detection using physiological signals (continued).
Reference Signals Preprocessing Feature Extraction Feature Selection Classification
Hu and Zheng (2009) [99]
EEG, EOG and EMG
High-pass filter and
thresholding Neighborhood search None Support Vector Machine
Murata and Hiramatsu (2008) [78]
EEG and
ECG None
Mean power frequency EEG features and frequency domain HRV features (Power Spectrum
Density) using FFT
None Threshold
Lin et al.
(2008) [86] EEG Band-pass filter Fast Fourier Transform
Principal Component
Analysis Linear Regression Model
Yu (2009)
[13] ECG Least Mean Square
Frequency domain HRV features (Power Spectrum Density using Fast Fourier
Transform)
2.2.3 Performance metrics
In this application, performance metrics are used to evaluate how well an algorithm detects fatigue. The most common metric that all studies use is accuracy, also called fatigue recognition rate. However, precision, sensitivity and specificity are also used by some studies [28, 71].
Most of the results are presented by the confusion matrix shown in Table 2.5 and Table 2.6 summarizes the several measures used, for a binary classification problem [102], where TP (true positive) corresponds to the number of samples correctly classified as “drowsy”, TN (true neg-ative) corresponds to the number of samples correctly classified as “awake”, FP (false positive) corresponds to the number of “awake” samples classified as “drowsy”, FN (false negative) corre-sponds to the number of “drowsy” samples that are not detected and, therefore, are classified as “awake”, Ypredicted corresponds to the vector of n predictions and Yreal corresponds to the vector of n true states.
Table 2.5: Confusion matrix of a binary classifier.
predicted awake drowsy
given awake TN FP drowsy FN TP
Additionally, a receiver operating characteristic (ROC) curve can be analyzed [28]. A ROC curve is a graphical plot that illustrates the performance of a binary classifier system when the discriminant threshold is varying. The plot is the sensitivity, also known as true positive rate, as a function of 1 − specificity, also known as false positive rate [103].
Since studies use different databases in order to validate and test their own detection algo-rithms, the number of subjects, size of data and also the experimental conditions are quite variable among studies. For that reason, a specific metric value in one study may not be comparable to the same result in another different study.
Although these measures are really good indicators of the general performance of algorithms and systems, they do not take into account the delay time. Delay time can be described as the time between the beginning of drowsy and drowsy detection by the algorithm and can have a negative impact on the system quality, since accidents may occur during that time. A continuous and au-tomatic monitoring system requires a fast response, but also needs to immediately detect drowsy levels (with a delay time ideally as small as possible). In order to reduce the negative impact already mentioned, detecting the transition between the awake state to the drowsy state may be a smart solution for implementing in monitoring systems, since the driver would be warned in the moment that starts to get drowsy. For detecting that transition, one possible solution is studying driver’s drowsiness detection as a multi-class classification problem, with at least three classes (“awake”, “medium” and “drowsy”). The “medium” class is exactly related to the transition be-tween the awake state to the drowsy state. The detection of that transition contributes for a lower
22 Literature review
Table 2.6: Performance measures for binary classification.
Metric Formula Description
Accuracy TP + TN
TP + TN + FP + FN (2.1)
Percentage of test samples that are correctly classified; overall
effectiveness of a classifier
Precision TP
TP + FP (2.2)
Class agreement of the data labels with the positive labels
(“drowsy”) given by the classifier Sensitivity (Detection Rate DRdrowsy) TP TP + FN (2.3) Effectiveness of a classifier to identify positive labels
(“drowsy”)
F1-score 2 ×Precision × Sensitivity
Precision + Sensitivity (2.4)
Measure of a test’s accuracy. It is a weighted average of the
precision and sensitivity
Specificity (Detection Rate DRawake) TN TN + FP (2.5) Effectiveness of a classifier to identify negative labels
(“awake”) Mean Square Error 1 n n
∑
i=1(Yipredicted−Yreal
i )2 (2.6)
Measure of the average of the squares of the errors. Assesses
delay time and, therefore, helps to prevent more accidents. For a 3-class problem, the following metrics can be calculated:
DRi= Mi,i ∑3j=1Mi, j (2.7) Accuracy = ∑ 3 i=1Mi,i ∑3i=1∑3j=1Mi, j (2.8)
Where M represents the confusion matrix M = [Mi, j]3x3 and i in DRi corresponds to the i-th
class.
2.2.4 Discussion of advantages, limitations and challenges
Each driver’s drowsiness detection method has its own advantages and limitations and therefore a complete system may combine a mixture of subjective, behavioral and physiological measures in the best possible non-intrusive and practical way [9, 38]. Hybrid systems minimize the number of false detections (FP + FN), keeping a high drowsy recognition rate (accuracy) [104]. Advantages and disadvantages of all measures are summarized in the Table 2.7.
Regarding subjective measures based on questionnaires, they can be really useful in simulated environments, being a simple and subjective indicator of drowsiness. Subjective measures are independent of individual differences, being also sensitive to small changes. However, measure-ments every two to five minutes may lead to undetected sudden variations. Since questionnaires are answered by drivers before, after or during driving, automatic and real time monitoring sys-tems cannot rely on such measures. Also, even in simulated environments, drivers become more alert due to self-introspection, changing possible results. In addition, some objective measures are not in agreement with subjective ones [44].
Objective measures can be used in real-time. However, only physiological signals are reliable enough to be used alone and integrated into a car [38], since it is the only measure that provides information of the true internal state of the driver, not being dependent of external conditions. Furthermore, vehicle-based and behavioral measures also present other limitations.
Vehicle-based measures are not specific to drowsiness and do not take into account the state of the driver. Therefore, these measures present poor performance in situations where drivers are medicated, drunk and under drug influence. Additionally, even external factors can have influence in results, such as the state of both vehicle and road. On the other hand, behavioral measures are widely used to detect drowsiness, considering the external state of a driver. In fact, as drivers get sleepy, facial (specially, eye) movements change and therefore they can be tracked by cam-eras. Computerized algorithms for detecting those movements have been developed for several applications and are quite reliable. However, since cameras present several limitations (occlusion problems and lightning condition dependencies), eye tracking algorithms cannot perform well in some situations, for example when drivers wear glasses.
24 Literature review
Table 2.7: Advantages and limitations of subjective and objective measures.
Measure Advantages Disadvantages
Subjective measures Subjective
Inconsistent, impossible in real-time, may not detect
sudden variations
Vehicle-based measures Non-intrusive, easy to measure Unreliable, dependent on external factors
Behavioral measures Non-intrusive, easy to use, good
knowledge of image processing Dependent on external factors
Physiological measures Reliable, accurate Potentially intrusive, expensive
Physiological systems have not yet been developed to the point where they are inexpensive, convenient and, most important, non-intrusive [38]. Regarding convenience, some sensors may be difficult to use due to wiring and discomfort problems. For example, measuring EEG requires the use of several electrodes in the forehead of the driver and, therefore, a practical system may not be possible to implement. In the particular case of ECG, t-shirts for ECG recording are already developed and validated on the market, but most drivers would not find them practical during daily driving. Thus, integrating sensors on systems in a non-intrusive way still remains a challenge.
Several studies have been made to integrate ECG on the car in a less intrusive manner, using electrodes placed at the driver seat in contact with driver’s back or on the steering wheel, allowing ECG acquisition through driver’s hands [13, 38, 75, 105, 106]. Those studies are presented in the next section.
2.2.5 Monitoring physiological signals using non-intrusive sensors
In the study presented in [13], the steering wheel comprises an electrical conductive fabric with metal, flexible enough to not cause discomfort (Figure 2.6). Acquired ECG signals through this process are severely affected by noise due to body movements. To cancel this noise, preprocessing is extremely important to improve the quality of the signals. ECG signals are filtered with a differ-ential low-pass, a band-pass and a notch filter and a Driven Right Hand circuit is also used (Figure 2.7). Further research consisted on the development of a biosensor for measuring ECG signal when the driver has just one hand in the steering wheel, happening very often in real situations [107].
Figure 2.6: ECG sensor with electrically conductive fabric electrodes in the steering wheel (from [13])
Figure 2.7: Signal block for ECG preprocessing (adapted from [13])
A biosensor placed on driver’s seat for measuring ECG signal was also developed (Figure 2.8). However, conductive fabric that is placed on driver seat’s backrest does not allow contact with the skin of drivers, just with their clothes. Consequently, higher impedance is present and therefore noise is increased. In order to reduce the impedance, an impedance matching circuit with an amplifier is applied to the signal, before the filters already mentioned for the previous method (Figure 2.9).
26 Literature review
Figure 2.8: ECG sensor with electrically conductive fabric electrodes in the driver’s seatback (from [13])
Figure 2.9: Signal block for ECG preprocessing (from [13])
In order to validate these systems, two healthy subjects were recruited for a two hour driving testing in a simulation environment. Experimental results showed that both biosensors (in com-bination with signal processing) can provide reliable data for post analysis of heart rate and heart rate variability.
The study presented in [75] also proposed a system with a sensor embedded in the steering wheel, using conductive fabric electrodes. To remove noise, it was used an analog signal condi-tioning circuit, including an amplifier, a low-pass and a high-pass filters and data communication was made via wireless. To validate the system, two healthy subjects were recruited for a two hour driving test in a simulation environment. This system was validated and assumed as a conve-nient way of measuring ECG in a non-intrusive way for heart rate analysis and, therefore, fatigue detection.
Electrocardiogram monitoring system of a car using a capacitively-coupled electrode has been studied by many researchers [105, 108]. In the study presented in [105], this type of electrode was placed inside the seat and a second electrode (ground) was mounted in the steering wheel (Figure 2.10). Since the system has an electrode that contact indirectly with the driver, an amplifier is required, reducing the impedance. Filtering was made using a band-pass filter. It was possible to detect R peaks in ECG signals with this system. However, the signal processing was not enough to cancel noise and artifacts were visible in the peaks.
![Figure 2.2: Typical ECG waveform: P and T waves, QRS complex and RR interval (adapted from [31])](https://thumb-eu.123doks.com/thumbv2/123dok_br/15839368.1084115/27.892.164.754.448.799/figure-typical-ecg-waveform-waves-complex-interval-adapted.webp)
![Figure 2.3: Different categories of eye movements based on their velocity (from [34])](https://thumb-eu.123doks.com/thumbv2/123dok_br/15839368.1084115/28.892.151.705.149.384/figure-different-categories-eye-movements-based-velocity.webp)
![Figure 2.6: ECG sensor with electrically conductive fabric electrodes in the steering wheel (from [13])](https://thumb-eu.123doks.com/thumbv2/123dok_br/15839368.1084115/45.892.312.621.149.426/figure-sensor-electrically-conductive-fabric-electrodes-steering-wheel.webp)
![Figure 2.9: Signal block for ECG preprocessing (from [13])](https://thumb-eu.123doks.com/thumbv2/123dok_br/15839368.1084115/46.892.168.691.425.628/figure-signal-block-ecg-preprocessing.webp)
![Figure 2.11: Prototype of the HARKEN project (from [106])](https://thumb-eu.123doks.com/thumbv2/123dok_br/15839368.1084115/47.892.305.626.749.1093/figure-prototype-harken-project.webp)
![Figure 2.12: Prototype of CardioID Technologies (from [110])](https://thumb-eu.123doks.com/thumbv2/123dok_br/15839368.1084115/48.892.231.616.276.529/figure-prototype-of-cardioid-technologies-from.webp)
![Figure 3.2: Driving simulator with vehicle, driving software and a video camera (from [13]) A driving simulator software has to gather some virtual driving specific conditions to simulate real world](https://thumb-eu.123doks.com/thumbv2/123dok_br/15839368.1084115/55.892.296.641.443.677/driving-simulator-software-simulator-software-specific-conditions-simulate.webp)
![Figure 3.4: Equipment used in experiments on road (from [101])](https://thumb-eu.123doks.com/thumbv2/123dok_br/15839368.1084115/57.892.288.644.143.404/figure-equipment-used-experiments-road.webp)