2017
UNIVERSIDADE DE LISBOA
FACULDADE DE CIÊNCIAS
DEPARTAMENTO DE BIOLOGIA ANIMAL
The Role of Nanog Regulating Pluripotency: A Single Cell
Approach
Gonçalo Filipe Ferreira Fernandes
Mestrado em Biologia Evolutiva e do Desenvolvimento
Dissertação orientada por:
Domingos Henrique
Maria Gabriela Rodrigues
ii
Resumo
As células estaminais embrionárias (CEE) são células derivadas de células do botão embrionário ou epiblasto de blastocistos, podendo ser mantidas em cultura in vitro indefinidamente. Estas células mantêm características semelhantes às células das quais são derivadas, sendo pluripotentes e tendo capacidade de autorrenovação, ou seja, têm a capacidade de diferenciarem em todas as células existentes num organismo adulto, e a cada divisão são capazes de gerar pelo menos uma célula-filha com as mesmas características que a célula original. Devido a estas características únicas, se estas células forem colocadas num blastocisto, contribuem para o normal desenvolvimento do embrião, que se torna uma quimera, com células provenientes do blastocisto e das células estaminais embrionárias.
Devido a estas razões, as CEE têm-se tornado uma ótima ferramenta para estudar o desenvolvimento embrionário. A recente descoberta de que células diferenciadas podem ser induzidas a recuperar o fenótipo de pluripotência deu um novo fôlego ao estudo dos mecanismos necessários para a indução de pluripotência e de diferenciação. Como estas células têm a capacidade de se diferenciarem em todos os tipos celulares existentes num organismo adulto, também têm sido muito estudadas para futuras aplicações em medicina regenerativa.
Estas características especiais das células estaminais, pluripotência e autorrenovação, são mantidas por uma rede de fatores de transcrição, centrada em três elementos: Oct4, Sox2 e Nanog. Estes fatores de transcrição atuam em conjunto, regulando a sua própria expressão e a de outros genes envolvidos na manutenção da pluripotência, e reprimindo a expressão de genes envolvidos em diferenciação. Enquanto que Oct4 e Sox2 são homogeneamente expressos nas condições normais de cultura de células pluripotentes, Nanog é expresso de forma heterogénea, sendo muito expresso em algumas células e pouco expresso noutras. Estas células que apresentam baixa expressão de Nanog também apresentam expressão de genes normalmente associados com diferenciação. O facto destes genes serem expressos maioritariamente em células com baixa expressão de Nanog levou à criação de uma hipótese em que o Nanog poderá ser um regulador destes genes, reprimindo-os quando é expresso.
O ambiente de cromatina é um dos principais reguladores da expressão genética, tendo alguns estudos desvendado uma ligação entre o Nanog e enzimas modificadoras da cromatina, como Tet1 (ten-eleven translocation 1) e Ezh2. Tet1 é uma enzima responsável pela demetilação do DNA, sendo o seu substrato as citosinas metiladas (5mC) do DNA. Ezh2 é o componente enzimático do complexo PRC2 (polycomb repressive complex 2), responsável pela metilação da lisina 27 da histona H3 (H3K27). Demetilação da 5mC é normalmente associada a ativação da expressão genética, e metilação da H3K27 associada a repressão genética. No entanto, também já foi descrito que o PRC2 se liga a regiões hipometiladas do genoma, como aquelas que são criadas pela Tet1.
Neste projeto, é proposto um mecanismo de ação do Nanog na regulação dos genes envolvidos em diferenciação, em que o Nanog recruta Tet1 para as regiões promotoras desses genes, permitindo a sua demetilação (5mC para 5hmC). Estes promotores hipometilados são reconhecidos pelo PRC2, que metila as histonas H3 que estão na vizinhança, no resíduo K27.
Este mecanismo foi testado através da utilização de moduladores químicos, que afetam a atividade da Tet1 e do PRC2. A atividade da Tet1 é estimulada por ácido ascórbico, também conhecido por vitamina C, e a atividade do PRC2 é reprimida por GSK343, um composto inibidor da atividade da Ezh2, a subunidade catalítica do PRC2 responsável pela metilação da histona H3. Assim, a utilização do ácido ascórbico deverá levar à repressão dos genes envolvidos na diferenciação através da estimulação da atividade da Tet1, levando ao aumento de regiões hipometiladas, à ligação do PRC2 e consequente
iii metilação de H3K27. Por outro lado, a repressão do PRC2 deverá causar o aumento de expressão dos genes envolvidos em diferenciação devido à não metilação de H3K27.
A heterogeneidade da expressão do Nanog e, por comparação, a homogeneidade do Sox2 foram analisadas através de uma técnica que permite a quantificação do número exato de moléculas de mRNA existentes numa célula, sendo que a análise de muitos células permite medir as características da população. Os nossos resultados mostram que o Nanog apresenta uma grande heterogeneidade ao nível da expressão do mRNA, com células com um reduzido número de transcritos e células com elevado número de mRNAs. Por outro lado, observa-se uma grande frequência de células com um número médio de transcritos de Sox2, e poucas células com maior ou menor número de transcritos. Entre estes dois genes existe uma correlação positiva, indicando que a maioria das células com alta expressão de um dos genes também tem alta expressão do outro, à exceção de 30% de células que apresentam alta expressão de Sox2 e baixa expressão de Nanog. Estas células correspondem às que poderão estar a explorar a pluripotência através da expressão de genes envolvidos em diferenciação. A expressão de alguns destes genes foi também analisada, com os resultados a mostrarem que a maioria das células os expressa a baixos níveis, existindo alta expressão em apenas um pequeno número de células, maioritariamente células com baixa expressão de Nanog.
A expressão de Fgf5 e Sox3, dois dos genes envolvidos em diferenciação e expressos em células com baixa expressão de Nanog, foi também analisada em células de subpopulações puras com alta e baixa expressão de Nanog, sorteadas com base na presença duma proteína fluorescente, cujos níveis de expressão mimetizam a presença de Nanog. Nestas populações é possível observar uma clara distinção entre os dois estados de expressão do Nanog, em que uma população expressa altos níveis de Nanog e baixos níveis de Fgf5 e Sox3, enquanto que a outra população expressa baixos níveis de Nanog e altos níveis de Fgf5 e Sox3. Os baixos níveis de expressão destes dois genes nas células com alta expressão de Nanog permitiram a definição de alta expressão de genes envolvidos em diferenciação, definindo um limiar entre baixa e alta expressão.
Tendo confirmado a heterogeneidade da expressão do Nanog e a maior expressão de genes envolvidos em diferenciação em células que apresentam baixa expressão de Nanog, o modelo proposto foi testado. O modelo foi testado numa população normal (heterogénea) e em subpopulações puras com alta e baixa expressão de Nanog (sorteadas com base na expressão de uma proteína fluorescente, que mimetiza a expressão do Nanog). Na população normal foram testados os genes Car2, Crabp2, Fgf5 e Sox3, enquanto que nas experiências com as subpopulações apenas foram testados os genes Car2 e Sox3. Os resultados obtidos com o trabalho descrito nesta dissertação corroboram, através de evidências experimentais, o modelo aqui proposto para regulação de expressão de genes envolvidos em diferenciação, dando como exemplo o Sox3, por parte do Nanog, em cooperação com Tet1 e PRC2.
Palavras-chave: Células Estaminais Embrionárias, Nanog, Pluripotência, Lineage-priming,
iv
Abstract
Embryonic stem cells (ESC) are derived from the epiblast region of blastocysts and characterized by self-renewal and pluripotency. These characteristics are maintained by the activity of the pluripotency network, at the core of which functions a trio of transcription factors, namely Oct4, Sox2 and Nanog. In cultured mouse ESCs (mESCs), Oct4 and Sox2 are homogeneously expressed, while Nanog shows a remarkable heterogeneity. Hence, it is possible to distinguish between states of low and high Nanog expression (Low- and High-Nanog, respectively), which previous work has shown to be functionally and molecularly different.
In the High-Nanog state, the pluripotency network is fully active, maintaining pluripotency and repressing differentiation, whereas mESCs at the Low-Nanog state are characterized by low level expression of genes usually involved in lineage-choice and differentiation (“priming genes”). This observation led to the proposal that Nanog might be a regulator of these priming genes, and that the observed Nanog fluctuations provide windows of opportunity within the pluripotent state, during which mESCs can be primed for lineage differentiation.
The chromatin environment is also a key regulator of pluripotency and differentiation, and Nanog has been shown to interact with chromatin modulating enzymes, like ten-eleven translocation 1 (Tet1) and members of the polycomb repressive complex (PRC2). Tet1 is an enzyme responsible for the demethylation of methylated cytosines (5mC) in DNA, and PRC2 is a complex responsible for the trimethylation of histone H3 at the lysine residue 27 (H3K27), on hypomethylated regions of DNA. Previous work in the Henrique’s laboratory led to a model to understand priming gene regulation by Nanog in mESCs. In this model, Nanog binds to regulatory regions of the priming genes and recruits Tet1, which will catalyse the conversion of 5mC into 5hmC to generate hypomethylated regions (normally in CpG islands). These regions are then recognized by PRC2, that would methylate associated H3 at K27, leading to repression of priming genes. As this regulation depends on Nanog expression, it should work when ESCs transit from the Low-Nanog primed state to High-Nanog, during the observed Nanog fluctuations.
To test the proposed model, mESCs were exposed to small molecule chemical modulators, ascorbic acid (AA) and GSK343, which interfere with Tet1 and PRC2 activities, and gene expression was measured at the single cell level by single molecule RNA-FISH. AA is known to stimulate Tet1 activity, and GSK343 is an inhibitor of Ezh2 activity, the catalytical subunit of PRC2. According to the model, AA should decrease priming gene expression by promoting CpG demethylation of priming genes, and subsequent PRC2 recruitment and H3K27 methylation. On the contrary, GSK343-mediated Ezh2 inhibition should lead to increased priming gene expression by preventing establishment of H3K27 methylation around priming genes.
The results obtained in this thesis, using Sox3 expression as an illustrative priming gene, provide experimental evidence that supports the proposed model of priming gene regulation by Nanog, working with Tet1 and PRC2.
v
Table of Contents
Resumo ...ii
Abstract ... iv
List of Tables ... vii
List of Figures ... viii
List of Abbreviations, Acronyms and Symbols ... ix
1. Introduction ... 1
1.1 Early Mammalian Development... 1
1.1.1 The First Cell Fate Decision ... 1
1.1.2 The Second Cell Fate Decision ... 3
1.2 Capturing Pluripotency ... 5
1.2.1 mESCs as a Study Model ... 5
1.2.2 Maintaining the Pluripotency ... 5
1.2.3 Pluripotency Network ... 7
1.3 Heterogeneity: Creating Possibilities ... 8
1.4 Epigenetics in Development ... 10
1.4.1 DNA methylation ... 11
1.4.2 Chromatin Modifications... 13
1.5 Nanog as a Key Regulator of Priming Gene Expression... 14
2. Aims ... 16
3. Materials and Methods ... 17
3.1. Materials ... 17
3.1.1 Cell Lines ... 17
3.1.2 Reagents ... 17
3.2. Methods ... 21
3.2.1 Expansion of Embryonic Stem Cells ... 21
3.2.2 Chemical Modulators Assay... 21
3.2.3 Flow Cytometry ... 21
3.2.5 Single Molecule RNA Fluorescent in Situ Hibridization (smRNA-FISH) ... 22
3.2.6 Data Analysis ... 23
4. Results ... 24
4.1 Morphology of mESCs and Nanog:VNP Dynamics ... 24
4.2 Analysis of Gene Expression in Pluripotency ... 25
vi
4.2.2 Priming Genes mRNA Expression on mESCs ... 27
4.3 Expression Patterns in Low- and High-Nanog:VNP Sorted mESCs ... 29
4.3.1 Defining High Priming Gene Expression ... 31
4.4 Priming Gene Expression in Pluripotency ... 31
4.5 Nanog, Tet1 and PRC2 in Priming Gene Regulation ... 32
4.5.1 Morphology and Nanog:VNP Dynamics ... 33
4.5.2 Analysis of Gene Expression by smRNA-FISH... 33
4.5.3 Analysis of Priming Gene Expression in Low- and High-Nanog mESCs ... 35
4.6 Tet1 and PRC2 in Nanog-state Transitions ... 37
4.6.1 mESCs Morphology and Nanog:VNP Dynamics ... 38
4.6.2 Gene Expression in Low- and High-Nanog:VNP mESCs ... 39
4.6.3 Analysis of Priming Gene Expression in Low- and High-Nanog ESCs ... 42
5. Discussion and Conclusions ... 44
5.1 Future Perspectives ... 48
6. References ... 49
vii
List of Tables
Table 3.1 – List of Reagents Used Throughout the Experiments Table 3.2 – List of Solutions Used Throughout the Experiments
Table 3.3 – List of Probes Used for mRNA Detection in smRNA-FISH Experiments Table 3.4 – Optical Filters for mRNA Detection in smRNA-FISH Experiments Table 4.1 – Statistical Measurements for the Pluripotency Genes
Table 4.2 – Analysis of Nanog and Sox2 Expressions
Table 4.3 – Statistical Measurements for the Analysed Priming Genes
Table 4.4 – Number and Percentage of mESCs Analysed in Low- or High-Nanog:VNP ESCs
Table 4.5 – Percentage of mESCs with High Expression of Priming Genes Relatively to Nanog Level Table 4.6 – Statistical Measurements for the Analysed Genes in mESCs treated with the Chemical Modulators
Table 4.7 – Percentage of mESCs with High Expression of Priming Genes Relatively to Nanog Level Table 4.8 – Statistical Measurements for the Analysed Genes in Low-Nanog:VNP mESCs treated with the Chemical Modulators
Table 4.9 – Statistical Measurements for the Analysed Genes in High-Nanog:VNP mESCs treated with the Chemical Modulators
Table 4.10 - Percentage of ESCs with High Expression of Priming Genes Relatively to Nanog Level Table 7.1 – Statistical Measurements for Fgf5, Nanog and Sox3 in Low- and High-Nanog:VNP mESCs Table 7.2 – Defined Thresholds for Priming Genes
viii
List of Figures
Figure 1.1 – Early Mouse Embryonic Development. Figure 1.2 – Polarity in the First Cell Fate Decision. Figure 1.3 – FGF Signalling in ICM Lineage Commitment.
Figure 1.4 – The Major Signalling Pathways Regulating Pluripotency in mESCs Figure 1.5 – The Pluripotency Network
Figure 1.6 – Nanog Expression in mESCs and Embryos Figure 1.7 – Central Role of Nanog in Differentiation
Figure 1.8 – Global CpG Methylation Throughout Development Figure 1.9 – Cytosine Methylation and Demethylation Cycle
Figure 1.10 – Role of Bivalent Chromatin in the Developmentally Relevant Genes Figure 1.11 – Nanog Role in Priming Genes Regularion
Figure 2.1 – smRNA-FISH Workflow
Figure 4.1 – Nanog and Sox2 Transcript Distributions and their Correlation Figure 4.2 – Sox2 and Nanog Expressions in Serum/LIF
Figure 4.3 – Priming Genes Transcript Distributions and their Correlation to Nanog Figure 4.4 - Fgf5, Nanog and Sox3 Expression in Low- and High-Nanog:VNP mESCs Figure 4.5 – Experimental Design of Chemical Modulators Assay
Figure 4.6 – Histograms Representing the Expression of Nanog, Car2, Crabp2, Fgf5 and Sox3 in mESCs treated with the Chemical Modulators
Figure 4.7 – Experimental Design of Sorted mESCs treated with the Chemical Modulators
Figure 4.8 – Nanog, Car2 and Sox3 expression in Low-Nanog:VNP mESCs treated with the Chemical Modulators
Figure 4.9 – Nanog, Car2 and Sox3 expression in Low-Nanog:VNP mESCs treated with the Chemical Modulators
Figure 4.10 – Model of Sox3 regulation by Nanog, Tet1 and PRC2 Figure 7.1 – Dispersion Plots of Low- and High-Nanog:VNP mESCs
Figure 7.2 – Nanog:VNP expression in Low- and High-Nanog:VNP mESCs treated with the Chemical Modulators
ix
List of Abbreviations, Acronyms and Symbols
5caC – 5-carboxylcytosine 5fC – 5-formylcytosine
5hmC – 5-hydroximethylcytosine 5mC – 5-methylcytosine
Amot – Angiomotin
AVE – Anterior Visceral Endoderm BMP – Bone Morphogenic Protein Cdx2 – Caudal Type Homeobox 2 C – Cytosine
CpG – 5'—C—phosphate—G—3' DMSO – Dimethyl Sulfoxide DNMTs – DNA Methyltransferases DVE – Distal Visceral Endoderm EPI – Epiblast
E – Embryonic day
ESCs – Embryonic Stem Cells
FACS – Fluorescence-Activated Cell Sorting FBS – Foetal Bovine Serum
FGF – Fibroblast Growth Factor Fgfr – Fibroblast growth factor receptor
H3K4me3 – trimethylation of lysine 4 in H3 histone H3K9ac – acetylation of lysine 9 in H3 histone H3K9me3 – trimethylation of lysine 9 in H3 histone H3K14ac – acetylation of lysine 14 in H3 histone H3K27me3 – trimethylation of lysine 27 in H3 histone H3K36me3 – trimethylation of lysine 36 in H3 histone hESCs – human Embryonic Stem Cells
HMTs – Histone Methyltransferases ICM – Inner Cell Mass
x LIF – Leukaemia Inhibitor Factor
mESCs – mouse Embryonic Stem Cells mRNA – messenger Ribonucleic Acid Oct4 – Octamer-binding transcription factor 4 PBS - Phosphate-buffered saline
PE – Primitive Endoderm
PRC2 – Polycomb Repressive Complex 2 PS – Primitive Streak
RNA-seq – RNA sequencing
RT-qPCR - Reverse Transcription quantitative Polymerase Chain Reaction smRNA-FISH – single molecule RNA Fluorescent In Situ Hybridization Sox2 – Sex determining region Y-box 2
TDG – Thymine-DNA Glycosylase TE – Trophectoderm
TET – Ten Eleven Translocation TFs – Transcription Factors
1
1. Introduction
1.1 Early Mammalian Development
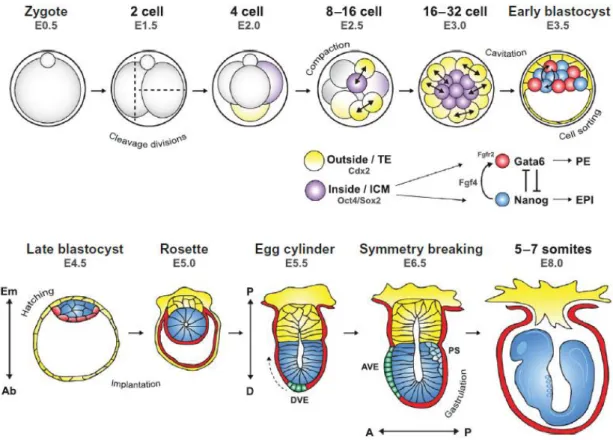
After fertilization, the zygote undergoes a series of divisions into smaller blastomeres, creating a morula. While the first division is meridional, the second is rotational, with one of the blastomeres dividing meridionally and the other equatorially (Figure 1.1; reviewed in Zernicka-Goetz, 2005).
In the zygote, the genome is not being transcribed, and the molecules necessary to the first division were inherited from maternal messenger RNA (mRNA), deposited in the oocyte during its formation. In different mammals, zygotic genome activation happens at different timepoints: 2-cell stage in mice (Mus musculus), 4-cell stage in pigs (Sus scrofa domesticus), 8-cell stage in sheeps (Ovis aries), and between the 4- and 8-cell states in humans (Homo sapiens sapiens; Piko and Clegg, 1982; Crosby, Gandolfi and Moor, 1988; Braude, Bolton and Moore, 1988). Due to the experiments being performed mainly on mouse, I shall focus on this model system from now on.
In mouse embryos, after division from 4- to 8-cell stage, blastomeres endure a process of compaction. This process consists of cell shape changes with previously round and separated blastomeres becoming a compact and spherical group of cells. It is accompanied by formation of tight and gap junctions, in a calcium dependent manner, and accumulation of the adhesion molecule E-cadherin at cell-cell junctions (Ducibella and Anderson, 1975; Hyafil, Baninet and Jacob, 1981; Peyriéras et al., 1983).
With compaction, each blastomere becomes polarized, allowing its division in different orientations (Ziomek and Johnson, 1980). If a blastomere divides symmetrically (perpendicularly to the apical-basal axis), it gives rise to similar daughter cells belonging to the outer layer of the morula. If it divides asymmetrically (along the apical-basal axis), it gives rise to different daughter cells, with the more apical belonging to the outer layer and the more basal becoming completely internalised. Two cell populations thus arise in the embryo (Johnson and Zyomek, 1981): while cells in the outer layer will later develop into the trophectoderm (TE), the inner cells will contribute to the inner cell mass (ICM) of the blastocyst. This is the first cell fate decision happening in the developing mouse embryo (Fleming, 1987).
1.1.1 The First Cell Fate Decision
Inner cells of the morula will give rise to the ICM and the outer cells will become TE, although with some plasticity: if moved, cells can still convert to the other fate, depending on their position (Hillman, Sherman and Graham, 1972; Handyside, 1978; Rossant and Lis, 1979; Spindle, 1978). Polarization of the blastomeres during compaction and following asymmetric divisions made the inner and outer cells distinct due the presence of different components. In the case of inner cells, these cells express transcription factors (TFs) of the pluripotency network, mainly Oct4 (octamer-binding transcription factor 4) and Sox2 (sex determining region Y-box 2; Palmieri et al., 1994; Nichols et al., 1998; Avilion et al., 2003). Oct4 and Sox2 from maternal origin were already present in the zygote, but zygotic expression only starts at morula stage. In the blastocyst, expression of these TFs will be later restricted to ICM (Palmieri et al., 1994; Avilion et al., 2003).
2
Figure 1.1 – Early Mouse Embryonic Development. Through series of cleavage divisions, the zygote gives rise to the morula at E3.0 (embryonic day 3) with two already separated cell populations. Cells on the inside will give rise to the ICM and outside cells will give rise to the TE of the blastocyst. The localization of the ICM determines the embryonic-abembryonic axis of the embryo, that later turns into proximal-distal axis, following implantation. As the blastocyst matures, ICM cells will be specified into epiblast (EPI) or primitive endoderm (PE), due to Nanog, Gata6, Fgf4 and Fgfr2 expression and activity. Once the blastocyst has matured, it hatches from the zona pellucida, implants and continues to develop. The EPI lineage reorganizes into a polarized rosette with the opening of a lumen. The antero-posterior axis will be determined by the migration of the distal visceral endoderm cells (DVE) to form the anterior visceral endoderm (AVE) to one side of the egg cylinder. The primitive streak (PS) formation on the posterior side of the embryo, brakes the symmetry of the embryo and determines the beginning of gastrulation (Graham and Zernicka-Goetz, 2016).
Cells at the outer region of the morula express different TFs, like Cdx2 (caudal type homeobox 2) that is one of the main TFs involved in TE differentiation and specifically expressed in the outer cells of the morula (Niwa et al., 2005; Strumpf et al., 2005). Cdx2 expression is regulated by Tead4, which is uniformly expressed in all cells, independently of their position (Nishioka et al., 2008). Although uniformly expressed, Tead4 only activates Cdx2 expression in outer cells due to the differential activity of its transcriptional activators Yap and Taz (Nishioka et al., 2009). In inner cells, phosphorylation of Yap and Taz by the Hippo pathway kinases Lats1/2 prevent their migration to the nucleus to act with Tead4 in the activation of Cdx2 expression (Nishiola et al., 2009).
Although all components of the Hippo pathway necessary to phosphorylate Yap and Taz being present in all cells, the critical factor is angiomotin (Amot), which is located at adherent junctions in inner cells and in the apical region in outer cells. Amot apical position prevents its interaction with Lats1/2, not phosphorylating Yap/Taz, not sequestering it in the cytoplasm, being able to migrate to the nucleus and activate Cdx2 expression together with Tead4 (Figure 1.2; Hirate et al., 2013; Leung and Zernicka-Goetz, 2013).
3
Figure 1.2 – Polarity in the First Cell Fate Decision. Cdx2 expression is dependent of Tead4 and Yap/Taz activity. In outside cells (yellow) Yap/Taz are not phosphorylated by Lats1/2 due to the apical positioning of Amot, being able to migrate to the nucleus and coactivate Cdx2 expression. In inner cells of the morula (purple), Lats1/2 can phosphorylate Yap/Taz, sequestering it in the cytoplasm and inhibiting Cdx2 expression (Graham and Zernicka-Goetz, 2016).
In the beginning of morula, Cdx2 and Oct4 are co-expressed in the all cells. Sorting occurs through a process of cross-regulation, in which each TF activates their own expression and represses expression of the other. During this Oct4/Cdx2 competition, cell fate is still plastic, but it will evolve to complete exclusion of each TF to individual cells, which acquire a specific fate (Oct4+ cells become ICM and
Cdx2+ become TE; Niwa et al., 2005).
During the initial differentiation of TE and ICM, cells are still in direct contact, but through a process of cavitation, the blastocoel is formed. Blastocoel is a cavity inside the blastocyst, filled with fluid secreted by trophoblast cells. Trophoblast cells express a Na+/K+-ATPase that pumps Na+ to the cavity
of the forming blastocyst, followed by the osmotic transport of water (Cross, 1973; Watson and Kidder, 1988). With increased volume of the blastocoel, the ICM sits in one side of the blastocyst, with some cells contacting the trophoblast and the others the blastocoel fluid.
At this point, there is a surge of cell death (Handyside and Hunter, 1986). The reason is not yet completely understood, but one of the main explanations might be cell-cell competition, with less fit cells being eliminated. In mESCs, it has been shown that cells with defective signalling or defective gene expression are eliminated through competition (Sancho et al., 2013).
1.1.2 The Second Cell Fate Decision
When the blastocyst forms at E3.5, ICM cells are already heterogeneous in expression of some TFs. Two of the most heterogeneously expressed TFs are Nanog and Gata6. During EPI/PE specification, PE
4 progenitor cells will migrate and form a monolayer separating the EPI cells from the blastocoel. The migration depends on the expression of LamininB1 and Dab2, cellular adhesion molecules, whose expression is induced by Gata6 (Figure 1.3; Chazaud et al., 2006).
Although specification of ICM into EPI or PE only occurs with maturation of the blastocyst, it started during the internalization and asymmetric divisions at the morula stage due to differential fibroblast growth factor (FGF) signalling (Yamanaka et al., 2010). The internalization of blastomeres occurs in two distinct rounds of asymmetric cell divisions (from 8- to 16-cell and 16- to 32-cell stages; Chazaud et al., 2006). Blastomeres internalised in the first round of cell divisions are biased towards EPI while blastomeres internalised in the second round of divisions are biased towards PE (Morris et al., 2010). At the 16-cell stage, after the first round of internalisation, Fgf4 (fibroblast growth factor-4) is upregulated in inner cells by Nanog, inducing the expression of its receptor, Fgfr2 (fibroblast growth factor receptor 2), in the outer cells of the morula. Thus, in the second round of internalization, the internalised blastomeres present higher expression of Fgfr2, being able of higher response to FGF signalling. As Fgf4 produced by the first internalised cells reaches its receptor in the later internalised cells, FGF signalling cascade induces the expression of Gata6 in these cells. As the first internalised cells receive less FGF signalling, Gata6 is not activated. Then, by a process of mutual repression, Nanog and Fgf4 will be restricted to the future EPI cells and Fgfr2 and Gata6 to the future PE cell (reviewed in Lanner and Rossant, 2010).
Figure 1.3 – FGF Signalling in ICM Lineage Commitment. Fgf4 is produce in the first internalised cells (Nanog expressing cells), inducing the expression of its receptor, Fgfr2, in the later internalised cells. In these last cells, FGF signalling cascade induces the expression of Gata6, that will repress Nanog expression and induce the expression of LamininB1 and Dab2, adhesion molecules responsible for the migration and sorting out of PE. Then, by mutual exclusion, Nanog and Fgf4 will be restricted to EPI cells and Gata6 and Fgfr2 restricted to PE cells (Chazaud et al., 2006).
Besides formation of EPI and PE, another event that must occur after maturation of blastocyst is the escape from the zona pellucida. This is a layer of extracellular matrix protecting the blastocyst since its formation in the oocyte. This is a critical process without which blastocysts cannot implant into the uterus and continue the development of the embryo (Perona and Wassarman, 1986).
5
1.2
Capturing Pluripotency
The zygote is a totipotent cell, being able to differentiate into cells with capacity to develop into all embryonic and extraembryonic structures of an embryo. As they divide, the initial blastomeres remain totipotent, only starting to be specified into different lineages with the formation of the morula. Once the blastocyst is formed, two lineages are defined and only the cells from the ICM remain pluripotent. ICM cells have the capacity to differentiate into all embryonic tissues, but lost the capacity to differentiate into extraembryonic tissues, that are restricted to TE. Throughout embryonic development, as cells differentiate, they lose some of their potential until they reach the final state, a completely differentiated cell. However, some progenitor multipotent cells remain in the adult organism (reviewed in Wagers and Weissman, 2004).
Pluripotency is a temporary state in embryonic development, starting around the early blastocyst stage (E3.5), with the emergence of epiblast precursors, and persisting in their descendants until being completely dismantled prior to somitogenesis, at E8.0 (Osorno et al., 2012).
The limited number of cells in a blastocyst and its rapid development make it very difficult to study the differentiation potential of epiblast cells. As such, embryonic stem cells (ESCs) were established as an alternative to study this process.
1.2.1 mESCs as a Study Model
Mouse ESCs (mESCs) are cultured cells derived from the ICM of a blastocyst (Evans and Kaufman, 1981; Martin, 1981), maintaining similar characteristics to the cells from which they were derived. These cells maintain the pluripotency and self-renewal properties characteristic of the ICM/EPI cells of blastocysts, being able to be expanded without losing their potential and, given the right cues, differentiate into all cell types (Keller, 1995).
Due to these characteristics, when injected into a blastocyst at an appropriate stage according to the culture conditions, they contribute to the formation of all lineages of the embryo, including the germ line (Beddington and Robertson, 1989; Huang et al., 2012).
1.2.2 Maintaining the Pluripotency
Initially, mESCs were cultured over a layer of mitotically inactivated fibroblast feeder cells, in media previously conditioned by embryonal carcinoma cells, containing also calf serum or foetal/new-born calf serum (Evans and Kaufman, 1981; Martin, 1981). These culture conditions are now known to contain signalling molecules involved in LIF, BMP and Wnt signalling, the main signalling pathways involved in the maintenance of pluripotency and self-renewal (Figure 1.4).
6
Figure 1.4 – The Major Signalling Pathways Regulating Pluripotency in mESCs. BMP, LIF and Wnt signalling pathways work together to activate the pluripotency network in ESCs (Chen et al., 2016).
LIF Signalling
Leukaemia inhibitor factor (LIF) is a member of the interleukin 6 family of cytokines that is secreted by murine embryonic fibroblasts and stimulates self-renewal while repressing differentiation of mESCs (Smith et al., 1988; Williams et al., 1988).
LIF binds to a heterodimer of LIF receptor beta and gp130 and can activate the signalling pathways of Jak-Stat3, PI3K-Akt, YES-YAP and MAPK-Erk. While the three first pathways stimulate pluripotency, the last stimulates differentiation (Boeuf et al., 1997; Niwa et al., 1998; Armstrong et al., 2006; Niwa et al., 2009).
BMP Signalling
Bone morphogenic proteins (BMPs) are members of the transforming growth factor β (TGFβ) family of cytokines. BMPs bind to a heterodimer of type I and type II receptor serine/threonine kinases. Receptor II phosphorylates receptor I, activating it, leading to phosphorylation of Smad proteins to regulate transcription of target genes (reviewed in Shi and Massagué, 2003).
Wnt Signalling
Wnt signalling works through inhibition of the glycogen synthase kinase 3 β (GSK3β). Binding of Wnt to its receptor phosphorylates GSK3β, leading to the release of β-catenin, which migrates to the nucleus and activates expression of genes of the pluripotency network, mainly Oct4 (Kelly et al., 2011).
Nowadays, mESCs are cultured in more defined media that allow for the maintenance of sub-states within the pluripotency continuum. There are two most common culture media. One depends on the use of foetal bovine serum or serum substitutes, together with LIF (hence named Serum/LIF), while the other uses two specific inhibitors: PD0325901, a MEK inhibitor (upstream of Erk) and CHIR99021, a GSK3β inhibitor. This culture condition is known as 2i (Ying et al., 2008).
mESCs have a transcriptionally hyperactive genome and this property is considered to be one of the hallmarks of pluripotency (Efroni et al., 2008). The transcription dynamics create heterogeneity that can be modulated by different culture conditions.
mESCs grown in presence of 2i have higher and more homogeneous expression level of pluripotency genes and a low expression of lineage-affiliated genes (Marks et al., 2012). These cells are in a naïve state and are considered to resemble pre-implantation epiblasts of E4.5 embryos (Boroviak et al., 2014),
7 although some studies showing that they might resemble cells from embryos between E1.5 (2-cell stage) and E3.5, with embryonic and extraembryonic potential (Macfarlan et al., 2012; Gonzalez et al., 2016). Recent studies have found that prolonged maintenance of mESCs in 2i impairs their developmental potential, one of the main characteristics of ESCs. The use of the inhibitors induces a widespread DNA methylation loss, which can only be reverted in mESCs cultured for short periods of time, when transplanted into blastocyst. Once cultured for longer periods in 2i, mESCs lose the capacity to methylate imprinted genomic regions that are developmentally essential, resulting in developmental arrest (Choi et al., 2017; Yagi et al., 2017).
When mESCs are cultured in Serum/LIF, expression of pluripotency genes is more heterogeneous, and expression of lineage-affiliated genes is higher (Efroni et al., 2008). These mESCs are considered to be similar to post-implantation epiblasts of E5.5 embryos (Boroviak et al., 2014), although some studies placing them closer to E4.5 embryos (Gonzalez et al., 2016). Due to higher heterogeneity in this culture condition, several sub-populations can be delimited and are thought to correspond to different embryonic stages, spanning from E3.5 to E5.5 (Papatsenko et al., 2015).
These culture conditions maintain mESCs in a pluripotency state with similarities to the embryo, but they also need to stabilize it to be able to expand indefinitely, something that does not happen in the embryo. During in vitro derivation of mESCs from the ICM, there are many genes with differential expression, as cells replace their genetic program of differentiation into a program of maintenance of self-renewal and pluripotency. These modifications in gene expression are also accompanied by changes in epigenetic modifications and in the expression of microRNAs (Tang et al., 2010).
1.2.3 Pluripotency Network
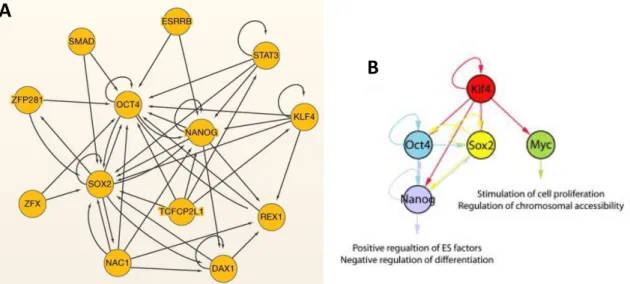
The pluripotency network maintains the special characteristics of ESCs, with the core of this network being composed by the TFs Oct4, Sox2 and Nanog (Figure 1.5).
Oct4
Oct4, encoded by the POU5f1 (POU domain, class 5, transcription factor 1) gene, is a member of the mammalian POU family of transcription factors, whose expression is necessary for the formation of the pluripotent population in an embryo (Nichols et al., 1998). Although necessary, the expression level needs to be tightly regulated as it has been shown that either increasing or decreasing its expression causes loss of pluripotency. Overexpression causes differentiation into primitive endoderm and mesoderm while decrease of expression causes dedifferentiation into trophectoderm (Niwa et al., 2000). Sox2
Sox2 is a member of the Sry-related HMG (high-mobility-group) box family of transcription factors and is known to bind to the same regions of the genome as Oct4, acting individually and synergistically. The Oct4-Sox2 joint function is possible by interaction of their POU and HMG domains (Chew et al., 2005). Like Oct4, Sox2 is also necessary for the formation of the pluripotent cells of a blastocyst, as its deletion has been shown to cause cells to go into a trophectodermal fate (Masui et al., 2007).
Nanog
Nanog is a homeodomain protein that forms functional dimers through its tryptophan-rich domain (Mullin et al., 2008; Wang et al., 2008), with dimerization being essential to the interaction with other pluripotency factors (Wang et al., 2006).
8 In the embryo, Nanog expression is restricted, being expressed only in the ICM, EPI and germline progenitor cells (Chambers et al., 2003; Mitsui et al., 2003; Yamaguchi et al., 2005). Due to its critical role in epiblast determination, epiblast cells fail to develop in Nanog mutants, with cells shifting into an extraembryonic endoderm lineage (Mitsui et al., 2003).
Although being necessary for cells to reach the pluripotent state, pluripotent cells can be maintained and expanded in the permanent absence of Nanog. These cells are, however, prone to differentiation (Chambers et al., 2007). On the other hand, overexpression of Nanog confers a higher capacity of self-renewal, independently of the presence of cytokines like LIF (Chambers et al., 2003).
Besides being very important for developmental progression of the mouse embryo, Nanog is not one of the essential TFs to reprogram fibroblasts into induced pluripotent stem cells (Takahashi and Yamanaka, 2006), like Oct4 and Sox2. Klf4 is the necessary factor and it was later found to have a role in the activation of Nanog (Zhang et al., 2010), the necessary factor to establish and maintain pluripotency (Figure 1.5; Silva et al., 2009).
TFs of the pluripotency network have two main functions: they work together to maintain the pluripotency network active, while at the same time repressing the expression of genes involved in differentiation pathways (Marson et al., 2008). The Oct4-Sox2 complex has been shown to bind to Nanog promoter (van den Berg et al., 2008), besides their own promoters, regulating its expression (Catena et al., 2004; Chew et al., 2005). Nanog does not interact physically with Oct4 and Sox2, but shares many of their binding sites, possibly belonging to the same activation or repressive complex (Chen et al., 2008; Marson et al., 2008).
Figure 1.5 – The Pluripotency Network. (A) The main elements of the pluripotency network in ESCs, with Oct4, Sox2 and Nanog having connections with the majority of the others. (B) Transcriptional network of necessary factors to induce pluripotency in differentiated cells (Klf4, Oct4, Sox2 and Myc) and their relationship to Nanog. In both cases, arrows indicate the direction of transcriptional regulation (adapted from Orkin and Hochedlinger, 2011; Kim et al., 2008).
1.3
Heterogeneity: Creating Possibilities
In embryos, gene expression heterogeneity is present from the moment of compaction, being also detected in ESCs. In mESCs, some pluripotency-associated genes exhibit very heterogeneous expression, including Nanog (Figure 1.6; Chambers et al., 2007; Singh et al., 2007), Rex1 (Toyooka et al., 2008), Stella (Hayashi et al., 2009) and Pecam1 (Furusawa et al., 2004).
A
9
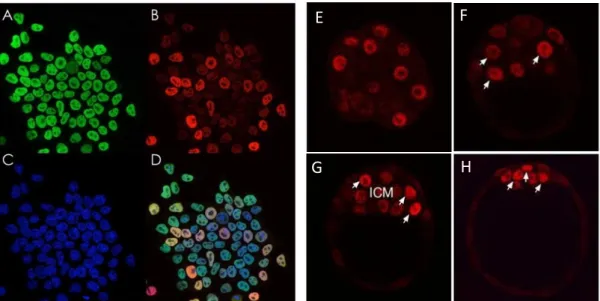
Figure 1.6 – Nanog Expression in mESCs and Embryos. Immunofluorescence staining for: (A) Oct4, (B) Nanog, (C) staining with DAPI and (D) an overlay of A-C. Oct4 staining is relatively homogeneous, whereas Nanog expression levels vary widely. (E-H) Nanog expression in the developing embryo, from late morula to blastocyst (E3.0 - E4.0; adapted from Roeder and Radtke, 2009; Acampora, Giovannantonio and Simeone, 2013).
This heterogeneity might be one of the ways the blastocyst, and therefore mESCs, have found to be able to differentiate into various differentiation paths. ESCs with lower expression of pluripotency TFs might be in a more differentiable state and be first to differentiate when conditions are met. Thus, heterogeneity might create a window of opportunity.
Gene expression can occur as a constitutive process, characterized by a Poissonian-like distribution of transcripts, or episodic processes characterized by stochastic activation (ON) and inactivation (OFF) periods of gene expression, resulting in discontinuous production of mRNA. The episodic process of gene expression is termed transcriptional bursting and is responsible for creating heterogeneity. Transcriptional bursting is influenced by several factors, including the chromatin environment dependent on histone modifications and nucleosome occupancy, transcription factors availability and DNA looping (reviewed in Nicolas, Philips and Naef, 2017). These factors modulate burst size and frequency, generating heterogeneity on gene expression. In humans, transcriptional bursting has been shown to be the predominant mode of gene expression (Dar et al., 2012).
In mESCs, Oct4 and Sox2 are expressed at high and homogeneous levels, whereas Nanog expression levels vary widely, with cells spanning from high expression to very low, or even no expression. mESCs not expressing Nanog, or expressing low levels, remain pluripotent, as shown by their expression of Oct4 (Figure 1.6; Chambers et al., 2007).
Nanog is necessary for the establishment of pluripotency in ICM cells, but once established, it can be maintained in its absence, as shown by experiments in mESCs (Chambers et al., 2007). This suggests that the pluripotency network can operate with different levels of Nanog.
It is therefore possible to define the existence of pluripotent cells expressing high or low levels of Nanog, hereafter designated as High-Nanog and Low-Nanog, respectively. Although remaining pluripotent, Low-Nanog mESCs are prone to differentiation, have a lower capacity to self-renew and present higher expression of differentiation-associated genes, than High-Nanog mESCs (Chambers et al., 2007; Abranches et al., 2013; Abranches et al., 2014).
E
F
10 Expression of differentiation-associated genes in pluripotent cells has been termed as lineage-priming, occurring mainly in Low-Nanog, a permissive state. These cells are expressing different lineage specific genes, each trying to instate their differentiation lineage and induce differentiation of the pluripotent ESCs (Martinez-Arias and Brickman, 2011). Lineage-priming does not imply commitment, as primed cells can revert to a naïve pluripotency state.
High-Nanog cells are in a pristine state of pluripotency, irresponsive to differentiation, where the pluripotency network is fully active and repressing the expression of lineage-affiliated genes. On the contrary, Low-Nanog cells are in a primed state of pluripotency, exploring the possible differentiation options, while remaining pluripotent. Hence, the Low-Nanog state might correspond to an initial stage of differentiation (Figure 1.7).
Nanog heterogeneity has been attributed to stochastic fluctuations in gene expression in individual mESCs. These fluctuations might create a window of opportunity, where mESCs can move between different metastable cell states, accompanied by fluctuations in gene expression. These metastable states are in a dynamic continuum of multiple interconvertible states, in which ESCs have different responsiveness to differentiation stimuli (Graf and Stadtfeld, 2008).
Fluctuations in Nanog expression occur independently of the culture conditions, being an inherent characteristic of mESC, although the Low-Nanog population of cells in the pluripotency ground-state (2i) being smaller, when compared with Serum/LIF (Abranches et al., 2014).
As these states are functionally and molecularly distinct, Nanog heterogeneity can confer an advantage to the mESCs population, as it maintains cells in naïve (High-Nanog) and primed (Low-Nanog) states of pluripotency. Thus, the population can explore multiple differentiation options while maintaining a pool of naïve pluripotent cells (Abranches et al., 2014).
Figure 1.7 – Central Role of Nanog in Differentiation. mESCs fluctuate widely between pluripotent states with different levels of Nanog. Nanog positive ESCs are in a naïve state of pluripotency while Nanog negative ESCs are in a pluripotent primed state. These transient cells can return to the naïve state by re-expressing Nanog or can commit to differentiation (adapted from Chambers et al., 2007).
1.4
Epigenetics in Development
Besides the role of TFs, epigenetic modifications also play a central role in the maintenance of pluripotency and in cell fate specification (reviewed in Surani, Hayashi and Hakjova, 2007). Here, the focus will be on DNA methylation and chromatin modifications.
11
1.4.1 DNA methylation
Throughout development, the CpG (5'—C—phosphate—G—3') methylation pattern changes dynamically to modulate the expression of specific genes necessary to form different structures of the embryo (Figure 1.8).
The gametes are methylated at different proportions, with the oocyte being more hypomethylated than sperm. After fertilization, both genomes face global demethylation in the egg, with sperm genome starting to be demethylated right after the formation of the zygote, while the oocyte genome is only demethylated during the initial cleavages (Smith et al., 2012). The only exceptions to this global demethylation process are the imprinted control regions inherited from the progenitors, as their methylation is maintained during this phase of demethylation and reprograming (Bartolomei and Ferguson-Smith, 2011).
This genome wide demethylation occurs until blastocyst formation, as methylation reaches its lower level in the ICM (Smith et al. 2012). Following this permissive state, where most of the genome is demethylated, it starts to be remethylated as cells differentiate into the three germ layers, with the exception of primordial germ cells, that will be completely demethylated and remethylated to form the gametes (Smith et al 2012).
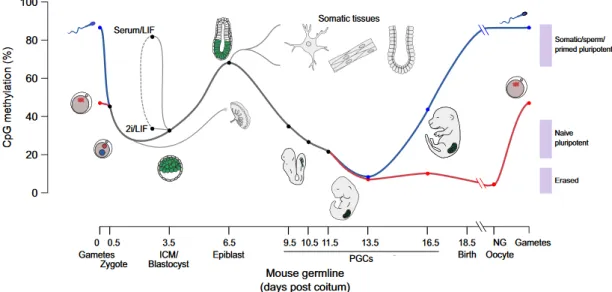
In concordance with their developmental resemblance with ICM cells, mESCs cultured in 2i present an hypomethylated genome, with similar methylation levels to cells from early blastocysts. On the other hand, mESC cultured in Serum/LIF exhibit a hypermethylated genome, with methylation levels closer to the post-implantation epiblast (Habibi et al., 2013). This methylation pattern corroborates the gene expression experiments that postulate that 2i and Serum/LIF correspond to different stages of the blastocyst.
CpG methylation is catalysed by DNA methyltransferases (DNMTs). The members of this enzyme family with methyltransferase activity are Dnmt1, Dnmt3a and Dnmt3b, all working with Dnmt3l as an accessory protein. Dnmt1 is involved in methylation maintenance after DNA replication, and Dnmt3a/b are essential for de novo methylation in both ESCs and early mouse development. These enzymes catalyse the methylation at the 5-carbon of the cytosine (C) residue within the cytosine-guanine dinucleotides (CpG), resulting in the formation of 5-methylcytosine (5mC; Hermann et al., 2004; Okano et al., 1999).
Once methylated, Ten-Eleven Translocation (TET) enzymes, including Tet1, Tet2 and Tet3, can demethylate 5mC. TETs are 2-oxoglutarate (2OG)- and Fe(II)-dependent enzymes. Besides the oxidation of 5mC to hydroxymethylcytosine (5hmC), Tet enzymes can also convert 5hmC into 5-formylcytosine (5fC) and 5fC into 5-carboxylcytosine (5caC; Ito et al., 2011). Once completely oxidised by TETs, 5caC is specifically recognized and excised by thymine-DNA glycosylase (TDG) (Figure 1.9; He et al., 2011).
12
Figure 1.8 – Global CpG Methylation Levels Throughout Development. Paternal (blue line) and maternal (red line) genomes lose methylation until the blastocyst stage (E3.5), regaining it as cell fate specification and differentiation occurs. In primordial germ cells, the methylation is completely erased between E6.5 and E13.5, as these cells emerge from the epiblast. In these cells, methylation level will be regained in a sex-specific manner, as they are specified. ESCs can be cultured from the ICM, and based on the culture conditions remain hypomethylated in 2i or become hypermethylated in Serum/LIF. These methylation states are interconvertible by changing culture medium (dashed line; Lee et al., 2014).
TET enzymes have different cellular distributions and roles, with Tet1 being mainly expressed in ESCs and in the embryo. It has a very important role, regulating Nanog expression, and when depleted, causes downregulation of Nanog and upregulation of TE and PE specific genes (Ito et al., 2010). While Tet1 is predominantly found in the promoter regions and transcription start sites of its target genes, Tet2 is mainly associated with gene bodies of highly expressed genes in mESCs (Huang et al., 2014). Unlike Tet1 and Tet2, Tet3 main role in early development is the epigenetic reprogramming of the zygotic paternal DNA following fertilization, and in the activation of zygotic Oct4 expression (Gu et al., 2011).
Figure 1.9 – Cytosine Methylation and Demethylation Cycle. Cytosines are methylated at the 5-carbon of the cytosine by DNMTs, resulting in 5mC. 5mC is then oxidized by TETs through a series of reactions, until 5caC, which will be excised by TDG to restore the initial unmodified cytosine (adapted from Nightingale, 2006).
13 Besides a role in transcriptional activation, through CpG demethylation, Tet1 can also contribute to the repression of genes, mediating the recruitment of PRC2 to CpG-rich promoters, enriched in 5hmC. In Tet1 mutants, 5mC in maintained and recruitment of PRC2 to these promoters is impaired (Wu et al., 2011).
1.4.2 Chromatin Modifications
Besides the roles of DNA methylation in transcriptional regulation of gene expression, chromatin modifications are also important regulators of gene expression.
The chromatin basic unity is the nucleosome. It is composed of 147 base pairs of DNA wrapped around an octamer of histones, composed of two of each histone H2A, H2B, H3 and H4 (Luger et al., 1997). The nucleosome is initially formed by standard histones, which can later have their N-terminal tails modified. The possible modifications are acetylation of lysine residues, methylation of lysines and arginines, phosphorylation of serines and threonines, ubiquitylation of lysines, sumoylation of lysines, ADP ribosylation of glutamic acid, and isomerization of prolines, which are catalysed by different enzymes/complexes (reviewed in Kouzarides 2007).
These modifications affect the accessibility of the DNA to other proteins (non-histones), increasing or decreasing it. Trimethylation of lysine 4 and acetylation of lysines 9 and 14 in H3 histone (H3K4me3, H3K9ac and H3K14ac, respectively) are characteristic of active promoters (Bernstein et al., 2002; Liang et al., 2004) and H3 lysine 36 trimethylation (H3K36me3) is enriched throughout bodies of transcribed genes (Bannister et al., 2005). While these modifications are present in regions of more open chromatin, trimethylation of lysines 9 and 27 of H3 histone (H3K9me3 and H3K27me3, respectively) are associated with more compact and silenced chromatin (Lachner et al., 2001; Cao et al., 2002).
ESCs are enriched in H3K4me3, H3K9ac, H3K14ac, H3K36me2, and H3K36me3, consistent with an open chromatin conformation and a high level of transcription (Efroni et al., 2008). During differentiation, open chromatin and its characteristic modifications are substituted by closed chromatin and repressive modifications, as H3K9 methylation (Wen et al., 2009)
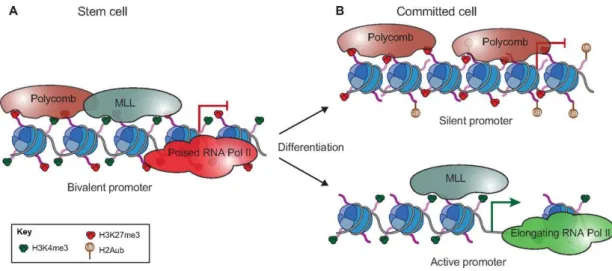
Another characteristic of ESCs is the overlap of opposite chromatin modifications, H3K4me3 and H3K27me3, in the same genes (Figure 1.10). This very specific occurrence is known as bivalent chromatin and is mainly found in genes encoding developmental regulators, characterized by low expression levels in both mESCs and hESCs (human ESCs; Azuara et al., 2006; Bernstein et al., 2006; Pan et al., 2007; Zhao et al., 2007). This bivalent state maintains these genes in a poised state, being easily activated or repressed when needed. During differentiation into specific lineages, some bivalent genes will increase expression following loss of the repressive modification, H3K27me3, and maintenance of the positive modification, H3K4me3. If a bivalent marked gene is not necessary to the chosen differentiation path, the positive modification H3K4me3 is lost, being followed by enrichment in H3K9me3 (Figure 1.10; Bernstein et al., 2006; Meshorer et al., 2006).
The repressive modification, H3K27me3, is catalysed by the polycomb repressive complex 2 (PRC2; Cao et al., 2002). PRC2 is a chromatin-modifying complex comprising four main components: Ezh1/2, Suz12, Eed and RbAp46/48 (also known as RBBP7/4). Ezh2, a histone-lysine N-methyltransferase, is responsible for the methylation of H3K27 (reviewed in Margueron and Reinberg, 2011).
14
Figure 1.10 – Role of Bivalent Chromatin in Developmentally Relevant Genes. (A) Bivalent promoters are characterized by the existence of repressive (H3K27me3) and activation (H3K4me3) marks, deposited by Polycomb and MLL complexes, respectively. During differentiation (B), if the gene is not necessary, it is silenced, losing H3K4me3 and gaining other repressive marks. In necessary genes, H3K27me3 is lost, H3K4me3 is increased, and the previously poised RNA Polymerase II transcribes the gene (Aloia et al., 2013).
After implantation, the epiblast needs to be maintained in an undifferentiated pluripotent state. The maintenance of the pluripotent state and repression of differentiation is dependent of PRC2 activity, as it has been shown that depletion of Eed, Ezh2 and Suz12 result in lethality in early post-implantation stages, with embryos displaying severe developmental and proliferative defects (Faust et al., 1995; O’Carroll et al., 2001; Pasini et al., 2004).
The activation mark H3K4me3 is catalysed by MLL-family histone methyltransferases (HMTs), which include 4 different proteins in mammals (MLL1-4), together with three structural components RbBP5, Ash2L and WDR5. Mll1 and Mll2 are the methyltransferases essential for embryonic development (Dou et al., 2006; Denissov et al., 2014). In ESCs, WDR5 is regulated by Nanog and Oct4, being necessary for the maintenance of pluripotency, inducing differentiation and reducing self-renewal when depleted (Ang et al., 2011).
1.5
Nanog as a Key Regulator of Priming Gene Expression
Pluripotent mESCs are highly heterogeneous in the expression of some TFs. Based on Nanog heterogeneous expression, two separated populations of cells can be defined, Low-Nanog and High-Nanog. In High-Nanog cells, the pluripotency network is fully active, maintaining cells in a naïve state of pluripotency, irresponsive to differentiation signals. The opposite happens in the Low-Nanog state, which remains pluripotent due to expression of Oct4 and Sox2, but also expresses lineage-affiliated (or priming) genes (Chambers et al., 2007; Abranches et al., 2013; Abranches et al., 2014).
This observation led to the hypothesis that Nanog might be a regulator of these priming genes. Thus, in the High-Nanog state, Nanog should be actively repressing the expression of the priming genes, whereas in the Low-Nanog state its absence allows their expression (Abranches et al., 2014).
Being a transcription factor, Nanog binds to its targets and recruits the transcription machinery. Nanog has been shown to interact with Tet1, recruiting it to the promoters of pluripotency associated genes like Oct4, during reprogramming. In mESCs, Nanog and Tet1 bind to the promoters of genes associated with
15 maintenance of pluripotency and lineage commitment, with Nanog stabilizing Tet1 binding (Costa et al., 2013).
The genes associated with lineage commitment are also associated with bivalent chromatin, being repressed by histone methylation through PRC2. PRC2 modifies histones in specific regions and has previously been shown to bind 5hmC-enriched promoters (Wu et al., 2011).
Therefore, we hypothesize that Nanog might repress the expression of priming genes through recruitment of Tet1, which converts 5mC into 5hmC. PRC2 recognizes these 5hmC-rich regions and catalyses the deposition of H3K27me3, ensuring the repression of these genes (Figure 1.11).
Previous laboratory work led to the identification, by RNA-Seq, of genes upregulated and downregulated in Low- and High-Nanog states (unpublished data). A chromatin enrichment analysis, performed in Enrichr (Chen et al., 2013; Kuleshov et al., 2016), showedthat the genes upregulated in the High-Nanog state are associated with proteins involved in the pluripotency network, whereas priming genes (upregulated in the Low-Nanog state) are mainly associated with members of PRC2 (unpublished data).
Some of the priming genes detected by RNA-seq have already been analysed by similar methods to those here employed, and the preliminary results showed that some might be regulated by our proposed model (like Sox3), while others do not (Car2; unpublished results).
Figure 1.11 – Nanog Role in Priming Genes Regulation. mESCs can be in High-Nanog or Low-Nanog states. In High-Nanog state, Nanog is repressing the expression of priming genes through Tet1 and PRC2. In Low-Nanog mESCs, the absence of Nanog allows the expression of priming genes and mESCs can explore the possible differentiation pathways. The opposite should happen in High-Nanog mESCs, where Nanog recruits Tet1 to the regulatory regions of priming genes; where Tet1 will catalyse the conversion of 5mC into 5hmC. PRC2 will recognize these hypomethylated regions and trimethylate H3K27, ensuring the repression of the priming genes. Transition from High-Nanog to Low-Nanog implies H3K27 demethylation around these genes, whereas the opposite transition requires methylation.
16
2. Aims
Since the discovery of ESCs, abundant research has been done to understand the mechanisms of how these cells reach and maintain their pluripotent state. Besides knowledge-driven research, much of it was motivated by all the potential medical applications. Stem cells can differentiate into every somatic cell found in an adult organism, opening doors to stem cell-based therapies in regenerative medicine. ESCs are derived in culture from pluripotent cells of blastocyst epiblasts, although presenting some epigenetic modifications that allow them to stay in this state, indefinitely. It is not yet clear if the heterogeneity and fluctuations of Nanog expression have a functional role in lineage priming in mESCs and mouse embryonic development. So far, most of the experiments were performed in populations of mESCs, masking heterogeneity and lineage-priming. It is therefore essential to study these processes at the single cell level. Until now, several techniques have been developed to study gene expression in single cells, including reverse transcription quantitative polymerase chain reaction (RT-qPCR), RNA-sequencing (RNA-seq) and single molecule RNA fluorescent in situ hybridization (smRNA-FISH), among others, with smRNA-FISH being the only highly quantitative method to study gene expression (reviewed in Kanter and Kalisky, 2015).
Here, we use smRNA-FISH, which allows the quantification of the exact number of mRNA molecules existent in a cell (Raj et al., 2008), to study the role of Nanog heterogeneity and dynamics on priming gene expression.
To test our hypothesis of priming gene regulation by Nanog, via recruitment of Tet1 and PRC2, small molecule modulators of Tet1 and PRC2 activities will be used. PRC2 activity can be inhibited by the GSK343 compound (Verma et al., 2012), while Tet1 activity can be stimulated with ascorbic acid (AA, also known as Vitamin C; Blaschke et al., 2013; Yin et al, 2013). The effects of these treatments were assessed by quantification of the exact number of various mRNA transcripts in single cells, through smRNA-FISH.
This project aims to:
1. Describe pluripotency and priming gene transcriptional heterogeneity at the single cell level, through quantification of mRNA transcripts in Serum/LIF conditions;
2. Demonstrate the higher frequency of lineage-priming in the Low-Nanog stage, correlating Nanog and priming-gene expression;
17
3. Materials and Methods
3.1. Materials
3.1.1 Cell Lines
Two mESC lines, E14tg2a (from now on called E14) and Nd (from Nanog dynamics), were used. Nd is a Nanog:VNP reporter cell line derived from E14, containing a BAC transgene with a short-lived fluorescent protein (VNP – Venus NLS Pest) under Nanog regulation, previously developed at the lab (Abranches et al., 2013).
3.1.2 Reagents
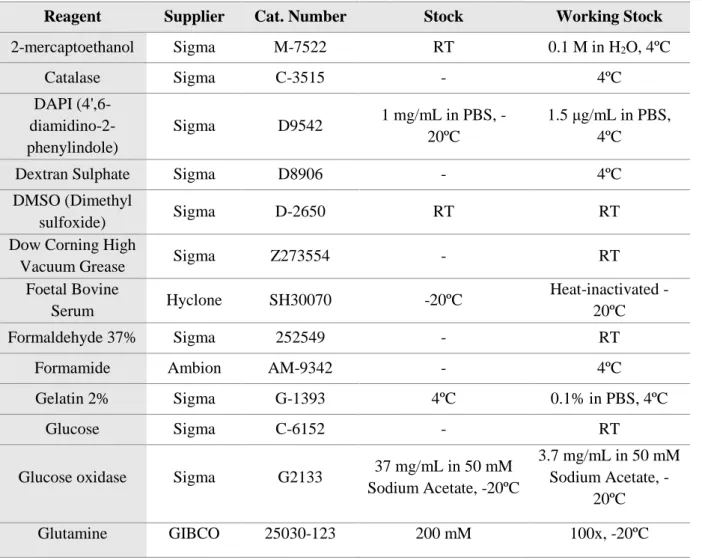
The reagents, solutions, smRNA-FISH probes and detection filters used throughout this project are listed in the following tables.
Table 3.1 – List of Reagents Used Throughout the Experiments. The reagents are listed with information relative to suppliers, catalogue numbers and stock/working solutions. RT- room temperature
Reagent Supplier Cat. Number Stock Working Stock
2-mercaptoethanol Sigma M-7522 RT 0.1 M in H2O, 4ºC Catalase Sigma C-3515 - 4ºC DAPI (4',6- diamidino-2-phenylindole) Sigma D9542 1 mg/mL in PBS, -20ºC 1.5 μg/mL in PBS, 4ºC
Dextran Sulphate Sigma D8906 - 4ºC
DMSO (Dimethyl
sulfoxide) Sigma D-2650 RT RT
Dow Corning High
Vacuum Grease Sigma Z273554 - RT
Foetal Bovine
Serum Hyclone SH30070 -20ºC
Heatinactivated -20ºC
Formaldehyde 37% Sigma 252549 - RT
Formamide Ambion AM-9342 - 4ºC
Gelatin 2% Sigma G-1393 4ºC 0.1% in PBS, 4ºC
Glucose Sigma C-6152 - RT
Glucose oxidase Sigma G2133 37 mg/mL in 50 mM
Sodium Acetate, -20ºC
3.7 mg/mL in 50 mM Sodium Acetate,
-20ºC
18
Table 3.1 – continuation.
Reagent Supplier Cat. Number Stock Working Stock
GMEM GIBCO 21710-025 - 1x, 4ºC
GSK343 Sigma SML0766 1mM in DMSO, -80ºC 1mM in DMSO, 4ºC
Ascorbic Acid (AA; L-Ascorbic Acid2-phosphate)
Sigma A8960 50mg/mL in sterile
H2O, 4ºC 50mg/mL in sterile H2O, 4ºC Non-essential aminoacids GIBCO 11140-035 - 100x, 4ºC PenStrep GIBCO 15140-122 - 100x, -20ºC
Propidium Iodide Invitrogen P-3566 1 mg/mL, 4ºC 1 ng/mL, 4ºC
Sodium Pyruvate GIBCO 11360-039 - 100x, -20ºC
Triton Sigma T8787 - RT
Trypan blue Sigma T8154 RT 0.4% in PBS, RT
Trypsin GIBCO 25090-028 2.5% (v/v), -20ºC 0.25% in PBS, 4ºC
Table 3.2 – List of Solutions Used Throughout the Experiments. The solutions used are listed with their components and storage conditions. RT – room temperature
Solutions Components Storage
Anti-fade buffer 100 uL Glox buffer buffer; 1uL catalase; 1uL
3.7mg/mL glucose oxidade (prepare fresh) RT
EtOH 70% 35mL 95% EtOH; 15 mL miliQ H2O RT
Gelatin 0.1% 2.5mL 2% gelatin; PBS up to 50mL 4ºC
Glox buffer 850uL H2O; 100uL 20x SSC; 40uL 10% glucose;
10uL Tris 1M PH8; 10uL 10%Triton (prepare fresh) RT
Glucose 10% 1.5g glucose; H2O up to 15mL RT
GMEM 1x
80% (v/v) GMEM; 1% (v/v) Glutamine; 1% (v/v) Pen-Strep; 1% (v/v) Sodium Pyruvate; 1% (v/v)
Non-essential Aminoacids; 10% (v/v) FBS; 0,001% (v/v) of 2-mercaptoethanol
4ºC
Hybridization buffer 1g dextran sulfate; 7mL miliQ H2O; 1mL formamide; 1mL 20x SSC; miliQ H2O up to 10mL (store at -20ºC)
-20ºC SSC 20x 87.65g 3M NaCl; 44.11g 0.3M Sodium citrate; miliQ
H2O up to 500mL
RT
TE 10mM Tris; 1mM EDTA pH=8; RT
Triton 10% 1mL Triton X-100; PBS up to 10mL RT
Trypsin 0.01% 5mL 0.25% Trypsin; PBS up to 50mL 4ºC
Wash buffer 5mL 20x SSC; 5mL formamide; 500uL 10% Triton; 40mL miliQ H2O
19
Table 3.3 – List of Probes Used for mRNA Detection in smRNA-FISH experiments. Probe list for each target gene and their correspondent fluorophores. For each target gene, 25 to 45 unique oligonucleotides (20 nucleotides) probes were previously designed and dissolved in TE, at a concentration of 1 to 12μM. Each probe is labelled with a fluorophore: alexa594, cy5 or tmr.
Gene Oligo Sequences
Car2 (alexa595)
gtgacaggcagaggtgacag, aggggaggagaccgtggag, tgattggggcagagcagaag, ctccattggcaatggggaag, tgctgtgtcaatgtccacag, gatatgagcagaggctgtag, gttgacaatgctcttggacg, tcaacgttaaaggagtggcc, attgtcctgagagtcatcaa, atctgtaggagtcactgagg, ccccagtgaaagtgaaactg, gttccagtgaaccaagtgaa, caaaacagccaatccatccg, gaagttagcaaaggccgcac, caggaagaagggagcaagga, tatgtccagtagtccaagtt, acgatccaggtcacacattc, ctcgctgctgacagtaatgg, cattgaagttcagcgtacgg, ctattctttagcggctgagc, cttaaaggacgctttgatct, ttagctacagagaggcggtc, caaatcacccagcctaactg, acaataccagatgcgagtcg, agcacaacggatgagaggta, gtctcatgatgtggacttgt, tttgcctaagttacttcagt, atccattgtgttgtggtatg
Crabp2 (tmr)
ccagagctctaggcttttat, ccagagctctaggcttttat, cctttgcagaacagatcctt, ggctaaagatactttgctgt, ttcaactagaacactggacg, gcaaggtggctttctcttta, ttgccagaaaagttaggcat, agttttccgatcggatgatc, tctcctgtttgatctcgact, aagttaatctccgtggttcg, caccaaactcttacagggtc, attggtcagttctcggctcc, ttgtcaggatcagctctcca, tagaccctggtgcacacaac, cgtaggcactcactctcgga, gaagtcgtctcaggcagttc, tttgtgtcctgtagcgggca, agtaaccctcaggagtaagg, gagggttctgagcttctgcc, ttccaggaaggaccctggtg, tagaggccagagagacagtc, aatcacacagactacaagga
Dnmt3b (tmr)
Attcagatgtctgctgtctc, ataatgcactcctcataccc, ggtcactgaagttcccatta, taattcagaaggctggagac, atcatctctgtctccatctc, agccattcccatcatctact, ggtgagctttggcattagaa, ttgctgaagatgatgctcga, acttcttccatgaagtcgac, aagtcaactgatggggtact, tatccataccctcctgatct, atactctgtgctgtctccat, ggtcacctattccaaactct, aggagaagcccttgatcttt, aacttgccatcaccaaacca, tttgtcagcagagatctcag, ttaaagtgctggctgaacag, cagcttattgaaggtagcca, gtacatggccttcctataag, tgcttcttgttgggtttgag, gcaccttcgacttattaacc, aagttcctactgtctgaacg, ttcgacttttgttctcgcgt, aagcagcagagtcattggtt, tatttgtcttgaggcgcttg, ttggtgacttcagaagccat, aaacagcggtcttccagatt, acagggttcttctttccaca, tgtagaagagctctaggaag, tgatagccgtcctcatcata, atctgcagcagcttgtgtta, tgttccaatctttcctgcgt, tagtgaagaagtcttgcagg, aattcttccaggtcaggatc, aattgctgggtacaacttgg, actctaatgggcctcctttt, ccgttgcaattccatcaaac, aactccttgagcaccaagta, gaggcaatgtacttttccac, ttaacagttcccacagcgat, ccggacgtcattgacatatt, ggccccactcttcaatattt, agagatcattgcatgggctt, atataaacctttgcgggcag, aaactcgaagaagagccttc, gggtataattcagcaagtgg, atccagaagaatggacggtt, ttcatggccacaacattctc
Fgf5 (alexa594,
tmr)
caagcgctgtggatcaggtg, cttcgggagtgagacgcttc, gagtctcccgggttcctagg, aagaaaacgtcgcgctactt, ctatgttccgagccgcttcc, cgaagggctccactggaaac, ccactctgcagtacaggctg, tagatctgcagatggaaacc, agccattgactttgccatcc, cttaacacactggcttcgtg, ttcctacaatcccctgagac, ttgttgctgaaaactcctcg, agtcatccgtaaatttggca, tcttggaatctctccctgaa, gcggacgcataggtattata, cgtaccactctcggcctgtc, gagacgtgttggggtttgac, cttgaacctgggtaggaagt, gtgaaggaaagttccggttg, cacctttggtttcaccggtg, tcagtctgtacttcactggg, gagcatcatccaaagcgaaa, tgacgcctgtatagagagtt, gctgtatccgagtttccttc, aaatgacctgacttccacac, tagttccagtcaaagcgaaa, cccacttctgtttcgactta, ctccctggatcgctacagag, atcctcggtgatctgaagag, cctcaaatcacgaagccttt, gaaaacgcagaatgctaacc, gttccaggctatcaaactgg
Nanog (alexa594,
cy5, tmr)
aaatcagcctatctgaaggc, cagaaagagcaagacaccaa, gaagtcagaaggaagtgagc, actcagtgtctagaaggaaa, ggttttaggcaacaaccaaa, cgagggaagggatttctgaa, cacactcatgtcagtgtgat, cagaactaggcaaactgtgg, ttcccagaattcgatgcttc, aaaaactgcaggcattgatg, agcaagaatagttctcggga, cagagcatctcagtagcaga, gaagaggcaggtcttcagag, tgggactggtagaagaatca, tcaggacttgagagcttttg, cttgttctcctcctcctcag, gagaacacagtccgcatctt, ctgtccttgagtgcacacag, tgaggtacttctgcttctga, gagagttcttgcatctgctg, atagctcaggttcagaatgg, gaaaccaggtcttaacctgc, ttgcacttcatcctttggtt, tcaaccactggtttttctgc, ttctgaatcagaccattgct, gatactccactggtgctgag, ggatagctgcaatggatgct, cagatgcgttcaccagatag, aagttgggttggtccaagtc, gtctggttgttccaagttgg, aaagtcctccccgaagttat, ctgcaactgtacgtaaggct, caaatcactggcagagaagt, tagtggcttccaaattcacc, ctaaaatgcgcatggctttc, ataattccaaggcttgtggg, tggagtcacagagtagttca, agatgttgcgtaagtctcat, gctttgccctgactttaagc, tttggaagaaggaaggaacc, caaatcactggcagagaagt, tagtggcttccaaattcacc, ctaaaatgcgcatggctttc, ataattccaaggcttgtggg, tggagtcacagagtagttca, agatgttgcgtaagtctcat, gctttgccctgactttaagc, tttggaagaaggaaggaacc