DOI: ISSN: 2318-4531 Abstract—The paper presents a pilot plant built to
demonstrate the principles of process control using the Foundation Fieldbus (FF) technology. Some theoretical background is given by explaining the logical layers of the technology, namely the physical layer, the communication stack and the user layer. Practical aspects, like the configuration of instruments, the design of a control strategy and the development of supervision software, are also covered by means of an application example. The example runs on the pilot plant making use of pressure, level and flow control loops, quantities widely found in the process industry. Experimental results are extracted and analyzed in order to evaluate the overall performance of the system.
Index Terms—Foundation Fieldbus, fieldbus control systems, process control, engineering education, pilot plant
I. INTRODUCTION
HE Foundation Fieldbus (FF) [1-3] is a communication technology intended to connect instruments on the factory floor. It provides reliable real-time communications that allow the implementation of distributed control loops on physical processes.
As shown in figure 1, the FF technology distinguishes between low-speed communications (H1 level) and high-speed communications (H2 level). The H1 level acts as a digital replacement for 4-20 mA current loops widely used in industrial plants. The H2 level aggregates data from H1 segments and adds support for discrete control. Together, the H1 and H2 levels satisfy the automation needs of most Vítor Viegas is with the LabIM/ DSI/ ESTSetúbal/ Instituto Politécnico de Setúbal, 2910-761 Setúbal, Portugal, and with the Instituto de
Telecomunicações, 1049-001 Lisboa, Portugal
J. M. Dias Pereira is with the LabIM/ DSI/ ESTSetúbal/ Instituto Politécnico de Setúbal, 2910-761 Setúbal, Portugal, and with the Instituto de
Telecomunicações, 1049-001 Lisboa, Portugal
systems, whether they are continuous or discrete.
The FF technology is supervised by the Fieldbus Foundation [4], a non-profit consortium composed by end-users, manufacturers and research organizations. The foundation promotes and regulates the use of the technology while provides guidelines for the future. The regulation work includes rigorous certification programs that guarantee interoperability between equipment from different manufacturers. The goal is to give end-users the ability to choose the best hardware and software at any time without being stuck to a specific vendor.
H1 level Field instruments Linking device (LD) Host + Configuration tools Terminator Discrete IO H2 level T ... ... FCV2 FT TT LT FCV1 Fig. 1. FF overview. A. H1 Level
The H1 level is a digital bus that implements a subset of the OSI (Open Systems Interconnection) model. The physical layer is fully implemented, while layers 2 to 7 are compressed in the so-called “communication stack”. The user layer (extra OSI) defines a library of functional blocks intended to build control applications. These three components (physical layer, communication stack and functional blocks) must all reside in
Educational Foundation Fieldbus Pilot Plant
Vítor Viegas, J. M. Dias Pereira
____________________________________________________________________________
DOI: ISSN: 2318-4531 every FF instrument.
The physical layer conforms to the IEC 61158-2 standard [5] as follows: twisted pair, 31.25 kbit/s, power over bus (24 VDC), 32 devices per segment (maximum), 7600 m per segment (using up to 4 repeaters and depending on signal-to-noise ratio), free topology.
The communication stack implements a master-slave protocol that guarantees message delivery in real-time. The master is called “Link Active Scheduler” (LAS) because it distributes permissions to talk – also known as “tokens” – according a deterministic schedule. When a device receives the token, it publishes messages on the bus that are picked up and consumed by one or more subscribers. The LAS supports the following transactions:
Programmed communications: Periodically, according a programmed control strategy, the LAS sends tokens of type CD (Compel Data). The device owning the CD token publishes data immediately without waiting for the subscriber(s) to confirm the reception. If data is lost, the system relies on the previous value until a new one is transmitted. This transaction is used to transfer variables and status information between functional blocks.
Non-programmed communications: After executing the control strategy, the LAS reserves some time to send tokens of type PT (Pass Token). The device owning the PT token has a limited amount time to send messages by its own initiative. All messages have to be confirmed otherwise are repeated. This transaction is used to report events and to perform configuration tasks (such as setpoint adjustments, program downloading and remote diagnostics).
Live list: The LAS scans for active devices by sending tokens of type PN (Probe Node) to all possible addresses (sequentially from 0 to 255). The target device responds by returning its unique IDentifier (ID) and tag. If a new device is found, it is added to the live list; if a device fails to respond three consecutive times, it is removed from the list.
Time distribution: The LAS synchronizes the bus by broadcasting tokens of type TD (Time Distribution). Each H1 bus has one primary master. Other devices can be configured as redundant masters provided they have LAS capabilities. The master with lowest address takes control automatically.
The programming interface of FF devices is based on functional blocks. Each device contains:
One Resource Block (RB) that describes the general characteristics of the device (ID, tag, manufacturer, model, serial number, etc.).
One or more Transducer Blocks (TB) that describe the characteristics of the attached transducers (transducer type, connection, compensation, calibration data, etc.). One or more Function Blocks (FB) that implement data processing algorithms. There are dozens of predefined FBs covering the most common functionalities (AI – Analog Input, AO – Analog Output, PID – Proportional Integral Derivative
controller, ARTH – ARiTHmetic, SG – Setpoint Generator, LLAG – Lead Lag, DENS – Density, LCF – Liquid Correction Factors, etc.).
LD AI PID AO SP T
...
PV SP: SetPoint PV: Process VariableFig. 2. Flow control loop (instruments and FB diagram).
The control strategy is defined by a FB diagram like the one shown in figure 2. The arrows establish data relations between FBs: if two interdependent FBs reside on the same device, data is transferred internally; if they reside in different devices, data is transferred across the bus. By dissecting the diagram it is possible to know who talks to whom and when; in other words, it is possible to schedule programmed communications.
The use of predefined FBs promotes interoperability because devices can be replaced while the program maintains the same structure.
B. H2 Level
The H2 level aggregates data from the field, including H1 segments, Programmable Logic Controllers (PLC) and sensor buses. Over the last years there has been an effort to apply internet technologies at this level: Ethernet for data transmission, Internet Protocol (IP) for data routing, and Transport Control Protocol (TCP) and User Datagram Protocol (UDP) for data transport. This approach provides high baud rates (100 Mbit/s typical) and allows the use of inexpensive, off-the-shelf equipment. In return, it does not provide native support for real-time, power over bus or redundancy.
Each H1 segment is connected through a gateway called “Linking Device” (LD), which, most of the times, acts as the primary master and provides support for discrete control. When the host needs to access a particular H1 device, it sends TCP messages to the corresponding linking device which translates them into H1 communications. The reverse happens when the H1 device reports data to the host. UDP messages are used when the host needs to contact several linking devices simultaneously (to distribute time, for example). The process of translation is absolutely transparent so that configuration tools (residing on the host) can configure, diagnose and monitor H1 devices as if they were locally connected.
DOI: ISSN: 2318-4531 II. PHYSICAL PROCESS
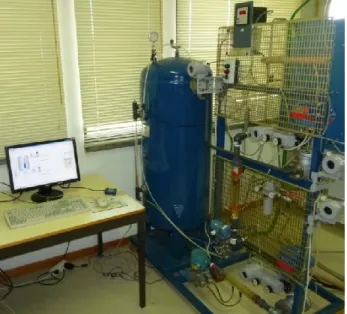
The physical process was built to train students in the principles of process control and FF instrumentation. The process contains all the equipment needed to run the following control loops (see figures 3 and 4):
Level control loop: The water level inside the closed tank is measured by the transmitter LT1 and is controlled by operating the control valve FCV1. Information about water inflow and air pressure at the top of the tank is provided by transmitters FT1 and PT1, respectively. The tank is equipped with an exhaust valve to prevent pressures above 3 bar.
Flow control loop: The flow of water leaving the tank is measured by the transmitter FT2 and is controlled by operating the control valve FCV2.
FF instruments were tied into a single H1 segment terminated by a 100 Ω resistor in series with a 100 nF capacitor. The H1 bus was connected directly to a computer (overcoming the H2 level) using an interface board that acts as linking device (model USB-8486 from National Instruments [6]). Finally, on the computer, it was installed the software needed to configure and supervise the pilot plant, namely NI-FBUS Configurator 4.0.1 [7], LabVIEW 2009 SP1 [8] and the Datalogging and Supervisory Control (DSC) module [9].
III. CONFIGURATION OF FFINSTRUMENTS
The configuration of FF instruments is very challenging because it requires a deep understanding of the process, as well as expertise to deal with the multitude of options offered by functional blocks. The configuration was done online
BJICBJhaving all FF instruments powered up and remotely visible. This requires patience (because the H1 bus is slow) but enables incremental error fixing. The work was done instrument by instrument walking through the following steps: 1. The instrument was reset to its factory defaults.
2. A unique address from 17 to 247 (in the range of permanent devices) was assigned to the instrument (address 16 is reserved by the interface board).
3. One or more FBs were instantiated to provide processing power for the instrument (according the needs of the control strategy).
4. Unique tags were assigned to the instrument and its TABLEI
FIELD INSTRUMENTS
Tag Manufacturer Reference Range Signal Brief description
FT1 Gebr. Muller 1270 + 1275 (a) GEMU 830 + 5 to 50 l/min 4 to 20 mA Variable area flowmeter.
LT1 Rosemount D2A12A2S1B4 0 to 100% (b) 4 to 20 mA Differential pressure transmitter.
FT2 Fischer Porter F50DPF110-3 0 to 47.7 l/min 4 to 20 mA Differential pressure transmitter coupled to a Venturi tube.
PT1 Smar LD302 0 to 25400 mmH2O (c) FF Pressure transmitter.
IF1 Smar IF302 4 to 20 mA FF Triple channel current/FF converter.
FCV1 Sart von Rohr Smar + MA821E63SP0 (d) FY302 + 0 to 100% FF Fieldbus positioner coupled to a pneumatic valve.
FCV2 Smar +
Sart von Rohr
FY302 +
MA821E63SP0 0 to 100% FF Fieldbus positioner coupled to a pneumatic valve.
Notes:
a) GEMU 830 refers to the variable area flowmeter, GEMU 1270 refers to the displacement/voltage converter, and GEMU 1275 refers to the voltage/current converter with local indicator. b) The range in meters depends on the dimensions of the tank.
c) Gauge pressure.
d) FY302 refers to positioner from Smar, and MA821E63SP0 refers to the pneumatic valve from Sart von Rohr.
Fig. 3. Physical process (photo).
LT1 FT2 AI AO IF1-2 PID PV SP AI AO IF1-3 PID FCV2 PV FT1 AI IF1-1 Outgoing water Incoming water (pressure < 3 bar) Closed tank 240 liters FCV1 SG Flow control loop
Level control loop
SP AI PT1 SG Start/ Pause/ Reset
DOI: ISSN: 2318-4531 functional blocks.
5. Each functional block was configured as described in table 2. For this purpose it was important to study each parameter in detail [10], as well as the operation manuals of the instruments [11-13].
The interface board was configured as the primary master by resetting all its parameters to the default values. No other (redundant) masters were implemented.
Having configured the H1 bus, it was time to build a control application for the plant. The application, shown in figure 5, is composed by two main sections:
1. The top section implements the level control loop. This loop is closed by a PID controller that receives the process variable from the level transmitter LT1 (via channel 2 of the converter IF1), and writes the output variable to the positioner of the control valve FCV1. The AO, PID and SG function blocks are cascaded to increase loop consistency: if a function block breaks the loop (by passing to Manual mode, for example), the upstream blocks freeze their operation; if the loop is restored, the upstream blocks resume automatically.
2. The bottom section is similar to the top one, with the difference that it applies to the flow control loop. The process variable comes from the flow transmitter FT2 (via channel 3 of converter IF1), and the output variable goes to the positioner of the control valve FCV2.
3. Two function generators supply the setpoints of the control loops. The waveforms are pre-defined but the operator has the chance to start/pause/reset both generators synchronously.
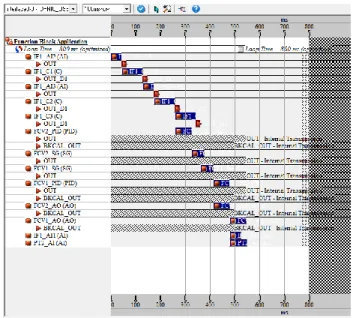
Figure 6 shows the schedule associated to the control application. The configurator gives time for instruments to do internal processing (blue bars), as well as to exchange data across the H1 bus (red bars). The control loops run with a sampling period of 800 ms.
Fig. 5. Control application.
Fig. 6. Schedule of the control application.
IV. SUPERVISION APPLICATION
The supervision application allows the pilot plant to be operated by people without expertise on the FF technology. It provides a graphical environment where the operator can monitor the system without worrying about configuration details and low level communications.
The supervision application was written in LabVIEW using the facilities provided by the DSC module. The application interacts with the FF infrastructure using the OPC-DA (Open Process Control Data Access) [14-15] server that comes with the NI-FBUS Configurator. The development went through the following stages:
1. An OPC client was created and connected to the OPC-DA server. The server exposes data items representing the parameters of functional blocks.
2. The data items of interest (those related with setpoints, process variables and output variables) were bound to shared variables created expressly for that purpose. 3. Each shared variable was configured in terms of data
type, access type (read only or read & write), alarming (HiHi, Hi, Lo and LoLo), data logging and security (remote access permissions).
4. A virtual instrument was built to provide a rich graphical interface for the operator (see figure 7). The controls and indicators were bound to the shared variables in order to synchronize the front panel with the system. The operator can monitor de system (by reading process variables and output variables) and send commands to the setpoint generators (start/pause/resume).
DOI: ISSN: 2318-4531 TABLEII
CONFIGURATION OF FFINSTRUMENTS
Current to FF converter IF1, address = 23 (a)
Block Category Parameter Value Comment
IF1_RB (Resource block) Process MODE_BLK.TARGET Auto Activates the block.
IF1_TB1 (Transducer Block) Process MODE_BLK.TARGET Auto Activates the block.
IF1_TB2 (Transducer Block) Process MODE_BLK.TARGET Auto Activates the block.
IF1_TB3 (Transducer Block) Process MODE_BLK.TARGET Auto Activates the block.
IF1_AI1 (Analog Input FB)
Scaling
XD_SCALE.EU_100 20
Transducer’s input range (4 to 20 mA).
XD_SCALE.EU_0 4
XD_SCALE.UNITS_INDEX mA
OUT_SCALE.EU_100 50
Output range (0 to 50 l/min). This range applies to the incoming water flow.
OUT_SCALE.EU_0 0
OUT_SCALE.UNITS_INDEX L/min
L_TYPE Indirect The input range is linearly converted to the output range.
Process CHANNEL 1 Links to the transducer block IF1_TB1.
MODE_BLK.TARGET Auto Activates the block.
IF1_AI2 (Analog Input FB)
Scaling
XD_SCALE.EU_100 20
Transducer’s input range (4 to 20 mA).
XD_SCALE.EU_0 4
XD_SCALE.UNITS_INDEX mA
OUT_SCALE.EU_100 100
Output range (0 to 100%). This range applies to the water level inside the tank.
OUT_SCALE.EU_0 0
OUT_SCALE.UNITS_INDEX %
L_TYPE Indirect The input range is linearly converted to the output range.
Process CHANNEL 2 Links to the transducer block IF1_TB2.
MODE_BLK.TARGET Auto Activates the block.
IF1_AI3 (Analog Input FB)
Scaling
XD_SCALE.EU_100 20
Transducer’s input range (4 to 20 mA).
XD_SCALE.EU_0 4
XD_SCALE.UNITS_INDEX mA
OUT_SCALE.EU_100 47.7
Output range (0 to 47.7 l/min). This range applies to the outgoing water flow.
OUT_SCALE.EU_0 0
OUT_SCALE.UNITS_INDEX L/min
L_TYPE Indirect Sq Root The input range is converted to the output range by applying the square root
operation. Useful for flow meters based on differential pressure.
Process CHANNEL 3 Links to the transducer block IF1_TB3.
MODE_BLK.TARGET Auto Activates the block.
IF1_C1 (Constant FB)
Others CT_VAL_D1 0 or 1 Value of the discrete output D1. This constant starts the setpoint generators on a rising edge.
Process MODE_BLK.TARGET Auto Activates the block.
IF1_C2 (Constant FB)
Others CT_VAL_D1 0 or 1 Pauses the setpoint generators (value = 1) or not (value = 0).
Process MODE_BLK.TARGET Auto Activates the block.
IF1_C3 (Constant FB)
Others CT_VAL_D1 0 or 1 Resets the setpoint generators on a rising edge.
Process MODE_BLK.TARGET Auto Activates the block.
Control valve FCV1, address = 25 (a)
Block Category Parameter Value Comment
FCV1_RB (Resource Block) Process MODE_BLK.TARGET Auto Activates the block.
FCV1_TB (Transducer Block) Process MODE_BLK.TARGET Auto Activates the block.
FCV1_SG (Setpoint Generator FB)
Others
START_VAL {30, 30, 60, 60, 60, 60, 30, 30, 30, 30, 0} Arrays that define the value and duration of each segment of the
setpoint profile.
DURATION {60, 2, 150, 2, 150, 2, 150, 2, 60, 0}
TIME_UNITS Seconds Timer units.
AUTO_CYCLE Auto cycle Automatically resets the timer and restarts the profile.
Process MODE_BLK.TARGET Auto Activates the block.
FCV1_PID (PID FB)
Scaling
PV_SCALE.EU_100 100
Range of the Process Variable (PV) (0 to 100%). In the present case, the PV is the water level inside the tank.
PV_SCALE.EU_0 0
PV_SCALE.UNITS_INDEX %
OUT_SCALE.EU_100 100
Range of the Output Variable (OV) (0 to 100%). In the present case, the OV is the valve opening.
OUT_SCALE.EU_0 0
OUT_SCALE.UNITS_INDEX %
Tuning
GAIN 6 Proportional gain (Kp) of the PID controller.
RESET 4 Sec Reset time (Ti) of the PID controller.
RATE 8 Sec Derivative time (Td) of the PID controller.
Options STATUS_OPTS IFS if bad IN If the block input goes bad (due to a communications failure, for example), initiate fault state in the cascaded block.
Process
SP.VALUE xxx Level setpoint.
MODE_BLK.TARGET Cascade The controller follows the setpoint given by the setpoint generator
DOI: ISSN: 2318-4531
Control valve FCV1, address = 25 (a)
Block Category Parameter Value Comment
FCV1_AO (Analog Output FB) Scaling PV_SCALE.EU_100 100 Input range (0 to 100%). PV_SCALE.EU_0 0 PV_SCALE.UNITS_INDEX % XD_SCALE.EU_100 100
Actuator’s output range (0 to 100%). The input range is linearly converted to the output range.
XD_SCALE.EU_0 0
XD_SCALE.UNITS_INDEX %
Options
IO_OPTS Fault state to value The fault state is activated if the block input has a status of BAD
for more than two seconds. If this happens, the valve is closed (value = 0) to guarantee safety.
FSTATE_TIME 2 Sec
FSTATE_VAL 0
Process
CHANNEL 1 Links to the transducer block FCV1_TB.
MODE_BLK.TARGET Cascade
The block follows the output given by the controller (block FCV1_PID). Meanwhile, it applies scaling and checks the fault state condition.
Control valve FCV2, address = 26 (a)
Block Category Parameter Value Comment
FCV2_RB (Resource Block) Process MODE_BLK.TARGET Auto Activates the block.
FCV2_TB (Transducer Block) Process MODE_BLK.TARGET Auto Activates the block.
FCV2_SG (Setpoint Generator FB)
Others
START_VAL {5, 5, 5, 5, 10, 10, 10, 10, 5, 5, 0} Arrays that define the value and duration of each segment of the
setpoint profile.
DURATION {60, 2, 150, 2, 150, 2, 150, 2, 60, 0}
TIME_UNITS Seconds Timer units.
AUTO_CYCLE Auto cycle Automatically resets the timer and restarts the profile.
Process MODE_BLK.TARGET Auto Activates the block.
FCV2_PID (PID FB)
Scaling
PV_SCALE.EU_100 47.7
Range of the Process Variable (PV) (0 to 47.7 l/min). In the present case, the PV is the outgoing water flow.
PV_SCALE.EU_0 0
PV_SCALE.UNITS_INDEX L/min
OUT_SCALE.EU_100 100
Range of the Output Variable (OV) (0 to 100%). In the present case, the OV is the valve opening.
OUT_SCALE.EU_0 0
OUT_SCALE.UNITS_INDEX %
Tuning
GAIN 0.5 Proportional gain (Kp) of the PID controller.
RESET 4 Sec Reset time (Ti) of the PID controller.
RATE 1 Sec Derivative time (Td) of the PID controller.
Options STATUS_OPTS IFS if bad IN If the block input goes bad (due to a communications failure, for example), initiate fault state in the cascaded block.
Process
SP.VALUE xxx Flow setpoint.
MODE_BLK.TARGET Cascade The controller follows the setpoint given by the setpoint generator (block FCV2_SG).
FCV2_AO (Analog Output FB) Scaling PV_SCALE.EU_100 100 Input range (0 to 100%). PV_SCALE.EU_0 0 PV_SCALE.UNITS_INDEX % XD_SCALE.EU_100 100
Actuator’s output range (0 to 100%). The input range is linearly converted to the output range.
XD_SCALE.EU_0 0
XD_SCALE.UNITS_INDEX %
Options
IO_OPTS Fault state to value The fault state is activated if the block input has a status of BAD
for more than two seconds. If this happens, the valve is closed (value = 0) to guarantee safety.
FSTATE_TIME 2 Sec
FSTATE_VAL 0
Process
CHANNEL 1 Links to the transducer block FCV2_TB.
MODE_BLK.TARGET Cascade The block follows the output given by the controller (block FCV2_PID). Meanwhile, it applies scaling and checks the fault
state condition. Pressure transmitter PT1, address = 21 (a)
Block Category Parameter Value Comment
PT1_RB (Resource Block) Process MODE_BLK.TARGET Auto Activates the block.
PT1_TB (Transducer Block) Process MODE_BLK.TARGET Auto Activates the block.
PT1_AI (Analog Input FB)
Scaling
XD_SCALE.EU_100 25400
Transducer’s input range (between 0 and 25400 mmH2O.
XD_SCALE.EU_0 0
XD_SCALE.UNITS_INDEX mmH2O (68ºF)
OUT_SCALE.EU_100 36.1263
Output range (between 0 and 36.1263 psig).
OUT_SCALE.EU_0 0
OUT_SCALE.UNITS_INDEX psig
L_TYPE Indirect The input range is linearly converted to the output range (in psig).
Process CHANNEL 1 Links to the transducer block PT1_TB.
MODE_BLK.TARGET Auto Activates the block.
Notes:
DOI: ISSN: 2318-4531 Fig. 7. Supervision application.
V. EXPERIMENTAL RESULTS
Both control loops were tested over their dynamic ranges. For each controller, the setpoint, the process variable and the output variable were remotely monitored and recorded. The experiments were carried out according the following methodology:
1. The PID controllers were tuned in advance using the trial and error method. The level controller was configured with proportional gain Kp = 6, reset time Ti = 4 s and derivative time Td = 8 s. The flow controller was configured with Kp = 0.5, Ti = 4 s and Td = 1 s.
2. The system was started with level and flow setpoints of 30% and 5 l/min, respectively. Time was given for all variables to stabilize.
3. Data recording was started at t = 0 min.
4. At t = 1 min the level setpoint was changed to 60%. 5. At t = 3.5 min the flow setpoint was changed to 10 l/min. 6. At t = 6 min the level setpoint returned to 30%.
7. At t = 8.5 min the flow setpoint returned to 5 l/min.
8. Data recording was stopped soon after t = 10 min.
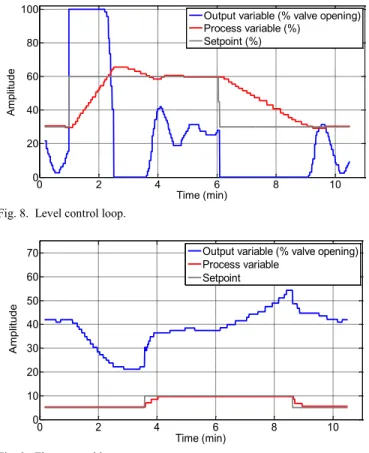
Regarding the level control loop (see figure 8), the collected data can be analyzed as follows:
At t = 1 min the controller opens valve FCV1 to increase the level. The response has some overshoot and stabilizes after 2 min (approximately).
At t = 6 min the controller closes valve FCV1 to decrease the level. The response has negligible overshoot and stabilizes almost immediately.
The level controller is insensitive to flow variations mainly due to the large capacity of the tank.
The level controller is characterized by good tracking
capability, small overshoot, short settling time and good immunity to external disturbances (in particular those related with flow variations).
With respect to the flow control loop (see figure 9), the comments are similar:
From t = 1 min to t = 3.5 min the controller gradually closes valve FCV2 to compensate the increase of level. From t = 6 min to t = 8.5 min the controller gradually
opens valve FCV2 to compensate the decrease of level. At t = 3.5 min the controller opens valve FCV2 to
increase the flow. The response has no overshoot and stabilizes after half a minute (approximately).
At t = 8.5 min the controller closes valve FCV2 to decrease the flow. The response has no overshoot and stabilizes after half a minute (approximately).
The flow controller is characterized by good tracking capability, no overshoot, short settling time and good immunity to external disturbances (in particular those related with level variations).
The supervision software has always worked as expected during the experiments.
VI. CONCLUSION
The main topics of the FF technology were covered, both theoretically and practically. The implementation of a pilot plant was explained, including the conception of the physical process, the configuration of field instruments, the design of the control strategy and the development of the supervision software. The plant was tested in order to evaluate the behavior of each control loop, including mutual interferences Fig. 8. Level control loop.
Fig. 9. Flow control loop.
0 2 4 6 8 10 0 20 40 60 80 100 Time (min) A m p litu d e
Output variable (% valve opening) Process variable (%) Setpoint (%) 0 2 4 6 8 10 0 10 20 30 40 50 60 70 A m p litu d e Time (min)
Output variable (% valve opening) Process variable
DOI: ISSN: 2318-4531 caused by setpoint changes. The plant worked as expected and
showed good performance even when large changes in setpoints occurred.
REFERENCES
[1] Foundation Technical Specifications, Fieldbus Foundation, 1994-1998. [2] David A. Glanzer, Foundation Fieldbus Technical Overview, Fieldbus
Foundation, 2003.
[3] Ian Verhappen, Augusto Pereira, Foundation Fieldbus, 4th ed, ISA - The International Society of Automation, 2012, ISBN 9781937560201. [4] Fieldbus Fundation, 2014, 01 Mar, [Online], Available:
www.fieldbus.org
[5] IEC 61158-2 Edition 5.0 – Industrial communication networks –
Fieldbus specifications – Part 2: Physical layer specification and service definition, International Electrotechnical Commission, ISBN
9782889120512.
[6] National Instruments, “1-Port FOUNDATION Fieldbus Interface for USB “, 2014, 01 Mar, [Online], Available: http://sine.ni.com/nips/cds/view/p/lang/pt/nid/207760
[7] National Instruments, “NI-FBUS Configurator”, 2014, 01 Mar, [Online], Available: http://sine.ni.com/nips/cds/view/p/lang/pt/nid/1323. National Instruments, “Labview”, 2014, 01 Mar, [Online], Available: www.ni.com/labview
[8] National Instrumens,” Módulo NI LabVIEW Datalogging and Supervisory (DSC) Control” , 2014, 01 Mar, [Online], Available: www.ni.com/labview/labviewdsc
[9] Function Blocks Instruction Manual, Smar, 2007.
[10] LD302 – Fieldbus Pressure Transmitter – Operation and Maintenance
Instructions Manual, Smar, 2012.
[11] IF302 – Triple Channel Current to Fieldbus Converter – Operation and
Maintenance Instructions Manual, Smar, 2011.
[12] FY302 – Fieldbus Valve Positioner – Operation and Maintenance
Instructions Manual, Smar, 2012.
[13] OPC Foundation, 2014, 01 Mar, [Online], Available: www.opcfoundation.org
Vítor Viegas was born in Portugal in
1976. He received his degree in Electrical and Computer Engineering from the Instituto Superior Técnico (IST) of the Universidade Técnica de Lisboa (UTL) in 1999. He received the MSc and PhD degrees from the same school in 2003 and 2012, respectively. He works as Assistant Professor at the Instituto Politécnico de Setúbal (IPS). His main research activities concern smart transducers and industrial informatics.
J. M. Dias Pereira (M’00 - SM’04) was
born in Portugal in 1959. He received his degree in Electrical Engineering from the Instituto Superior Técnico (IST) of the Universidade Técnica de Lisboa (UTL) in 1982. During almost eight years he worked for Portugal Telecom in digital switching and transmission systems. In 1992, he returned to teaching as Assistant Professor at the Instituto Politécnico de Setúbal (IPS), where he is, at present, as Coordinator Professor. In 1995 he received the MSc degree and in 1999 the PhD degree in Electrical Engineering and
Computer Science from IST. His main research interests are included in the Instrumentation and Measurement areas.