Universidade de Aveiro Ano 2011/2012
Departamento de Química
CÂNDIDA MARÍLIA
DAS NEVES DIAS
NANOPARTÍCULAS DE COBRE E DE
ZINCO COMO ANTIMICROBIANOS
Dissertação apresentada à Universidade de Aveiro para cumprimento dos requisitos necessários à obtenção do grau de Mestre em Bioquímica, realizada sob a orientação científica do Doutor Nuno Faria, Investigador do Medical Research Council – Human Nutrition Research e do Prof. Doutor Brian Goodfellow, Professor Auxiliar do Departamento de Química da Universidade de Aveiro.
Universidade de Aveiro Ano 2011/2012
Departamento de Química
CÂNDIDA MARÍLIA
DAS NEVES DIAS
COPPER- AND ZINC-BASED
o júri
presidente Prof. Doutor Pedro Miguel Dimas Neves Domingues
professor auxiliar do Departamento de Química da Universidade de Aveiro
Doutor Nuno Jorge Rodrigues Faria
investigador do Medical Research Council-Human Nutrition Research
Prof. Doutor Tito Trindade
professor associado com agregação do Departamento de Química da Universidade de Aveiro
agradecimentos Agradeço a todas aqueles que me apoiaram durante este projecto, em especial aos meus pais por tornarem possível a minha ida para Cambridge, dando-me, em conjunto com a minha irmã, um apoio especial. Relativamente ao MRC HNR, agradeço profundamente ao Doutor Nuno Faria, com quem aprendi imensamente, por me ter aceitado e orientado neste projecto e pelo incrível apoio dado durante todo o seu desenvolvimento. Agradeço também à Doutora Sylvaine Bruggraber e à minha colega Kellie Hamill pela ajuda dada com os testes de determinação da actividade antimicrobiana. Um muito obrigado a todo o grupo pelo fantástico ambiente de trabalho que encontrei. Por último, agradeço ao Doutor Jonhathan Powell por me ter acolhido no seu grupo. No que toca a Universidade de Aveiro, um especial obrigado ao Prof. Doutor Brian Goodfellow, por todo o apoio dado durante este ano lectivo.
palavras-chave nanopartículas, cobre, zinco, antimicrobianos, bactérias, estabilidade, E.
Coli.
resumo Introdução: O aumento da resistência aos antimicrobianos atuais está a criar a necessidade para o desenvolvimento de novos agentes antimicrobianos, aos quais os micro-organismos não desenvolvam resistência facilmente. Nanopartículas parecem ser uma boa aposta nesta luta contra micro-organismos. De facto, tem-se verificado que diversos tipos de nanopartículas com base de metal, como prata, cobre e zinco, possuem atividade antimicrobiana. Apesar de a prata ter vindo a exibir maior atividade antimicrobiana, este elemento não faz parte da homeostase humana e apresenta algum potencial para citotoxicidade, sendo também mais caro que cobre e zinco. Estes, ainda que menos eficazes, são bons candidatos para a produção de baixo custo de nanopartículas com atividade antimicrobiana.
Objectivo: Desenvolver estratégias de síntese de baixo custo para a produção de nanopartículas de cobre e de zinco com actividade antimicrobiana.
Métodos: Síntese pelo aumento do pH de uma solução contendo cobre (II) ou zinco (II) e ligando(s), pela adição de uma base como hidróxido de sódio (NaOH). Modificações a este método foram feitas para a obtenção de diferentes fases minerais. As nanopartículas foram caracterizadas usando ICP-OES, DLS e XRD. A actividade
antibacteriana foi determinada usando o método de micro-diluição em broth, usando placas de 96 poços.
Resultados e discussão: Nanopartículas de cobre (oxo-hidróxidos, óxidos, fosfatos) foram sintetizadas usando diversos ligandos e diferentes condições de síntese. Estas nanopartículas eram instáveis quando diluídas em broth. Apesar de um aumento da atividade antimicrobiana ter sido obtida, é necessário um aperfeiçoamento para que estes materiais sejam viáveis como antimicrobianos.
Nanopartículas de zinco obtidas usando cisteína como ligando não inibiram o crescimento bacteriano.
Conclusão: Nanopartículas de diferentes composições e carga de superfície foram obtidas. Em alguns casos, houve um aumento da estabilidade e atividade antimicrobiana das nanopartículas de cobre em relação a trabalhos anteriores. As nanopartículas de zinco obtidas não inibiram o crescimento bacteriano.
keywords nanoparticles, copper, zinc, antimicrobials, bacteria, stability, E. coli
abstract Introduction: The growing resistance to current antimicrobials is creating the need for novel antimicrobial agents, to which
microorganisms will not easily develop resistance. Nanoparticles seem to be a valuable option in this fight against microorganisms and antimicrobial activity has been reported for several types of metal-based nanoparticles, such as silver, copper and zinc. Although silver has been shown to have higher antimicrobial activity, this element is not part of the homeostasis of humans and presents some potential for cytotoxicity. It is also more expensive than copper and zinc. These although less effective, are good candidates for the cheap production of nanoparticles with antimicrobial activity.
Aim: To develop cheap synthetic strategies for the production of copper and zinc nanoparticles with antimicrobial activity.
Methods: Synthesis by increasing the pH of a solution containing copper (II) or zinc (II) and ligand(s), by adding a base such as sodium hydroxide (NaOH). Modifications to this method were made in order to obtain nanoparticles of a different mineral phase. The nanoparticles were characterised using ICP-OES, DLS, and XRD. The antibacterial activity was tested using the method of microdilution in broth, using 96-well plates.
Results and discussion: Copper-based nanoparticles
(oxo-hydroxides, oxides, phosphates) were synthesised using different ligands and different conditions of synthesis. These nanoparticles were unstable when diluted in broth. An increase in the antimicrobial activity was achieved, but further improvements are still required to make these materials viable antimicrobials. Zinc nanoparticles showed poor antibacterial activity.
Conclusion: Nanoparticles of different compositions and surface charge were obtained. There was improvement in the stability and antibacterial activity of copper based nanoparticles in relation to previous work. Zinc nanoparticles did not inhibit bacterial growth.
C
ONTENTSFIGURES LIST ... I
TABLES LIST ... VI
ABBREVIATIONS/ACRONYMS ... VII
1. INTRODUCTION ... 1 2. BACKGROUND ... 2 2.1. Bacteria ... 2 2.2. Antimicrobials ... 5 2.2.1. Nanoparticles as antimicrobials ... 7 2.3. Copper ... 9 2.3.1. Copper uses... 9 2.3.2. Homeostasis in bacteria ... 10 2.4. Zinc... 11 2.4.1. Homeostasis in bacteria ... 12 2.5. Nanoparticles ... 14 2.5.1. Properties ... 14 2.5.2. Synthesis ... 16
2.5.3. Mechanisms of antimicrobial action ... 17
2.6. Characterisation techniques ... 18
2.6.1. Dynamic Light Scattering ... 18
2.6.2. Zeta potential ... 19
2.6.3. Inductively Coupled Plasma – Optical Emission Spectrometry ... 21
2.6.4. X-ray diffraction ... 22
2.6.5. Antimicrobial activity assays ... 23
3. MATERIALS AND METHODS ... 25
3.1. Materials ... 25
3.2. Methods ... 25
3.2.1. Synthesis ... 25
3.2.2. Characterisation of phase distribution ... 26
3.2.3. ICP-OES ... 27
3.2.4. Determination of particle size and zeta potential ... 27
3.2.5. XRD ... 27
4. RESULTS AND DISCUSSION ... 29
4.1. Copper ... 29
4.1.1. Ligand effect ... 30
4.1.2. Increasing stability... 33
4.1.3. Lamellar structures ... 46
4.1.4. Positively charged nanoparticles ... 50
4.2. Zinc... 55
4.2.1. Zinc nanoparticles ... 57
4.3. Effect of aqueous resuspension of nanoparticles ... 60
5. CONCLUSION ... 61
6. FUTURE WORK ... 63
7. REFERENCES ... 64
APPENDICES ... 70
1. ICP-OES calibration curve ... 70
i
F
IGURES LISTFig. 1 – Structure of a subunit of peptidoglycan, containing acetylglucosamine (NAG), N-acetylmuramic acid (NAM), and four amino acids. The structure is the one found in most gram-negative bacteria. In some bacteria, other amino acids are present [7] ... 2 Fig. 2 – Structure of the cell wall from both gram-positive and gram-negative bacteria [8] .... 3 Fig. 3 – Typical growth curve for a bacterial population. A viable count measures the cells in the culture that are capable of reproducing. Optical density (turbidity), a quantitative measure of light scattering by a liquid culture, increases with the increase in cell number [7] ... 5 Fig. 4 – Curves of bacterial growth in the presence of bactericidal (A), bacteriolytical (B), and bacteriostatic (C) agents. The arrow represent the time at which the agent was added, during the exponential growth [7] ... 5 Fig. 5 - Main mechanisms by which spontaneous mutation results in antimicrobial resistance: altered target site, enzymatic inactivation or modification, decreased penetration, and increased efflux [16]. ... 7 Fig. 6 - Copper homeostasis mechanisms in E. coli. The most relevant homeostatic systems are shown. CopA is a Cu(I)-translocating P-type ATPase, CueO a multi-copper oxidase, and CusCFBA a four-component copper efflux pump (regulated by the system CusRS) [33] .... 11 Fig. 7 – Protein families involved in prokaryotic Zn(II) trafficking: ABC transporters, metallo-chaperones, porins and RND [41] ... 13 Fig. 8 – Possible shapes of nanoparticles: spheres, rods, wires and tubes ... 14 Fig. 9 – Diagram of how bottom-up and top-down approaches are processed [54] ... 16 Fig. 10 – Size distribution graph obtained in for copper nanoparticles produced in the current project (n=3). In this case, the size distribution is reported in terms of volume percentage. . 19 Fig. 11 – Distribution of charge around a negatively charged particle [67] ... 20 Fig. 12 – Emission of radiation upon relaxation from an excited state ... 21 Fig. 13 – Geometric derivation of Bragg‟s law: constructive Interference of reflected waves [70] ... 22 Fig. 14 – Copper phase distribution (%) with varying pH during the synthesis of copper oxo-hydroxide ([Cu]=40 mM)... 29 Fig. 15 – Structures of tartaric acid (A) and adipic acid (B) ... 30 Fig. 16 – Structure of glucuronic acid ... 31 Fig. 17 - Copper phase distribution (%) with varying pH during the synthesis of copper (II) oxo-hydroxide ([Cu]=40 mM) in the presence of glucuronic acid (40 mM). ... 31
ii Fig. 18 - Copper phase distribution (%) with varying pH during the synthesis of copper (II) oxo-hydroxide ([Cu]=40 mM) in the presence of tartaric acid (20 mM) and glucuronic acid (20 mM) ... 32 Fig. 19 - Particle size distribution at various pH‟s during the synthesis of copper oxo-hydroxide ([Cu]=20 mM) in the presence of tartaric acid (20 mM) and glucuronic acid. (A) pH 6; (B) pH 10 ... 32 Fig. 20 - Copper phase distribution (%) of CuOH TartGlr diluted in broth at concentrations 1, 10 and 100 ppm ... 33 Fig. 21 – Inhibition of growth of E. coli by CuOH TartGlr nanoparticles at 6h, 100 ppm of copper, and 10-2 bacterial dilution. The white column represents the results for control (40 mM solution of copper chloride) and the grey one for the suspension ... 33 Fig. 22 - Copper phase distribution (%) with varying pH during the synthesis of copper oxo-hydroxide ([Cu]=40 mM) using a different copper salt ... 34 Fig. 23 – XRD characterization of copper oxo-hydroxide particles using a different copper salt. The lines in red represent the XRD reference for copper (II) hydroxide (Cu(OH)2). ... 34
Fig. 24 - Copper phase distribution (%) with varying pH during the synthesis of copper oxo-hydroxide ([Cu]=40 mM) using a different copper salt and in the presence of tartaric acid (20 mM) and adipic acid (20 mM) ... 35 Fig. 25 - Particle size distribution at various pH‟s during the synthesis of copper oxo-hydroxide ([Cu]=40 mM) in the presence of tartaric acid (20 mM) and adipic acid (20mM) (A) 7.0; (B) pH 8.0... 36 Fig. 26 – XRD characterization of copper oxide nanoparticles. The lines in blue represent the XRD reference for Sodium acetate hydrate (C2H3NaO2·3H2O) ... 36
Fig. 27 – Inhibition of growth of E. coli by CuOH Tart Ad nanoparticles synthesised using a different copper salt (copper (II) acetate) at 6h, 100 ppm of copper, and 10-2 bacterial dilution. The white column represents the results for control (40 mM solution of copper (II) acetate) and the grey one for the suspension ... 37 Fig. 28 - Copper phase distribution (%) with varying pH during the synthesis of copper oxide ([Cu]=40 mM) under heating ... 38 Fig. 29 – XRD characterization of copper oxide particles. The lines in red represent the XRD reference for Tenorite (CuO) and the blue ones for Halite (NaCl) ... 38 Fig. 30 – Copper phase distribution (%) with varying pH during the synthesis of copper oxide ([Cu]=40 mM) in the presence of tartaric acid (40 mM) under heating ... 39 Fig. 31 – Copper phase distribution (%) with varying pH during the synthesis of copper oxide ([Cu]=40 mM) in the presence of tartaric acid (80 mM) under heating ... 40 Fig. 32 – Copper phase distribution (%) during the synthesis of copper oxide nanoparticles ([Cu]=40 mM) in the presence of tartaric acid (20 mM) under heating ... 40
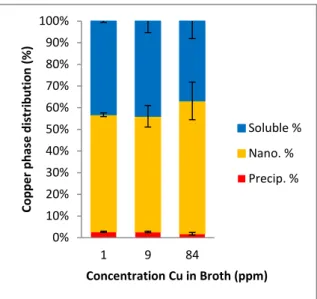
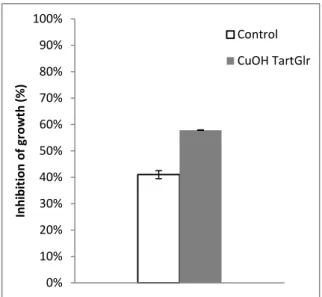
iii Fig. 33 – XRD characterization of copper oxide particles modified with tartaric acid. The lines in red represent the XRD reference for Tenorite (CuO) and the blue ones for Halite (NaCl).41 Fig. 34 – Structure of cysteine ... 41 Fig. 35 - Copper phase distribution (%) during the synthesis of copper oxide nanoparticles ([Cu]=40 mM) in the presence of cysteine (40 mM) under heating ... 42 Fig. 36 - Copper phase distribution (%) of CuO Cys diluted in broth at concentrations 1, 9 and 84 ppm ... 42 Fig. 37 – Inhibition of growth of E. coli by CuO Cys nanoparticles at 6h, 100 ppm of copper, and 10-2 bacterial dilution. The white column represents the results for control (40 mM solution of copper (II) chloride) and the grey one for the suspension ... 42 Fig. 38 – Copper phase distribution (%) with varying pH during the synthesis of copper phosphate ([Cu]=40 mM). ... 43 Fig. 39 – XRD characterization of unmodified copper phosphate particles. The lines in blue represent the XRD reference for Cu4H(PO4)3·3H2O and the green ones for CuHPO4·H2O. . 43
Fig. 40 – Structure of citric acid. ... 44 Fig. 41 – Copper phase distribution (%) with varying pH during the synthesis of copper phosphate nanoparticles ([Cu]=40 mM) in the presence of citric acid (40mM). ... 44 Fig. 42 - Particle size distribution at pH 6 during the synthesis of copper phosphates ([Cu]=40 mM) in the presence of citric acid (20 mM). ... 45 Fig. 43 – XRD characterization of CuPO4 Cit nanoparticles. The lines in red represent the
XRD reference for Halite (NaCl) ... 45 Fig. 44 - Copper phase distribution (%) of CuPO4 Cit diluted in broth at concentrations 1, 10
and 103 ppm ... 46 Fig. 45 – Inhibition of growth of E. coli by CuPO4 Cit nanoparticles at 6h, 100 ppm of copper,
and 10-2 bacterial dilution. The white column represents the results for control (40 mM solution of copper (II) chloride) and the grey one for the suspension. ... 46 Fig. 46 – Structure of sodium dodecyl sulphate (SDS). ... 46 Fig. 47 - Copper phase distribution (%) with varying pH during the synthesis of copper oxo-hydroxide ([Cu]=20 mM) in the presence of SDS (10 mM). ... 47 Fig. 48 - Particle size distribution at pH 6.9 during the synthesis of copper oxo-hydroxide ([Cu]=20 mM) in the presence of SDS (10 mM). ... 47 Fig. 49 - Copper phase distribution (%) with varying pH during the synthesis of copper oxo-hydroxide ([Cu]=20 mM) to which SDS (10 mM) was added at pH 6.5 ... 48 Fig. 50 - Particle size distribution at various pH‟s during the synthesis of copper oxo-hydroxide ([Cu]=20 mM) to which SDS (10 mM) was added at pH 6.5. (A) pH 6.5 (-SDS); (B) pH 6.9 (+SDS); (C) pH 7.7 (+SDS). ... 48 Fig. 51 - Octadecyl trimethyl ammonium bromide (C18TAB) ... 49
iv Fig. 52 - Particle size distribution at pH 7.4 during the synthesis of copper oxo-hydroxide ([Cu]=20 mM) to which SDS (10 mM) was added at pH 6.5 and C18TAB (10 mM) was added
at pH 7 ... 49 Fig. 53 - Particle size distribution at various pH‟s during the synthesis of copper oxo-hydroxide ([Cu]=20 mM) in the presence of tartaric acid (10 mM), to which C18TAB (10 mM)
was added at pH 6.4. (A) pH 6.4 (-C18TAB); (B) pH 7.4 (+C18TAB) ... 50
Fig. 54 – Zeta potential distribution at pH 6 of CuOH TartAd, using water as dispersant. ... 51 Fig. 55 – Structure of carnitine ... 52 Fig. 56 - Copper phase distribution (%) with varying pH during the synthesis of copper oxo-hydroxide ([Cu]=20 mM) in the presence of carnitine (20 mM) ... 52 Fig. 57 - Particle size distribution at pH 6.5 during the synthesis of copper oxo-hydroxide ([Cu]=20 mM) in the presence of carnitine (20 mM) ... 52 Fig. 58 – Zeta potential distribution at pH 6.5 during the synthesis of copper oxo-hydroxide ([Cu]=20 mM) in the presence of carnitine (20 mM) ... 53 Fig. 59 – XRD characterization of copper (II) oxo-hydroxide particles modified with carnitine. The lines in red represent the XRD reference for Paratacamite (Cu2Cl(OH)3) and the blue
ones for Halite (NaCl) ... 53 Fig. 60 - Copper phase distribution (%) of CuOH Car diluted in broth at concentrations 1, 10 and 104 ppm ... 54 Fig. 61 – Inhibition of growth of E. coli by CuOH Car nanoparticles at 6h, 100 ppm of copper, and 10-2 bacterial dilution. The white column represents the results for control (40 mM solution of copper chloride) and the grey one for the suspension ... 54 Fig. 62 - Particle size distribution at pH 7 during the synthesis of copper oxo-hydroxide ([Cu]=40 mM) in the presence of carnitine (120 mM) ... 54 Fig. 63 - Particle size distribution at various pH‟s during the synthesis of copper oxo-hydroxide ([Cu]=40 mM) in the presence of carnitine (20 mM) and tartaric acid (20 mM). (A) pH 5; (B) pH 6 ... 55 Fig. 64 – Zinc phase distribution (%) with varying pH during the synthesis of zinc oxo-hydroxide ([Zn]=40 mM). ... 56 Fig. 65 – XRD characterization of unmodified zinc oxo-hydroxide particles. The peaks in blue represent the XRD pattern for Halite (NaCl). ... 56 Fig. 66 – Zinc phase distribution (%) with varying pH during the synthesis of zinc (II) oxo-hydroxide ([Zn]=40 mM) in the presence of cysteine (40 mM) ... 57 Fig. 67 – Zinc phase distribution (%) with varying pH during the synthesis of zinc (II) oxo-hydroxide nanoparticles ([Zn]=40 mM) in the presence of cysteine (60mM) ... 58 Fig. 68 - Particle size distribution at pH 7.6 during the synthesis of zinc (II) oxo-hydroxide ([Cu]=40 mM) in the presence of cysteine (60 mM). ... 58
v Fig. 69 – XRD characterization of ZnOH Cys nanoparticles. The lines in red represent the XRD reference for Halite (NaCl) ... 58 Fig. 70 – Inhibition of growth of E. coli by ZnOH Cys nanoparticles at 6h, 100 ppm of copper, and 10-2 bacterial dilution. The white column represents the results for control (40 mM solution of zinc chloride) and the grey one for the suspension ... 59 Fig. 71 – Zinc phase distribution (%) with varying pH during the synthesis of zinc (II) oxo-hydroxide nanoparticles ([Zn]=40 mM) in the presence of cysteine (20mM) and tartaric acid (20mM). ... 59 Fig. 72 - Copper phase distribution (%) resulted from the resuspension of a material obtained from a sub-micron particle containing suspension in water and broth at 4 mM ... 60 Fig. 73 – Calibration curves obtained during an analysis by ICP-OES. Four calibrations were made at different points ... 70 Fig. 74 – Evolution of optical density with time during a test for the determination of the antibacterial activity of copper nanoparticles with 10-5 bacterial dilution ... 71 Fig. 75 - Evolution of optical density with time during a test for the determination of the antibacterial activity of copper nanoparticles with 10-4 bacterial dilution ... 71 Fig. 76 - Evolution of optical density with time during a test for the determination of the antibacterial activity of copper nanoparticles with 10-3 bacterial dilution ... 71 Fig. 77 - Evolution of optical density with time during a test for the determination of the antibacterial activity of copper nanoparticles with 10-2 bacterial dilution ... 72 Fig. 78 - Evolution of optical density with time during a test for the determination of the antibacterial activity of copper nanoparticles with 10-1 bacterial dilution ... 72
vi
T
ABLES LISTvii
A
BBREVIATIONS/
ACRONYMS Ad – adipic acidCar – carnitine
CFU – Colony Forming Units Cit – citric acid
Cys - cysteine
C18TAB - Octadecyltrimethylammonium bromide
DLS – Dynamic Light Scattering FTIR – Fourier Transform Infra-red Glr – glucuronic acid
GRAS – Generally Recognized as Safe
ICP-OES – Inductively Coupled Plasma - Optical Emission Spectrometry MIC – Minimum Inhibitory Concentration
NAG – N-acetylglucosamine NAM – N-acetylmuramic acid OD – Optical Density
RI – Refractive Index
RND – Resistance-nodulation-cell Division ROS – Reactive Oxygen Species
SDS – Sodium Dodecyl Sulphate
STEM – Scanning Transmission Electron Microscopy Tart – tartaric acid
1
1. I
NTRODUCTIONIn the last century, antimicrobials have been developed and successfully used, however, their continuous usage led to the development of resistance by microorganisms. (e.g. bacterial resistance to antibiotics). Although most of the existing antibiotics can still fight drug-resistance bacteria, their effectiveness is decreasing [1]. Due to this problem, attempts have been made to develop new and effective antimicrobial agents, to which microorganisms will not develop resistance easily. Nanoparticles, due to their unique properties (e.g., large surface area to volume ratio), seem to be a valuable option as antimicrobials. In fact, silver nanoparticles have already been used and showed significant antimicrobial activity [2], but the cost of this metal limits its use. There are other cheaper metals which are known to have antimicrobial activity. For instance, copper has been used as a biocide for centuries, and, although its usage as an antimicrobial has decreased in the last few centuries, it is rising in prominence as an antimicrobial agent. The use of copper surfaces as self-sanitizing material is now encouraged, and many publications deal with the mechanistic aspects of contact-mediated killing by copper [3]. Zinc is another metal which has antimicrobial properties, and, for example, is added to many oral healthcare products [4]. The use of nanoparticles of copper or zinc may enhance the antimicrobial activity of these metals and their use is unlikely to result in development of resistance by bacteria because these elements are essential to their metabolism. In this way, nanotechnology seems to be useful in this battle against microbes. There are many different ways of producing metal nanoparticles, which depend largely on the type of nanoparticles to be produced. The production of nanoparticles can be done using chemical methods, which are typically cheaper than physical methods and can be readily scaled-up.
This project is part of an on-going programme to develop cheap synthetic strategies for the production of copper and zinc nanoparticles with antimicrobial activity on the same range as silver nanoparticles. Therefore, chemical approaches are being employed in this project for the production of nanoparticles. For this purpose, different conditions and ligands were tested, in order to produce a range of stable copper- and zinc-based nanoparticles. Subsequently, the antibacterial activity of the obtained nanoparticles was also tested.
2
2. B
ACKGROUND2.1. B
ACTERIABacteria are prokaryotes and are surrounded by a rigid cell wall composed of polysaccharides and peptides. Beneath the cell wall is the plasma membrane, which is a bilayer of phospholipids and associated proteins. The cell wall is readily penetrated by several molecules, but the plasma membrane provides the functional separation between the inside of the cell and its external environment. The genetic material is localized in a discrete region, the nucleoid, and is not separated from the surrounding cytoplasm by membranes. Ribosomes and inclusion bodies are scattered in the cytoplasmic matrix. They can also have flagella, which are used for locomotion [5].
The structure of the cell wall is unique in nature and is composed of disaccharide-pentapeptide subunits. The disaccharides N-acetylglucosamine (NAG) and N-acetylmuramic acid (NAM) are alternating sugars, with a four amino acid chain linked to the carboxyl group of NAM (Fig. 1). Polymers of these subunits crosslink one another via peptide bridges to form peptidoglycan sheets. Layers of these sheets are, in turn, crosslinked with one another to give a multi-layered, crosslinked structure of considerable strength [6].
Fig. 1 – Structure of a subunit of peptidoglycan, containing N-acetylglucosamine (NAG), N-acetylmuramic acid (NAM), and four amino acids. The structure is the one found in most gram-negative bacteria. In some bacteria, other amino acids are present [7].
3 Bacteria can be divided in two major groups: gram-positive and gram-negative. This division results from the different responses of bacteria to the stain procedure. Gram-positive bacteria stain purple, whereas gram-negative bacteria are coloured pink or red by the technique. This different staining results from structural differences in the cell wall of both types of bacteria. The gram-positive cell wall consists of a single homogeneous peptidoglycan or murein layer. In contrast, the gram-negative cell wall is quite complex. It has a peptidoglycan layer surrounded by a thick outer membrane (Fig. 2) [8]. This outer membrane functions as the cell‟s initial barrier to the environment.
The components of the cell surface are comprised of macromolecules containing carboxylate, phosphate, and amino groups which are ionized as a function of the environmental pH, thereby conferring electrostatic charge to the cell surface. Bacterial cells possess a net negative electrostatic surface charge when cultivated at physiological pH values [9].
Fig. 2 – Structure of the cell wall from both gram-positive and gram-negative bacteria [8].
Bacteria need specific conditions to grow; they need nutrients to take energy from and to act as the cellular building components. They also need carbon, hydrogen, oxygen, nitrogen, sulphur, phosphorus, and other inorganic micronutrients. Growth can be defined as an increase in cellular components. This may result in the increase of the microorganism‟s size and/or number of cells. It is difficult to study the growth and reproduction of individual microorganisms, especially due to their small size and, thus, for studying the growth, normally the changes in the total population are followed [8]. The life of a bacterial cell can be seen as “feast or famine”. This model comes up because, besides the ability of bacteria to consume virtually all readily metabolizable nutrients in the environment, they can also
4 persist for long periods of time under starvation conditions once the nutrients have been depleted [10].
For microbiological studies, there is a need to grow and maintain microorganisms in the laboratory, and this is only possible if suitable media are available. A culture medium is a solid or liquid preparation used to grow, transport and store microorganisms [8]. There is a classification for media types: defined media and complex media. In defined media, the exact composition is known in both a qualitative and a quantitative sense. However, the culture of many microorganisms does not require the knowledge of the exact composition of the medium. In these cases, complex media can be used. Complex media are made up of digests of microbial, animal or plant products. These digests are commercially available in dehydrated form and can be easily prepared [7]. Most heterotrophic bacteria would be routinely grown on such a medium. If a complex medium is in liquid form, it is called broth. When growing bacteria on a solid medium, a solidifying agent, such as agar, is added to the medium [11].
The growth of the population can be studied by analysing the growth curve of a microbial culture. When microorganisms are cultivated in liquid medium, they usually are grown in a batch culture or closed system. This means that no fresh medium is provided during incubation, leading to a decline in the concentration of nutrients and to an increase in the concentration of waste residues. Therefore the organisms cannot grow exponentially indefinitely [8]. The resulting growth curve of a microbial culture has four distinct phases: lag phase, exponential (log) phase, stationary phase, and death phase (Fig. 3). When microorganisms are inoculated into a fresh medium, usually the growth only starts after a period of time, the lag phase. The length of this period may vary, depending on the condition of the microorganisms and the conditions of growth. For example, this phase will be longer if the inoculum is from an old culture rather than young one. In the exponential phase, the microorganisms grow and divide at the maximum rate. The rate of exponential growth is constant and may vary greatly. It is influenced not only by the environment conditions and the nature of the culture medium but also by the genetic characteristics of the organism itself. The stationary phase results from the ceasing of the bacterial growth. This phase is usually reached by bacteria at a population level of around 106 cells per ml, but the final population size depends on several factors, such as nutrient availability and the type of microorganism. Generally, a microorganism culture enters the stationary phase due to the depletion of nutrients and/or the accumulation of waste residues that inhibit growth. The growth rate in this case is zero. The building up of toxic wastes and depletion of nutrients leads eventually to the death phase, where cells have lost their viability. The death of the population is constant like in the exponential phase, but typically the rate of death is much slower. In some cases cell death is accompanied by cell lysis. When cells fail to lyse, the
5 death rate may appear less pronounced when using turbidimetric assays [7, 8]. A fifth phase can be considered, the long-term stationary phase. After death, E. coli for example can be maintained in batch culture for longer periods of time without adding more nutrients. These can be done by adding distilled water to maintain the volume and osmolarity. Cultures can be maintained at densities of ~106 colony forming units (CFU) per ml for more than 5 years in these conditions. In this case, the growth and death are balanced and the growth rate is stationary [12].
Fig. 3 – Typical growth curve for a bacterial population. A viable count measures the cells in the culture that are capable of reproducing. Optical density (turbidity), a quantitative measure of light scattering by a liquid culture, increases with the increase in cell number [7].
2.2. A
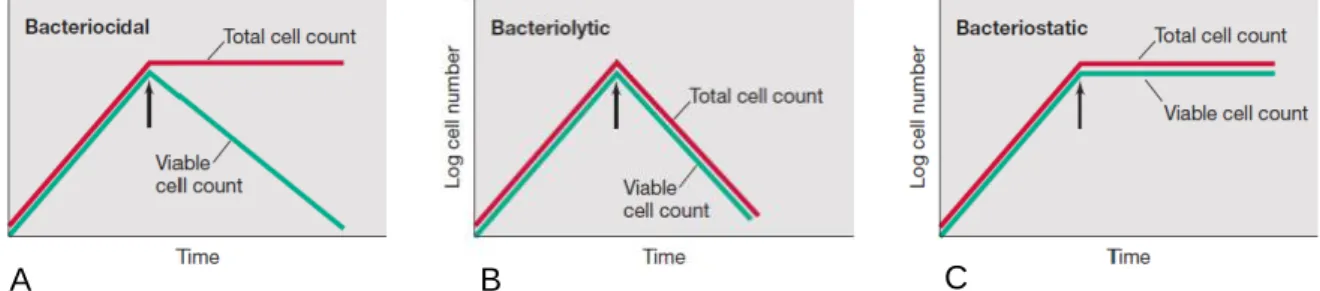
NTIMICROBIALSAntimicrobials are natural or synthetic chemicals that kill or inhibit the growth of microorganisms. Antibacterial agents can be classified as bactericidal, bacteriolytical, and bacteriostatic. Bactericidal agents kill the cell but do not destroy it. Thus, the total number of cells remains constant (Fig. 4A). Bactericidal agents can also be bacteriolytical, i.e. they can kill by cell lysis, leading to the release of the cytoplasmic contents. This means that not only the viable cell number decreases but also the total cell number (Fig. 4B). Bacteriostatic agents do not kill the organism and the number of viable cells remains constant (Fig. 4C) [7].
Fig. 4 – Curves of bacterial growth in the presence of bactericidal (A), bacteriolytical (B), and bacteriostatic (C)
agents. The arrow represent the time at which the agent was added, during the exponential growth [7].
C B
6 There are several possible strategies for antimicrobial therapeutics, but the most common against bacteria is the use of antibiotics. Different types of antibiotics have different targets, thus having different mechanisms of action. Although most antibiotics are effective at treating their target infections, some bacterial resistance has developed over the last decades. This poses as a serious problem in public health, as it results in treatment failure and it may also lead to infection control problems, either within healthcare institutions or the community [13]. Thus, there is a need to find other antibacterial therapeutics based on different mechanisms of action, to which bacterial resistance is less likely to be developed. Nanoparticles have shown antimicrobial activity, which has been reported over the past few years, and that makes them one possible option [13]. Nevertheless, before developing nanoparticulate strategies, it is important to understand the mechanism of action and of resistance to antibiotics.
There are four major modes of antibacterial action of antibiotics: (1) interference with cell wall synthesis; (2) inhibition of protein synthesis; (3) interference with nucleic acid synthesis; and (4) inhibition of a metabolic pathway [14].
Bacteria may develop resistance to antibacterial drugs through various mechanisms. Some species of bacteria are innately resistant to one or more classes of antimicrobial agents. A far more alarming problem, acquired resistance, is where initially susceptible populations of bacteria become resistant to an antibacterial agent and proliferate under the selective pressure of the use of that agent [13]. The mechanisms through which bacteria develop resistance to antimicrobials have their origins at the genetic level. The resistance can be a result of chromosomal mutation or inductive expression of a latent chromosomal gene or by exchange of genetic material through transformation (exchange of DNA), transduction (bacteriophage), or conjugation by plasmids (extrachromosomal DNA) [15]. Thus, normally susceptible populations of bacteria may become resistant to antimicrobial agents through mutation and selection, or by acquiring the genetic information that encodes the resistance (horizontal evolution) from other bacteria. Spontaneous mutation (Fig. 5) may cause resistance by: (1) changing the target protein to which the antibacterial agent binds or by modifying or eliminating the binding site; (2) by upregulating the production of enzymes that inactivate the antimicrobial agent; (3) downregulating or altering an outer membrane protein channel that the drug requires for cell entry; or (4) upregulating pumps that expel the drug from the cell [13]. Mutation and selection enable many bacterial species to adapt quickly to the introduction of antibacterial agents into their environment.
7 Fig. 5 - Main mechanisms by which spontaneous mutation results in antimicrobial resistance: altered target site,
enzymatic inactivation or modification, decreased penetration, and increased efflux [16].
2.2.1. Nanoparticles as antimicrobials
Materials at the nanoscale are now seen as good antimicrobial agents due to their high surface area to volume ratio, thus having unique chemical and physical properties [17, 18]. Metallic nanoparticles are more promising with regards to antimicrobial activity due to their large surface area to volume ratio. Some nanoparticles of different metals display antibacterial activity and are used for various healthcare, hygiene and personal care purposes (e.g. silver, copper and zinc) [19, 20].
The interactions between metal nanoparticle and bacterium appear to be based on contact-mediated membrane lipid peroxidation by reactive oxygen species (ROS) production and, in the case of nanoparticles, are enhanced by a greater contact with the membrane due to their large surface area. The contact is facilitated by electrostatic forces between nanoparticles and bacteria [19]. Nanoparticles also cause the accumulation of envelope protein precursors, which seems to destabilize the outer cell wall and results in the collapse of the plasma membrane. This is probably due to the dissipation of the proton motive force, resulting in the depletion of intracellular ATP, which is needed for the translocation of newly synthesized bacterial envelope membrane proteins by preprotein translocase [21]. Nanoparticles can also be taken up by the bacterium. Once they are internalized they tend to react with sulphur-containing proteins as well as with phosphorus-containing compounds
8 such as DNA [17]. The antibacterial action of the nanoparticles can also be due to the release of ions by the nanoparticle. These ions can then pass the bacterial cell wall and reach the cytoplasm, where they will induce the production of ROS and interact with cellular components, such as proteins and DNA [18]. The bactericidal properties of nanoparticles are size dependent as shown by a study on the determination of the effect of silver nanoparticles with sizes between 1-100 nm on gram-negative bacteria. In this case, only the particles with a diameter between ~1-10 nm presented a direct interaction with bacteria. Also, it has been shown that silver nanoparticles of smaller size show a stronger antibacterial activity possibly due to their higher surface area to volume ratio [17]. Since nanoparticles interact mostly with the cell membrane, causing its disruption, bacteria are unlikely to develop mechanisms of resistance for the nanoparticles.
Silver nanoparticles, in particular, have shown to be efficacious against bacteria, viruses and other microorganism. It has been shown that silver nanoparticles can have a bacterial MIC as low as 6 ppm [22]. Thus, silver nanoparticles have been applied in a wide range of applications from disinfecting medical devices and home appliances to water treatment. Additionally, silver nanoparticles have been used in the preparation of silver nanocomposite fibers, in which the nanoparticles are incorporated inside the fabric [2]. There are some disadvantages associated to the use of silver nanoparticles as antimicrobials: (1) they are unstable under light and heat conditions; (2) they can interact with Cl- ions in aqueous medium, which makes the Ag+ ions lose antibacterial activity; (3) silver is a noble metal and is very expensive [23]. Also, silver nanoparticles have been shown to be cytotoxic and genotoxic for several human cell lines, and it has been demonstrated that silver nanoparticles induce apoptosis in fibroblast cells via the mitochondrial pathway. This may be due to the disruption of the mitochondrial respiratory chain by the nanoparticles, leading to production of reactive oxygen species and interruption of ATP synthesis, which in turn cause DNA damage [24]. In humans, the long-term exposure to silver compounds can cause irreversible skin discoloration or Argyria. The exposure limit to soluble silver recommended by the Health and Safety Executive is 0.01 mg.m-3 [25].
Similarly to silver, copper and zinc nanoparticles also show antimicrobial activity. These elements are part of the homeostasis of eukaryotic organisms and therefore, in principle, these are likely to be safer than silver nanoparticles. The exposure limit to fumes of copper and zinc by the Health and Safety Executive is 1 mg.m-3 for both [25]. However, copper and zinc nanoparticles appear to have lower antimicrobial activity than silver nanoparticles, but their lower toxicity and their lower cost may offset this disadvantage.
9
2.3. C
OPPERCopper is a transition metal with partially filled d orbitals and is the strongest Lewis acid in Group IB of the periodic table, which gives copper the ability to mediate electron transport, accepting and donating electrons. Copper exists primarily in one of two oxidation states: the oxidized Cu(II) cupric form and the reduced Cu(I) cuprous form. Cu(I) and Cu(II) are the most effective monovalent and divalent ions, respectively, for binding to organic molecules and possess almost equal tendencies to form complexes with many organic ligands [26]. Cu(I) is a closed shell 3d10 transition metal ion and hence diamagnetic. As a soft Lewis acid, it tends to bind to soft bases such has thiols, hydrides, alkyl groups, cyanide, and phosphines. Cu(II) has a 3d9 configuration and is paramagnetic. As an intermediate Lewis acid it forms complexes with additional ligands to Cu(I), including sulphate and nitrate [27]. Copper is usually bound to proteins via cysteine, methionine, or histidine amino acid side chains [28].
2.3.1. Copper uses
Human civilization has been using copper for some millennia. Copper was always used in a medical way at different levels: for the treatment of headaches, burns, intestinal worms, and ear infections and for hygiene in general. Copper can be used as an alternative to antibiotics, using copper surfaces in hygiene-sensitive areas. For instance, the idea of using copper vessels to render drinkable water has been revived as a low-cost alternative for developing countries [3]. It seems to be a good alternative to antibiotics, because, in contrast to the highly resistant microbes that have evolved to antibiotics in less than 50 years of use, tolerant microbes to copper are extremely rare, a surprising fact, given copper‟s ubiquitous presence. This may be due to the essentiality of copper to most microorganisms. Viruses do not have tolerance and repair mechanisms as bacteria and fungi and thus are highly susceptible to copper induced damage [29].
However, copper is not appropriate for use for systemic applications (e.g. oral, intravenous), mainly since once copper is ingested it readily interacts with transport proteins as well as small molecular weight ligands, making it unavailable as an antimicrobial for these applications. Furthermore, in cases where no copper excretion pathways are available, the unligated free copper in the body may be involved in diseases pathogenesis, such as in Alzheimer‟s disease [29].
10 2.3.2. Homeostasis in bacteria
Although essential to the correct function of eukaryotic and prokaryotic cells, high concentrations of copper are toxic. Copper is therefore an essential and a toxic element at the same time, and the viability of cells depends on a perfect regulation of transport, storage and distribution of this metal. Usefully, for antibacterial applications, the tolerance of eukaryotic cells is generally greater than that of prokaryotic. This may be due to the existence of metallothioneins (cytoplasmic metal-binding proteins), that can protect cells against the toxic effects of copper by chelating this heavy metal. Genes encoding metallothioneins occur in animals, higher plants, and eukaryotic micro-organisms but only in some prokaryotes [30], such as Synechococcus (Cyanobacteria), Enterobacteriacea, and Gammaproteobacteria (Proteobacteria) and Mycobacterium (Actinobacteria) [31].
Copper ions are essential for bacteria but can cause a number of toxic cellular effects if levels of free ions are not controlled. Thus, bacteria must achieve precise copper homeostasis to avoid copper-mediated toxicity whilst maintaining a supply of copper for copper-requiring proteins. Bacteria developed a range of mechanisms to protect themselves from the toxic effects of copper ions in low concentrations: extracellular sequestration of copper ions, relative impermeability of the outer and inner bacterial membranes to copper ions, metallothionein-like copper-scavenging proteins in the cytoplasm and periplasm, and active extrusion of copper from the cell [3]. The way in which bacteria meet the conflicting demands imposed by copper varies depending upon environmental conditions, their adopted ecological niche, and phylogeny.
Thus, copper homeostatic systems have been studied in great detail. Escherichia
coli, which is a gram negative bacterium and a facultative aerobe, is particularly well studied.
It lives in the digestive tract of warm-blooded animals. The concentration of copper can be high in the digestive tract, particularly in the stomach and duodenum, but even there it should not exceed 10 µM. However, it has been shown that under acidic anaerobic conditions, which prevail on that part of the digestive tract, copper becomes much more toxic. Thus, intestinal bacteria have elaborated mechanisms for copper homeostasis as an adaption to their specific ecological niche, the animal gut [32]. Copper enters the bacterial cell through an unknown importer (Fig. 6). The responses of E. coli to elevated copper levels primarily involve the chromosomally-encoded cue and cus systems. The cus system only confers copper-tolerance under extreme copper stress while the cue system is the primary copper homeostasis [32]. As extracellular copper levels increase, CueR mediates production of a copper-exporting P1B-type ATPase CopA at the cytoplasmic membrane and a
11 Although these proteins apparently clear the cytosol of excess of copper, this is retained within the periplasm and thus may serve as a compartmentalized store [32]. If copper levels keep increasing, expression of the cusCFBA operon is induced by the CusR/S two-component sensory system, which detects excess of copper in the periplasm, mediating export of copper across the outer membrane [27]. The cus system is particularly important in providing copper-tolerance under anaerobic conditions [32]. Some E. coli strains also harbor the plasmid-borne pco system which involves seven genes, providing further copper-resistance. The mechanism of copper detoxification provided by this system involves the multi-copper oxidase PcoA and its putative partner PcoC, both of which are exported to the periplasm [32].
Fig. 6 - Copper homeostasis mechanisms in E. coli. The most relevant homeostatic systems are shown. CopA is
a Cu(I)-translocating P-type ATPase, CueO a multi-copper oxidase, and CusCFBA a four-component copper efflux pump (regulated by the system CusRS) [33].
2.4. Z
INCZinc is the first element in group 12 of the periodic table. It has a complete d subshell and the divalent cation is the only naturally occurring oxidation state and has no redox activity under physiological conditions. Its relative stability, ability to co-ordinate 4 or sometimes 6 ligands, and its acid Lewis properties may be fundamental to the biological role of zinc [34]. In fact, zinc is the second most abundant trace element in the body, thus being
12 one of the most important trace elements related to health and disease. This element is present in all cells and is a requirement for the normal functions of cells, tissues and organs of the body. It catalyses enzyme activity, contributes to protein structure, and regulates gene expression [35].
Zinc (II) is a strong intracellular Lewis acid and is predominantly coordinated to proteins via either sulphur “thiol” moieties of cysteine residues or the amino “imidazole” ligands of histidine residues [36]. Because of its ability to interact with thiols and block essential reactions in the cell, high concentrations of zinc are toxic. Among its many applications, zinc materials can also be used as antimicrobials. Some enzyme systems can be inhibited by zinc, such as glycolytic enzymes in streptococci. Also, Zn2+ is a well-known sulfhydryl reactive agent and many of its antimicrobial actions may be caused by reaction with sulfhydryl groups. Due to these antimicrobial properties, zinc is added to many oral healthcare products. Usually, zinc is considered more of a bacteriostatic agent rather than a bactericidal one. However, it can be used along with other bactericidal agents to increase their power [4].
2.4.1. Homeostasis in bacteria
Prokaryotic organisms do not possess organelles, i.e. sub-cellular compartments, thus the major mechanisms that maintain cellular Zn(II) concentrations are limited to the highly regulated processes of Zn(II) import, metal sequestration by metallo-chaperones and Zn(II) export across the cytoplasmic membrane (Fig. 7) [36].
One of the primary mechanisms of Zn(II) import is the ZnuABC, which is a high affinity Zn(II) uptake system. This type of transporters usually has two transmembrane proteins that form a pore in the membrane allowing the transport of specific substrate from one side of the membrane to the other. On the cytosolic membrane face of this pore are one or two ATP-binding regions that act to provide the energy for substrate transport from ATP hydrolysis. The Znu proteins of E. coli belong to a family of uniquely bacterial divalent metal ion ABC transport systems that are dependent upon an extra-cytoplasmic metal-binding protein [37]. The ZnuABC system is regulated by Zur, which is a member of the Fur family of bacterial metal-responsive regulators and can sense sub-femtomolar concentration of cytosolic Zn(II) [38]. In its native state, Zur forms a dimer, which in the presence of excess Zn(II) binds to a regulatory sequence that is located within the central znu operator region and prevents the binding and activity of RNA polymerase. This Zur dimer is only active in the reduced form [39]. The first binds Zn(II) very tightly and is functionally analogous to the Zn(II)-binding site in Fur, whereas Zn(II) is more readily exchanged in the second site in the
13 Zn(II) metallo-regulatory proteins SmtB from Synechococcus. Zur proteins seem to be widespread among gram-negative, gram-positive and cyanobacteria [36]. There is a group of porins in E. coli, which form a cylindrical, fluid-filled channels in the outer membrane of cells that allow selective hydrophilic solutes of up to 600 Da, including divalent metal cations such as Zn(II), to diffuse across into the periplasmic space. Zn(II) may then be imported into the cytosol of cells such as E. coli as neutral metal phosphate via the constitutively expressed inorganic phosphate uptake system (Pit) [40].
Fig. 7 – Protein families involved in prokaryotic Zn(II) trafficking: ABC transporters, metallo-chaperones, porins
and RND [41].
Chaperones act to escort or usher interactive entities through the potentially hostile environments in which they find themselves. The primary function of the chaperones is to protect, preventing unfavourable interactions between the entity and the environment [36]. A family of soluble metal-binding proteins, known as metallo-chaperones are thought to facilitate the intracellular tracking of metal ions [42].
The export of the zinc can be made by different high and low-affinity exporters. One example of such exporters is the resistance-nodulation-cell division (RND) protein family, which exports excessive cations. The RND protein family was first described as a related group of bacterial transport proteins involved in heavy metal resistance (R. metallidurans), nodulation (Mesorhizobium loti) and cell division (E. coli). The first member of this family to be identified was the CzcA protein from R. metallidurans [36]. This β-proteobacterium
Cytosol ATP ADP
ABC transporters
Metallo-chaperones
P orin s Possible Periplasm H+ H+RND
14 contains two large plasmids involved in the heavy metal resistance. One of them, increased the MICs of Zn2+ by 50 fold [43].
Zinc-uptake can occur at the different levels of transporter synthesis and activity. One example is the zinc-binding protein-dependent transport systems, which were firstly identified in cyanobacteria and in pathogenic streptococci [44]. These bacterial metal transporters belong to the cluster 9 family of ABC transporters, which mainly transport zinc and manganese and which have been found in nearly all bacterial species. This high-affinity zinc-uptake system consists of the periplasmic binding protein ZnuA, the membrane permease ZnuB, and the ATPase ZnuC [45]. Most of the system of membrane transport mechanisms are controlled at the level of transcription and are mediated by metal-responsive regulators, which modulate expression of genes in response to respective substrate concentrations. Hence, the cellular level of loosely bound, labile Zn(II) is sustained at close to required levels in conditions of either metal ion limitation or excess [36].
2.5. N
ANOPARTICLES2.5.1. Properties
Nanoparticles are generally defined as clusters of atoms in the size range of 1-100 nm and they show distinct properties of their bulk equivalents. They usually contain 20-15 000 atoms and can be produced from different materials in different shapes such as spheres, rods, wires and tubes (Fig. 8) [46].
Some properties of nanoparticles remain unchanged from their bulk material equivalents. However, many other properties change as particle size decreases. A nanoparticle may have similar properties of their bulk equivalent and as well of their molecular precursors, due to its small size, therefore high surface area, and size-dependent properties (classical vs. quantum mechanics) [47].
The chemical composition of the particles will affect their physicochemical properties and the core and the surface may be different. To determine nanoparticle composition, there are many techniques which can be used. Raman Spectroscopy, Inductively Coupled Plasma
15 - Optical Emission Spectrometry (ICP-OES), X-Ray Diffraction (XRD; for crystalline samples), and Fourier-Transform Infrared Spectroscopy (FTIR) are examples of such techniques [47].
Size is the key parameter for nanoparticles but it is not constant and is affected by the surrounding environment. For example, the size in the dry state may be very different from the one in a solvent, and different solvents impact size differently [48]. Although nanoparticles do not generally have a spherical shape, their size is usually defined as the diameter of a sphere [49].
The particle size distribution (PSD), i.e. the range of sizes of particles within a sample, gives an indication of the aggregation/agglomeration state of the nanoparticles [47]. There are several techniques which can be used to evaluate the PSD: Electron Microscopy (TEM and SEM), and Dynamic Light Scattering (DLS) are examples of such techniques. Electron Microscopy is more adequate for samples in the dry state because it is not influenced by solvent effects. DLS is a more adequate technique for solution studies, since it takes into account the environment [47]. Further details will be given in how to use DLS (Section 2.6.1).
Nanoparticles present some limitations often related to their small size. Of particular importance is their instability over longer storage periods as they tend to agglomerate. This agglomeration reduces the high surface area to volume ratio, which may lead to the loss of their properties [50]. This formation of agglomerates is partly driven by van der Waals interactions. Agglomerations can also be formed due to increasing the particle concentration or changing the pH or ionic strength of the solvent [47]. This tendency for agglomeration can be explained by the difference in the thermodynamics of bulk materials and nanoparticles [51]. The free energy of the system (ΔG) is dependent on the material surface energy (ΔGs)
and the free energy per unit volume (ΔGv):
In nanoparticles, ΔGs is high and ΔGv is low, which makes the system free energy
greater for a nanoparticle than for the bulk material of identical chemical composition. Thus, in order to reduce the system free energy, nanoparticles tend to agglomerate. Also, this higher system free energy affects many properties of the material, such as melting points and the crystallographic structure of nanoparticles [47]. This difference in thermodynamic properties is mainly due to the nanoparticle‟s high radius of curvature and high surface area and surface free energy [49].
16 2.5.2. Synthesis
The synthesis of metallic nanoparticles can be divided into two alternative methods: the “bottom-up” approach and the “top-down” approach (Fig. 9). “Bottom-up”, can refer to self-assembly, i.e. the construction of a structure atom-by-atom, molecule-by-molecule, or cluster-by-cluster, in which the nanostructured building blocks are firstly formed and then assembled into the final material using chemical or biological procedure(s) for synthesis [52]. The formation of nanoparticles from atoms goes through two processes: (1) formation of primary particles and (2) agglomeration between the newly formed primary particles, which allow the formation of nanostructures [53]. This approach has an advantage of enhancing the possibility of obtaining metallic nanoparticles with comparatively lesser defects and more homogeneous chemical composition(s). In the “top-down” approach, the starting material is reduced in size using physical or chemical means. However, this approach has the disadvantage of producing structures with some imperfections in their surface, which can have a significant impact on physical properties and surface chemistry [52].
Fig. 9 – Diagram of how bottom-up and top-down approaches are processed [54].
The preparation of metal nanoparticles can also be categorized as a physical or a chemical approach. Physical strategies utilize methods such as inert gas condensation or laser ablation. With the inert gas condensation (IGC) method, a resistive source is used to evaporate the material at a low pressure of a non-reactive gas. Collisions among the material molecules lead to homogeneous nucleation and growth of nanoparticles, which can be collected onto a cold surface. Laser ablation is another physical method that involves the generation of nanoparticles by laser ablating a solid target that lies in a gaseous or a liquid environment and the nanoparticles are collected in the form of nanopowder or a colloidal solution [55]. One disadvantage of most of the physical processes is that the production rate of nanoparticles is quite low and also that these processes are highly expensive [56]. They
17 also lead to an enormous consumption of energy to maintain the high pressure and temperature used in the synthesis processes [52]. Chemical strategies rely on the metal ions in solution in conditions that allow the formation of small metal cluster or aggregates. The nanoparticles can be stabilized by using surfactants or ligands.
The production of copper and zinc nanoparticles can use either chemical or physical methods. However, most synthesis strategies for copper nanoparticles production rely on chemical methods. The application of the nanoparticles has to be taken into account when choosing the method of synthesis. For instance, when producing nanoparticles for biomedical applications (e.g., antimicrobial), the end product has to be as less toxic as possible for human cells.
2.5.3. Mechanisms of antimicrobial action
One of the antimicrobial mechanisms of action of nanoparticles is the perforation of the cell wall. In fact, copper oxide (CuO; Cu(II)) nanoparticles (1-10 nm) have shown antibacterial activity against E. coli and S. aureus and the interactions between nanoparticles and bacteria resulted in perforation of the cell wall. They also can show some selectivity, since that, in this case, the effect was more pronounced against the gram-negative organisms (E. coli). Also, the effect did not depend on the acquisition of resistance against antibiotics (studies were carried out on both antibiotic resistant and non-resistant strains of gram-negative bacteria). The higher effect on gram-negative bacteria may be due to the higher interaction between cell wall and nanoparticles by electrostatic forces [57].
Zerovalent copper nanoparticles (Cu0) of 12 nm have been synthesized, using inert gas condensation, and their antibacterial activity was tested. The test was carried out against E. coli and it was observed that there was a reduction in CFUs (colony forming units) with increasing copper nanoparticle concentration in the growth medium. Also, as the surface of the bacteria was visualized by scanning electron microscopy, it was observed that after the interaction between bacteria and copper nanoparticles, the surface of the bacteria had some cavities and pits. These results were attributed to the opposite charges of bacterial cell wall (negative) and copper ions released from nanoparticles (positive) leading to adhesion between them. More copper ions might have been allowed to enter the bacteria due to the fact that E. coli are gram-negative bacteria [58].
Copper nanoparticle antibacterial activity may also be due to penetration inside bacteria, where they are likely to produce damage by interacting with phosphorus and sulphur containing compounds, such as deoxyribonucleic acid (DNA), because they have high affinity with such compounds [58]. The antibacterial mechanism of copper nanoparticles has been attributed to the fact that Cu2+ ions leached from nanoparticles are absorbed by
18 bacteria when the nanoparticle concentration is high enough. Copper ions are absorbed onto the bacterial cell surface, damaging the cell membrane by solidifying protein structure or altering enzyme function [59]. Cu2+ ions entering cells combine strongly with intracellular amino acids and proteases, resulting in degeneration that leads ultimately to the denaturation of proteins [23]. Under physiological conditions, the intracellular enzyme activity of bacteria treated with copper nanoparticles is believed to increase, suggesting that permeability of the cell membrane also increased, resulting in bacterial injury. From these results, it is believed that the binding of copper ions to the bacterial cell surface plays an important role in the bactericidal activity [60].
The study of the effect of ZnO nanofluids against E. coli showed they have bacteriostatic activity against these bacteria. The antibacterial activity increased with increasing particle concentration and decreasing particle size. Scanning electron microscopy (SEM) analysis of the bacteria before and after treatment with ZnO nanofluids showed that the presence of ZnO particles causes damages to the membrane wall of the bacteria. Such damage may be partly due to direct interaction between ZnO nanoparticles and the bacterial surface. Therefore ROS generated by ZnO particles could be part of the mechanism for damaging bacteria [61]. Another study of the toxicological impact of ZnO nanoparticles against E. coli has been carried out. E. coli cells were damaged and the cell contents may have leaked out. It was also observed that there was cellular internalization of these nanoparticles and cell wall disorganization [62].
Although most of the time ZnO nanoparticles seem to be only bacteriostatic, a study of Campylobacter jejuni showed that ZnO has a bactericidal effect. The results showed that
C. jejuni was extremely sensitive to treatment with ZnO nanoparticles of ~30 nm. It was
possible to see that cell morphology, membrane integrity, and gene expression in these bacteria were affected by ZnO nanoparticles. A dramatic change in the cell morphology was revealed, by showing the dominance of coccoid forms in the treated cells while the untreated remained spiral. In addition to this change in structure, ZnO nanoparticles resulted in the formation of irregular cell surfaces and “bubbles” in the membrane, an increase in membrane permeability, and a substantial increase in oxidative stress gene expression. This resulted in the inhibition of cell growth and eventually in cell death [63].
2.6. C
HARACTERISATION TECHNIQUES2.6.1. Dynamic Light Scattering
Dynamic light scattering (DLS) is a technique used to measuring the size of particles, typically in the sub-micron region. DLS is based on the scattering of light by moving
19 particles, i.e. it measures Brownian motion and relates it to the size of particles. Brownian motion is the random movement of particles due to the bombardment by the solvent molecules that surround them. The larger the particles, the slower the Brownian motion will be. Smaller particles are „kicked‟ further by the solvent molecules and move more rapidly .
The velocity of the Brownian motion is defined by the translational diffusion coefficient (D) and that is what is measured in DLS. If the particles are spherical and do not interact, their radius can be calculated from the diffusion coefficient by the Stokes-Einstein equation:
Where k is the Boltzmann‟s constant, T is the absolute temperature, η is the viscosity, and R the radius of the scatterers [65]. The translational diffusion coefficient will depend not only on the size of the particle “core”, but also on any surface structure, as well as the concentration and type of ions in the medium. The measurement of D is carried out by measuring the rate at which the intensity of the scattered light fluctuates when detected using a suitable optical arrangement. DLS works by having particles (for example in a cuvette), which are illuminated by a laser and then a screen is used to view the sample cell . The end result is then a size distribution by volume (Fig. 10).
2.6.2. Zeta potential
The zeta potential (ζ potential) is the electrostatic potential on the surface of a particle. Although particles may be electrically charged, the charge on the surface of each particle is counterbalanced by ions of opposite charge in the surrounding solution [66]. Thus, the liquid layer surrounding the particle has two regions; an inner region (Stern layer) where Fig. 10 – Size distribution graph obtained in for copper nanoparticles produced in the current project (n=3). In this
20 the ions are strongly bound and an outer (diffuse) region where they are less firmly associated. When the charges on the particle surface are attached the diffuse layer stretches out for some distance from the particle surface (Fig. 11). The surface that separates the bound charge from the diffuse charge around the particle marks where the solution and the particle move in opposite directions when an external field is applied. The electrostatic potential at this boundary (surface of hydrodynamic shear) is the zeta potential [66].
Fig. 11 – Distribution of charge around a negatively charged particle [67].
The magnitude of the zeta potential gives an indication of the potential stability of the colloidal system. If all the particles in suspension have a large negative or positive zeta potential then they will tend to repel each other and there will be no tendency for the particles to agglomerate [66]. Thus, the knowledge of the zeta potential can be used to optimize the formulations of suspensions.
A consequence of the existence of electrical charges on the surface of particles is that they interact with an applied field. When an electric field is applied across an electrolyte, charged particles are attracted towards the electrode of opposite charge. The particles move with constant velocity depending on the strength of the electric field or voltage gradient, the dielectric constant of the medium, the viscosity and the zeta potential. The velocity of a particle in a unit electric field is referred to as its electrophoretic mobility. Zeta potential is related to the electrophoretic mobility by the Henry equation:
![Fig. 2 – Structure of the cell wall from both gram-positive and gram-negative bacteria [8]](https://thumb-eu.123doks.com/thumbv2/123dok_br/15994333.1103121/18.892.208.690.551.805/fig-structure-cell-wall-gram-positive-negative-bacteria.webp)

![Fig. 19 - Particle size distribution at various pH‟s during the synthesis of copper oxo-hydroxide ([Cu]=20 mM) in the presence of tartaric acid (20 mM) and glucuronic acid](https://thumb-eu.123doks.com/thumbv2/123dok_br/15994333.1103121/47.892.147.753.207.504/particle-distribution-various-synthesis-hydroxide-presence-tartaric-glucuronic.webp)
![Fig. 25 - Particle size distribution at various pH‟s during the synthesis of copper oxo-hydroxide ([Cu]=40 mM) in the presence of tartaric acid (20 mM) and adipic acid (20mM) (A) 7.0; (B) pH 8.0](https://thumb-eu.123doks.com/thumbv2/123dok_br/15994333.1103121/51.892.149.744.125.560/particle-distribution-various-synthesis-copper-hydroxide-presence-tartaric.webp)


![Fig. 31 – Copper phase distribution (%) with varying pH during the synthesis of copper oxide ([Cu]=40 mM) in the presence of tartaric acid (80 mM) under heating](https://thumb-eu.123doks.com/thumbv2/123dok_br/15994333.1103121/55.892.147.745.104.401/copper-distribution-varying-synthesis-copper-presence-tartaric-heating.webp)