www.atmos-chem-phys.net/14/4607/2014/ doi:10.5194/acp-14-4607-2014
© Author(s) 2014. CC Attribution 3.0 License.
Atmospheric
Chemistry
and Physics
Global risk from the atmospheric dispersion of radionuclides by
nuclear power plant accidents in the coming decades
T. Christoudias1, Y. Proestos1, and J. Lelieveld1,2
1The Cyprus Institute, Nicosia, Cyprus
2Max Planck Institute of Chemistry, Mainz, Germany
Correspondence to:T. Christoudias (christoudias@cyi.ac.cy)
Received: 21 August 2013 – Published in Atmos. Chem. Phys. Discuss.: 19 November 2013 Revised: 28 February 2014 – Accepted: 25 March 2014 – Published: 13 May 2014
Abstract.We estimate the global risk from the release and
atmospheric dispersion of radionuclides from nuclear power plant accidents using the EMAC atmospheric chemistry– general circulation model. We included all nuclear reac-tors that are currently operational, under construction and planned or proposed. We implemented constant continuous emissions from each location in the model and simulated at-mospheric transport and removal via dry and wet deposition processes over 20 years (2010–2030), driven by boundary conditions based on the IPCC A2 future emissions scenario. We present global overall and seasonal risk maps for poten-tial surface layer concentrations and ground deposition of ra-dionuclides, and estimate potential doses to humans from in-halation and ground-deposition exposures to radionuclides. We find that the risk of harmful doses due to inhalation is typically highest in the Northern Hemisphere during boreal winter, due to relatively shallow boundary layer development and limited mixing. Based on the continued operation of the current nuclear power plants, we calculate that the risk of radioactive contamination to the citizens of the USA will re-main to be highest worldwide, followed by India and France. By including stations under construction and those that are planned and proposed, our results suggest that the risk will become highest in China, followed by India and the USA.
1 Introduction
A nuclear accident is defined by the International Atomic En-ergy Agency (IAEA) as a radiation release event that leads to significant consequences for people, the environment or the nuclear facility where it occurs. Examples include harmful doses to individuals, radioactive contamination of the soil,
and nuclear reactor core melts, leading to a major release of radioactivity with widespread consequences. Accidents at civilian nuclear power plants, in particular, can have major and far-reaching environmental and societal impacts, being the subject of intense public debate about electrical power supply. It is a requisite to assess the radioactivity contam-ination risk to facilitate preparedness and mitigation strate-gies, advise stakeholders and decision-makers, and inform the public to discuss policies on energy, safety and the envi-ronment at national-, regional- and global levels.
The IAEA International Nuclear Event Scale (INES) uses a numerical rating from 1 to 7 to categorise the significance of nuclear or radiological events in order to facilitate public understanding. INES levels consider three areas of impact: people and the environment, radiological barriers and con-trol, and defense in depth. The scale is designed so that the severity of an event is about an order of magnitude greater for each increase in level. Thus far there have been two severe nuclear disasters (in Chernobyl, Ukraine, and Fukushima, Japan), categorised as level 7 (major accidents) on the INES scale, and more than 20 recent accidents categorised as level 4 and above, in other words, having at least local conse-quences.
Ten Hoeve and Jacobson (2012) performed a simula-tion of a hypothetical accident at the Diablo Canyon power plant in California, USA, using emissions comparable to the Fukushima accident, to analyse the influence of seasonality and location on the accident impact. They find that it may cause∼25 % more fatalities than in Japan, despite having
one-fourth the population density, due to the different mete-orological conditions.
Arnold et al. (2012, flexRISK) assessed the regional geo-graphical distribution of the risk due to severe accidents at nuclear facilities, focussing on nuclear power plants (NPP) in Europe. They take into account source terms and accident frequencies to simulate the large-scale dispersion of radionu-clides in the atmosphere for 88 nuclear sites through a total of about 2800 meteorological conditions over a 10-year period (2000–2009) using the Lagrangian particle dispersion model FLEXPART (Stohl et al., 1998), driven by operational mete-orological data from the European Centre for Medium-Range Weather Forecasts (ECMWF) at 0.75◦(∼75 km) resolution. Simulation results are used to calculate regional dose levels and limits for Europe.
The present paper both extends and complements the work of these previous studies. We included all nuclear power plants worldwide that are currently operational (OP), un-der construction (UC) and planned or proposed (PL), based on the nuclear power plant (NPP) database compiled and published by the World Nuclear Association (WNA). In our simulations we implemented constant continuous emissions from each NPP location, and compute atmospheric transport and removal over 20 years (2010–2030) to account for cli-matological representativeness. We use boundary conditions prescribed by a future intermediate climate change scenario, in order to produce global overall and seasonal risk maps for potential surface layer concentrations and ground deposi-tion. Furthermore, we estimated worldwide potential human doses from the inhalation of gaseous radioactivity and the exposure to deposited aerosol radionuclides. The dose from air-submersion is many times lower than the dose from in-halation.
2 Model simulations
The ECHAM/MESSy Atmospheric Chemistry (EMAC) model is a numerical chemistry and climate simulation system that includes sub-models describing tropospheric and middle-atmosphere processes and their interaction with oceans, land and human influences (Jöckel et al., 2010). It uses the second version of the Modular Earth Submodel Sys-tem (MESSy2) to link multi-institutional computer codes. The core atmospheric model is the fifth generation Euro-pean Centre Hamburg general circulation model (ECHAM5; Roeckner et al., 2006). For the present study we applied EMAC (ECHAM5 version 5.3.02, MESSy version 2.42p2) to the T106L31 resolution, that is, with a spherical truncation
of T106 (corresponding to a quadratic Gaussian grid of ap-proximately 1.1 by 1.1◦in latitude and longitude, or 110 km) with 31 vertical hybrid pressure levels up to 10 hPa. The surface (skin) temperatures and sea ice distribution for the IPCC (Intergovernmental Panel on Climate Change, 2007) A2 emissions scenario (Nakicenovic and Swart, 2000) be-tween the years 2010 and 2030 were used as boundary con-ditions.
The applied model setup comprises the submodels RAD4ALL for radiation and atmospheric heating processes, CLOUD for cloud formation and microphysical processes in-cluding precipitation, and CONVECT for the vertical trans-ports of trace species associated with convection. The DRY-DEP (Kerkweg et al., 2006) and SCAV (Tost et al., 2006, 2007) submodels were used to simulate aerosol dry and wet deposition processes, respectively. The SEDI submodel was used to simulate particle sedimentation, of which the results will be presented below as part of the simulated dry deposi-tion. The TREXP (Tracer Release EXperiments from Point sources) submodel (Jöckel et al., 2010) was used to define tracers and emission sources.
Our model setup was tested using estimated emissions from the Fukushima Dai-ichi Nuclear Power Plant accident and comparing surface layer concentrations of radionuclides against measurements by the Comprehensive Nuclear-Test-Ban Treaty Organisation (CTBTO) global monitoring sta-tion network. The results were published in Christoudias and Lelieveld (2013). In that study, the model transport mech-anism was evaluated using the inert radionuclide 133Xe as
a passive transport tracer of contaminated air with good agreement between modelled estimates and observations at all stations. For the case of aerosol 137Cs, the comparison
was less favourable, though not systematically biased, within the uncertainties of the source estimates and in the modelling of atmospheric transport and removal. The model systemat-ically underestimated the131I observations, however, within
the upper bound of the uncertainty range indicated by the emission source estimate. Again, apart from the131I source
term, the results were not systematically biased, indicating reasonable agreement. Furthermore, the results of the model that calculated global radioactivity deposition patterns were shown to be in agreement with comparable studies. Our study of the fallout from the Fukushima nuclear accident serves as a proof of principle and provides a reference for our model when evaluating the results of the present study.
3 Emissions
We focus on the radionuclides that are emitted as gases and partly attached to ambient aerosol particles: the semi-volatile isotopes of iodine 131I (which has a half-life of 8 days)
and caesium 137Cs (which has a half-life of ∼30 years).
and agricultural products (Anspaugh et al., 1988) and subse-quent inhalation and ingestion through the food chain.
The low-volatile caesium isotope 137Cs is modelled
as-suming that it is incorporated in water-soluble aerosol with a standard log-normal distribution with a mean ra-dius of 0.25 µm and a Henry’s law coefficient equal to 1.0 mol L−1atm−1 and a density of 1000.0 kg m−3, as in
Christoudias and Lelieveld (2013). Due to the long decay half-life of137Cs compared to the relatively short timescales
of the atmospheric removal processes considered, its radioac-tive decay is not taken into account in the simulation, and it is removed from the atmosphere predominantly through pre-cipitation (small-scale convective and large-scale stratiform), and to a lesser extent (5–10 %) through dry deposition and particle sedimentation.
The iodine isotope131I is treated as being purely in the gas
phase in our model, and is removed from the atmosphere via radioactive decay. This allows for the reduction of compu-tational complexity and for the direct comparison of gaseous and aerosol components of radioisotopes. It is also a valid ap-proximation, as the atmospheric gaseous to particulate frac-tion is estimated to be close to a factor of four by a number of relevant measurements:
– The “Ring of Five”, an informal network of
Euro-pean national authorities (with more than 150 sam-pling systems of high volume samplers and activated coal traps), report that the average gaseous/total ratio for131I is 77.2±13.6 % (Masson et al., 2011).
– The US Environmental Protection Agency (EPA)
Rad-Net stations detected 81 % of the ambient131I in the
gas and 19 % in the particle phase (Ten Hoeve and Ja-cobson, 2012).
– These values are in good agreement to the average
val-ues reported for the Chernobyl accident by Hilton et al. (1991) and the 71±11 % average reported near the
Fukushima site (Stoehlker et al., 2011).
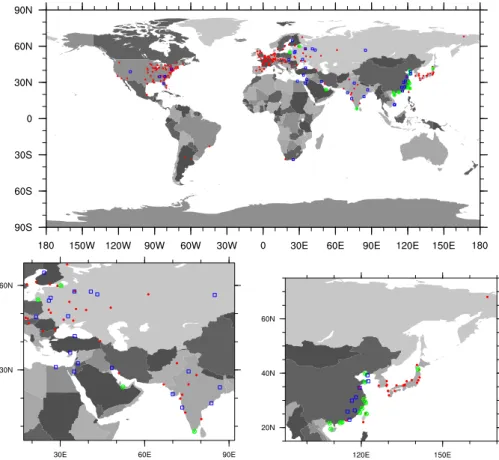
Based on the World Nuclear Association (WNA) nuclear power plant database, we account for a total of 241 emis-sions sites around the world: 189 operational nuclear power plants (each with one or multiple reactors), 16 currently un-der construction and 36 that are planned or proposed to be constructed. The geographical distribution of emission sites by operational status is shown in Fig. 1, and they are listed by country in Table 1. As can be seen, the vast majority of NPPs is located in the Northern Hemisphere, with the highest density clusters in the eastern United States, west-ern Europe, and southeast China. The tracer release points are at a pressure level of 1000 hPa for all sites. Hence, we do not account for explosive release or plume rise due to fires. Regarding the temporal distribution, the tracers are emitted continuously throughout the simulated period to allow for a probabilistic risk assessment under all possible
meteorologi-Table 1.Number of operational, under construction and planned
nuclear power stations included in our model per country, based on the WNA reactor database.
Country Code Operational Construction Planned
Argentina AR 2
Armenia AM 1
Belarus BY 1
Belgium BE 2
Brazil BR 1
Bulgaria BG 1
Canada CA 1
China CN 3 10 8
Czech Republic CZ 2
Egypt EG 1
Finland FI 2 1
France FR 19
Germany DE 12
Hungary HU 1
India IN 6 1 5
Iran IR 1 1
Japan JP 16 1
Jordan JO 2
Lithuania LT 1
Mexico MX 1
Netherlands NL 1
Pakistan PK 2
Romania RO 1
Russia RU 9 2 4
Slovakia SK 2 1
Slovenia SI 1
South Africa ZA 1 1
South Korea KR 4
Spain ES 5
Sweden SE 3
Switzerland CH 4
Taiwan TW 3 1
Turkey TR 2
Ukraine UA 4 1
UAE AE 1
UK GB 8
United States US 65 5
Vietnam VN 2
Total 189 16 36
cal conditions. Spin-up effects at the beginning of the simu-lation are neglected as they occur at timescales much shorter than a decade, and the atmospheric residence times of both gaseous and aerosol radionuclides included in our model are of the order of a few days due to removal via radioactive de-cay or deposition processes.
The 20-year constant continuous emission source from each nuclear power plant has been normalised to 1 PBq in total, being a small fraction of the release expected from a major (INES 7) accident. To obtain a realistic calcula-tion of radioactivity distribucalcula-tions and deposicalcula-tion, our re-sults can be scaled by realistic emissions (e.g. 1760 PBq131I
and 85 PBq137Cs from Chernobyl (International Atomic
Fig. 1.Geographical distribution of emission sites corresponding to nuclear power plants that are operational (red circles), under construction
(blue squares) and planned or proposed (green crossed circles). Source: World Nuclear Association (WNA) reactor database.
obtain the overall probabilistic risk, one would also need to account for the accident and emission risk of each individ-ual plant or an average risk of all plants, which is specula-tive, as such information is not publicly available (Lelieveld et al., 2012, 2013). Therefore, the results presented here com-pare the relative impacts of different radioactivity emission sources based on meteorological conditions rather than the risks of individual nuclear power plant accidents, as we as-sume the same source for each plant, regardless of local ac-cident risk factors, number of reactors, capacity, etc.
4 Results
We present the modelled global concentrations in the surface layer (centred around 30 m above the surface) and ground deposition in Sect. 4.2, and the corresponding risk factors and effective committed doses from direct inhalation or due to resuspension from remaining on contaminated ground in Sect. 4.1.
4.1 Doses from inhalation and ground deposition
Radiation absorption doses by the human population are measured in units of Sievert (Sv), taking into account the
relative biological impacts of ionising radiation, since each type of radiation has a different effect on living tissue. We estimated the potential of cumulative committed doses to the population due to inhalation and the lifetime effective doses (over a 50-year period) from ground contamination by apply-ing conversion factors for137Cs and131I as recommended by the IAEA (IAEA, 2009, Appendix I), also considering resuspension, weathering and ground roughness. The134Cs
concentration and deposition rate in each model grid cell has been calculated by scaling to137Cs, assuming an134Cs
to137Cs activity ratio of 0.9, based on observations by the
CTBTO as reported in Ten Hoeve and Jacobson (2012). The contribution by noble gases, such as133Xe, can be neglected
as the dose ratios relative to131I are effectively zero.
The inhalation doses are converted from model-calculated concentrations (Bq s m−3) into Sv, applying factors of 1.29×
10−11, and 2.44×10⁻¹²for137Cs, and131I, respectively. It
can be assumed that food intervention measures will prevent significant doses to the population due to the ingestion of radionuclides (IAEA, 2009, Appendix I), and thus internal dosages from ingestion are not included in our calculations. The effective dose to the public from exposure to ground contamination due to the deposition of137Cs,134Cs and131I
obtained by converting deposited radioactivity in Bq m−2 into an effective dose in Sv, using the factors 1.30×10⁻⁷,
5.10×10⁻⁹and 2.70×10⁻¹⁰ for137Cs,134Cs and131I,
re-spectively (IAEA, 2009). The effects of137Cs provide the
dominant component of the 50-year effective dose, with131I
and134Cs contributing to a much lesser extent. The
sensitiv-ity of these dose estimates to the radionuclide132Te is
ex-pected to be low, taking into account for example a radioac-tivity ratio of131I:(131I+132Te):134Cs:137Cs=1:2:0.1:
0.1 (Katata et al., 2011), as measured after the Fukushima
Dai-ichi accident, while the dose factors from inhalation and deposition are at least three orders of magnitude lower.
4.2 Global surface concentration and deposition
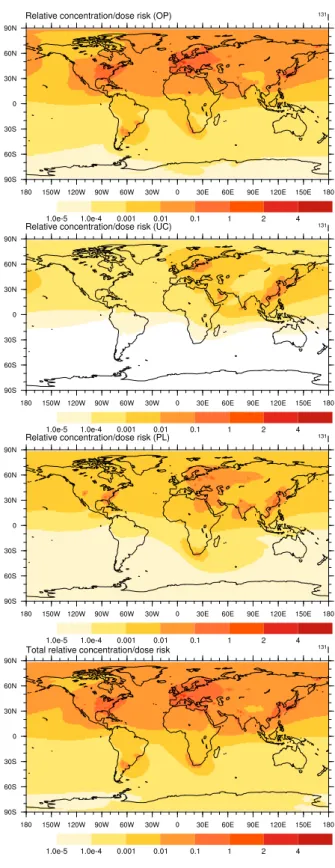
The global mean (for the period 2010–2030) gaseous131I
concentration relative risk from operating, under construc-tion, and planned nuclear power plants is shown in Fig. 2. To estimate the expected concentration risk, we present the surface layer concentration based on the release of 1 PBq per station.
For the operational plants, as can be expected consider-ing their locations, the combined total concentration is high-est in the mid-whigh-estern and eastern United States, Japan and most of the continent of Europe, with a maximum in south-western Germany. Northern Europe and the eastern coast of China have the highest concentrations from power plants that are under construction. For the planned stations, a more uni-form distribution throughout the Northern Hemisphere is cal-culated, with the highest levels in the eastern USA, east-ern Europe, the Middle East, India and easteast-ern China. For all cases, the concentrations in the Southern Hemisphere are much lower, because of the low density of stations and the relatively short lifetime of the tracer which does not allow it to mix globally.
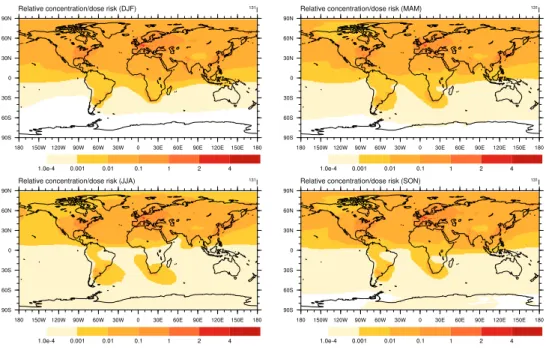
The concentration levels, and hence the expected risk from atmospheric dispersion and potential dose rates also exhibit seasonal variability (Fig. 3). In particular, levels close to the ground in the Northern Hemisphere, where the highest num-ber of nuclear reactors are located, show increased concen-trations in magnitude and geographical extent in the boreal winter, compared to the summer season. Concentrations are lower during summer, especially within the Arctic circle, cor-responding to lower potential risk. The seasonal climatolog-ical mean surface layer concentrations of131I radionuclides
are shown in Fig. 3. The surface level concentrations of137Cs
follow a similar seasonal tendency. The total mass of aerosol
137Cs in the atmosphere is lower in the winter months and
higher during summer, due to stronger removal, predomi-nantly via wet deposition. Although iodine is modelled in the gas phase, making the atmospheric load much less dependent on deposition processes, it nevertheless follows a yearly cy-cle. In winter the horizontal advection is relatively efficient due to strong winds, and the mean concentrations are highest
Fig. 2.Top to bottom: operating, under construction, planned or
Fig. 3.Relative risk of seasonal total (includes operational, under construction, planned power plants)131I mean surface layer concentration, and equivalent effective dose to the public from inhalation, averaged over the years 2010–2030.
near the surface due to the reduced vertical development of the boundary layer.
To illustrate the effects of temporal variability we present the coefficient of variation (defined as the regional tempo-ral standard deviationσ over the meanµ) in Fig. 4. It can
be seen that the overall variability is within 5% , with the highest values in the Southern Hemisphere, dominated by the potential emissions by South African nuclear power plants, in any case not exceeding 20 %. The relatively small over-all magnitude of the coefficient of variation signifies that the 20-year time period chosen is adequate for our analysis and that the interannual variability is appropriately represented, being well within the uncertainties of the model results (cf. Christoudias and Lelieveld, 2013).
The global total cumulative surface deposition of 137Cs
over the period 2010–2030 is shown in Fig. 5. As expected, the highest levels of deposition, corresponding to the highest risk of ground contamination and resulting doses to the pop-ulation, occur in the regions with the highest concentration of power plants – the eastern and mid-western United States, continental Europe and eastern China along the Pacific Rim. Relatively large deposition is expected to occur over land in the tropics because of wet deposition due to the heavy precip-itation, even though most of the emissions are released from NPPs in mid-latitudes in the Northern Hemisphere. This cor-roborates that the trade wind regime in the relatively dry sub-tropics forms an effective transport corridor of radioactivity from the extratropics.
The deposition risk is dominated by emissions from the operational stations, being highest in the eastern USA and southwestern Germany. Risks may be expected to increase
from stations under construction, in particular in eastern Asia, and to a lesser extent in Russia and central Europe, South Asia and central Africa. If all planned nuclear power plants would materialise, the risks in these regions would in-crease accordingly, in addition to the eastern USA and South Africa.
Results for the relative concentration, deposition and equivalent human population dose for each individual coun-try are provided in the Supplement accompanying our paper.
4.3 Relative population risk
The Fukushima nuclear accident has reignited the debate on the risks posed by nuclear power plants. Notably, Japan and Germany are considering to phase out the use of nuclear power plants for the production of electricity. Note that this has not been accounted for in the present study, as we follow the WNA reactor database. These decisions highlight that po-tential changes in the global nuclear energy sector happen at the national level and therefore we next quantify the risks for the population per country.
Fig. 4.Top to bottom: operating, under construction, and planned
or proposed nuclear power plant relative risk coefficient of variation (σ/µ), over the period 2010–2030.
available at a spatial resolution of 2.5 arc min, corresponding to∼5 km at the equator (CIESIN/CIAT/SEDAC, 2005). The
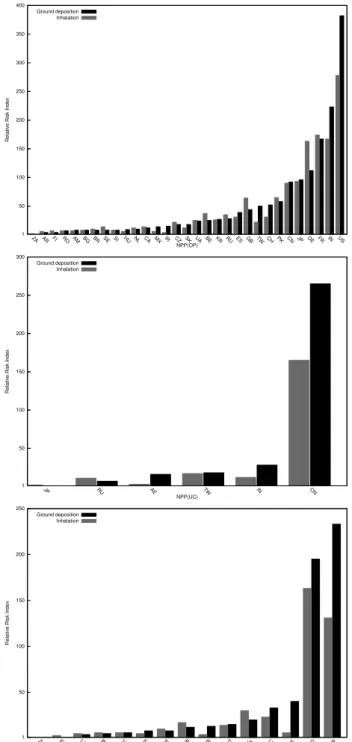
relative risks are shown in the bar charts of Fig. 6. It is appar-ent that the added risk from power plants that are presappar-ently under construction or planned to be built is concentrated in the region of Southeast Asia and dominated by the current and planned activities in China and India, and that the cur-rent relatively high risk in the USA will remain.
Examples on how to interpret the results in Fig. 6 are given below, again with the assumption that all nuclear power plants worldwide have the same accident probability, leading to the same emissions. Our calculations indicate that citizens of the USA have a 4 times higher risk of being exposed to radioactivity from current stations than those in Japan and China, and 13 times the people in Russia. In India, France and Germany, the risk for the population is 7.5, 6 and 4 times
Fig. 5. Top to bottom: operating, under construction, planned or
1 50 100 150 200 250 300 350 400
ZA AR FI RO AM BG BR SE SI HU NL CA MX IR CZ SK UA BE KR RU ES GB TW CH PK CN JP DE FR IN US
R el a ti ve R isk I n de x NPP(OP) Ground deposition Inhalation 1 50 100 150 200 250 300
JP RU AE TW IN CN
R el a ti ve R isk I n de x NPP(UC) Ground deposition Inhalation 1 50 100 150 200 250
ZA FI LT BY UA EG SK RU IR TR JO US VN CN IN
R el a ti ve R isk I n de x NPP(PL) Ground deposition Inhalation
Fig. 6.Relative risk to the human population from each country by
nuclear power plants in operation (top), under construction (bottom-left), and planned or proposed (bottom-right) calculated by integrat-ing the product of the dose from ground deposition (black) and in-halation (grey), and human population density assuming unit PBq emission per station. Population projections by the UN for the year 2025 were used. Table 1 lists the country codes.
that in Russia, respectively. In the future, also accounting for planned and proposed stations, the relative risk index in China, India and the USA will be 12, 10 and 8 times that in Russia, respectively. The relatively high risks in China and India are related to the large numbers of stations (Fig. 1) as well as the high population densities in their downwind en-vironment.
5 Summary and conclusions
The EMAC atmospheric chemistry–general circulation model was used to assess the risk from the atmospheric emission and transport of radionuclides from nuclear power plants. All nuclear reactors that are currently operational, un-der construction and planned or proposed were included in the model simulation based on the WNA reactor database. We simulated 20 years (2010–2030) to allow for climatic rep-resentativeness in the present and next decade, using model boundary conditions of surface (skin) temperature and sea ice concentration based on the IPCC A2 future emissions sce-nario.
We focus on the radionuclides that are emitted as gases and partly attach to ambient aerosol particles: the semi-volatile isotopes of iodine131I and caesium137Cs.137Cs is modelled
as a water-soluble aerosol, and due to the long decay half-life of137Cs, compared to the short timescales of the atmospheric removal processes considered, its radioactive decay can be neglected in the simulation.131I is modelled as a trace gas,
as the gas to particulate fraction in the atmosphere is approx-imately a factor of four, and it undergoes radioactive decay with a half-life of about 8 days.
The expected near-surface concentrations per unit atmo-spheric load of131I from each emission point in our model,
and hence the expected exposure risk factors and potential inhalation dose rates, exhibit seasonal variability, with the highest concentrations in the Northern Hemisphere during boreal winter. The total atmospheric load of aerosol 137Cs
also exhibits a yearly cycle, with lower values during boreal winter months, owing to higher removal rates from deposi-tion processes, notably through precipitadeposi-tion.
The risk factor is expected to increase in the future throughout the Northern Hemisphere, with the areas most af-fected being northern Europe, the Middle East and southeast-ern China (including Japan), when stations that are currently under construction become operational. A number of sta-tions that are presently planned or proposed to be built would further increase the risk over eastern Europe, the eastern Mediterranean, southeast China and the continental United States.
and the Pacific Rim of China. Relatively high deposition risk is expected over land in the tropics, even in regions with-out NPPs (Central America, Sub-Saharan Africa), because of wet deposition from upwind stations due to high rates of precipitation and effective transport from the mid-latitudes by the trade winds.
By combining our simulation results for the period 2010– 2030 with projected population data, and assuming that all nuclear power plants have the same accident and emission probability, it appears that the relative risk index to the citi-zens of the USA to be exposed to radioactive contamination from the current stations is relatively highest worldwide, fol-lowed by India, France, Germany, Japan and China. If the plants under construction and those planned and proposed also become operational, this order will change, and the high-est risk is expected to be in China, followed by India and the USA.
The Fukushima nuclear accident has ignited a debate on the safety of energy production using nuclear power in a number of countries. Notably, Japan is considering shut-ting down its reactors and Germany is phasing out its nuclear power plants within the next decade. However, even though this is expected to reduce the risk in the immediate vicin-ity of the plants significantly, there will still be significant risk from potential accidents in neighbouring countries, es-pecially those upwind, for example in China and France.
Based on our results, it is evident that the risk posed from nuclear power plant accidents is not limited to the national or even regional level, but assumes a global dimension. Many nations may be subjected to great exposure after severe ac-cidents, even ones that are not pursuing nuclear energy as a means of power production. It is thus important to continu-ously and scientifically quantify and assess the environmen-tal and human health risks in order to support preparedness and mitigation for the strategic planning and energy policies.
Supplementary material related to this article is available online at http://www.atmos-chem-phys.net/14/ 4607/2014/acp-14-4607-2014-supplement.pdf.
Acknowledgements. The research leading to these results has received funding from the European Research Council un-der the European Union’s Seventh Framework Programme (FP7/2007–2013)/ERC grant agreement no. 226144. This work was supported by the Cy-Tera Project, which is co-funded by the European Regional Development Fund and the Republic of Cyprus through the Research Promotion Foundation. The Climate Data Operators (CDO) (Schulzweida, 2013), netCDF operators (NCO) (Zender, 2013) and NCAR Command Language (NCL) (UCAR/NCAR/CISL/VETS, 2012) were used for data processing and visualisation.
Edited by: Y. Balkanski
References
Anspaugh, L., Catlin, R., and Goldman, M.: The global impact of the Chernobyl reactor accident, Science, 242, 1513–1519, 1988. Arnold, D., Gufler, K., Kromp, W., Kromp-Kolb, H., Mraz, G., Seibert, P., Sholly, S., Sutter, P., and Wenisch, A.: flexRISK – Flexible tools for assessment of nuclear risk in Europe, in: Air Pollution Modeling and its Application XXI, Springer, 737–740, 2012.
Christoudias, T. and Lelieveld, J.: Modelling the global atmospheric transport and deposition of radionuclides from the Fukushima Dai-ichi nuclear accident, Atmos. Chem. Phys., 13, 1425–1438, doi:10.5194/acp-13-1425-2013, 2013.
CIESIN/CIAT/SEDAC: Gridded Population of the World, Version 3 (GPWv3), available at: http://sedac.ciesin.columbia.edu/gpw (last access: 28 February 2014), 2005.
Hilton, J., Cambray, R., and Green, N.: Chemical fractionation of radioactive caesium in airborne particles containing bomb fall-out, Chernobyl fallout and atmospheric material from the Sell-afield site, J. Environ. Radioactiv., 15, 103–111, 1991.
International Atomic Energy Agency (IAEA): International Nuclear and Radiological Event Scale User Manual, IAEA, Vienna, 2009. Intergovernmental Panel on Climate Change: Climate Change 2007: the Physical Science Basis, in: The Properties of Gases and Liquids, 3rd Edn., edited by: Solomon, S., Qin, D., Man-ning, M., Chen, Z., Marquis, M., Averyt, K. B., Tignor, M., and Miller, H. L., IPCC Fourth Assassement report (AR4), Cam-bridge University Press, CamCam-bridge, UK and New York, NY, USA, 2007.
International Atomic Energy Agency (IAEA): Environmental Con-sequences of the Chernobyl Accident and Their Remediation: Twenty Years of Experience, IAEA, Vienna, 2006.
Jöckel, P., Kerkweg, A., Pozzer, A., Sander, R., Tost, H., Riede, H., Baumgaertner, A., Gromov, S., and Kern, B.: Development cycle 2 of the Modular Earth Submodel System (MESSy2), Geosci. Model Dev., 3, 717–752, doi:10.5194/gmd-3-717-2010, 2010. Katata, G., Terada, H., Nagai, H., and Chino, M.: Numerical
recon-struction of high dose rate zones due to the Fukushima Daiichi Nuclear Power Plant accident, J. Environ. Radioactiv., 111, 2–12, 2011.
Kerkweg, A., Buchholz, J., Ganzeveld, L., Pozzer, A., Tost, H., and Jöckel, P.: Technical Note: An implementation of the dry removal processes DRY DEPosition and SEDImentation in the Modu-lar Earth Submodel System (MESSy), Atmos. Chem. Phys., 6, 4617–4632, doi:10.5194/acp-6-4617-2006, 2006.
Lelieveld, J., Kunkel, D., and Lawrence, M. G.: Global risk of ra-dioactive fallout after major nuclear reactor accidents, Atmos. Chem. Phys., 12, 4245–4258, doi:10.5194/acp-12-4245-2012, 2012.
Lelieveld, J., Lawrence, M. G., and Kunkel, D.: Comment on “Global risk of radioactive fallout after major nuclear reactor accidents” by Lelieveld et al. (2012), Atmos. Chem. Phys., 13, 31–34, doi:10.5194/acp-13-31-2013, 2013.
Lecomte, M., Leon Vintro, L., Leppänen, A. P., Lind, B., Lu-janiene, G., Mc Ginnity, P., Mc Mahon, C., Malá, H., Ma-nenti, S., Manolopoulou, M., Mattila, A., Mauring, A., Mietel-ski, J. W., Møller, B., Nielsen, S. P., Nikolic, J., Overwater, R. M., Pálsson, S. E., Papastefanou, C., Penev, I., Pham, M. K., Povinec, P. P., Ramebäck, H., Reis, M. C., Ringer, W., Ro-driguez, A., Rulík, P., Saey, P. R., Samsonov, V., Schlosser, C., Sgorbati, G., Silobritiene, B. V., Söderström, C., Sogni, R., Solier, L., Sonck, M., Steinhauser, G., Steinkopff, T., Stein-mann, P., Stoulos, S., Sýkora, I., Todorovic, D., Tooloutalaie, N., Tositti, L., Tschiersch, J., Ugron, A., Vagena, E., Vargas, A., Wer-shofen, H., and Zhukova, O: Tracking of airborne radionuclides from the damaged Fukushima Dai-ichi nuclear reactors by Euro-pean networks, Environ. Sci. Technol., 45, 7670–7677, 2011. Nakicenovic, N. and Swart, R.: Special report on emissions
scenar-ios (SRES), A special report of working Group III of the Inter-governmental Panel on Climate Change, IPCC, Geneva, 2000. Roeckner, E., Brokopf, R., Esch, M., Giorgetta, M., Hagemann, S.,
Kornblueh, L., Manzini, E., Schlese, U., and Schulzweida, U.: Sensitivity of simulated climate to horizontal and vertical reso-lution in the ECHAM5 atmosphere model, J. Climate, 19, 3771– 3791, 2006.
Schulzweida, U.: CDO User’s Guide, version 1.6.0 [Software], MPI for Meteorology, Germany, available at: https://code.zmaw.de/ projects/cdo/wiki/Cdo#Documentation (last access: 28 February 2014), 2013.
Stoehlker, U., Nikkinen, M., and Gheddou, A.: Detection of ra-dionuclides emitted during the Fukushima nuclear accident with the CTBT radionuclide network, in: Monitoring Research Re-view: Ground-Based Nuclear Explosion Monitoring Technolo-gies, 715–724, 2011.
Stohl, A., Hittenberger, M., and Wotawa, G.: Validation of the La-grangian particle dispersion model FLEXPART against large-scale tracer experiment data, Atmos. Environ., 32, 4245–4264, 1998.
Ten Hoeve, J. and Jacobson, M.: Worldwide health effects of the Fukushima Daiichi nuclear accident, Energ. Environ. Sci., 5, 8743–8757, 2012.
Tost, H., Jöckel, P., Kerkweg, A., Sander, R., and Lelieveld, J.: Tech-nical note: A new comprehensive SCAVenging submodel for global atmospheric chemistry modelling, Atmos. Chem. Phys., 6, 565–574, doi:10.5194/acp-6-565-2006, 2006.
Tost, H., Jöckel, P., Kerkweg, A., Pozzer, A., Sander, R., and Lelieveld, J.: Global cloud and precipitation chem-istry and wet deposition: tropospheric model simulations with ECHAM5/MESSy1, Atmos. Chem. Phys., 7, 2733–2757, doi:10.5194/acp-7-2733-2007, 2007.
UCAR/NCAR/CISL/VETS: The NCAR Command Language (Ver-sion 6.0.0) [Software], Boulder, Colorado, available at: http://dx. doi.org/10.5065/D6WD3XH5 (last access: 28 February 2014), 2012.