Association of
IL10
Polymorphisms and
Leprosy: A Meta-Analysis
Lucia Elena Alvarado-Arnez1
*, Evaldo P. Amaral2, Carolinne Sales-Marques1, Sandra M. B. Durães3, Cynthia C. Cardoso1¤
, Euzenir Nunes Sarno1, Antonio G. Pacheco4, Francisco C. F. Lana2, Milton Ozório Moraes1
1Laboratório de Hanseníase, Instituto Oswaldo Cruz, Fiocruz, Rio de Janeiro, Brazil,2Departamento de Enfermagem Materno-Infantil e Saúde Pública, Universidade Federal de Minas Gerais, Belo Horizonte, Brazil,3Departamento de Medicina Clínica, Serviço de Dermatologia da Universidade Federal Fluminense, Rio de Janeiro, Brazil,4Programa de Computação Científica, Fiocruz, Rio de Janeiro, Brazil
¤ Current Address: Laboratório de Virologia Molecular, Departamento de Genética, Universidade Federal do Rio de Janeiro, Rio de Janeiro, Brazil
Abstract
Leprosy is a chronic infectious disease that depends on the interplay of several factors. Single nucleotide polymorphisms (SNPs) in host immune related genes have been consistently sug-gested as participants in susceptibility towards disease. Interleukin-10 (IL-10) is a crucial immunomodulatory cytokine in mycobacterial pathogenesis and especially the -819C>T SNP
(rs1800871) has been tested in several case-control studies indicating association with leprosy risk, although a recent consensus estimate is still missing. In this study, we evaluated the asso-ciation of the -819C>T SNP and leprosy in two new Brazilian family-based populations. Then,
we performed meta-analysis for this polymorphism summarizing published studies including these Brazilian family-based groups. Finally, we also retrieved published studies for other distal and proximalIL10polymorphisms: -3575 T>A (rs1800890), -2849 G>A (rs6703630), -2763 C>A (rs6693899), -1082 G>A (rs1800896) and -592 C>A (rs1800872). Results from meta-analysis supported a significant susceptibility association for the -819T allele, with pooled Odds Ratio of 1.22 (CI = 1.11–1.34) andP-value = 3x10⁻⁵confirming previous data. This result remained unaltered after inclusion of the Brazilian family-based groups (OR = 1.2, CI = 1.10– 1.31,P-value = 2x10⁻⁵). Also, meta-analysis confirmed association of -592 A allele and leprosy
outcome (OR = 1.24, CI = 1.03–1.50,P-value = 0.02). In support of this, linkage disequilibrium analysis in 1000 genomes AFR, EUR, ASN and AMR populations pointed to r2= 1.0 between
the -592C>A and -819C>T SNPs. We found no evidence of association for the otherIL10 poly-morphisms analyzed for leprosy outcome. Our results reinforce the role of the -819C>T as a tag SNP (rs1800871) and its association with leprosy susceptibility.
Introduction
Interleukin-10 (IL-10) is mainly secreted by monocytes and lymphocytes and exhibits an important immunomodulatory activity regulating mainly antibody secretion or inflammation, which if sustained could provoke tissue injury during chronic diseases [1].
OPEN ACCESS
Citation:Alvarado-Arnez LE, Amaral EP, Sales-Marques C, M. B. Durães S, C. Cardoso C, Nunes Sarno E, et al. (2015) Association ofIL10 Polymorphisms and Leprosy: A Meta-Analysis. PLoS ONE 10(9): e0136282. doi:10.1371/journal. pone.0136282
Editor:Fakir M Amirul Islam, Swinburne University of Technology, AUSTRALIA
Received:January 27, 2015
Accepted:August 2, 2015
Published:September 4, 2015
Copyright:© 2015 Alvarado-Arnez et al. This is an open access article distributed under the terms of the
Creative Commons Attribution License, which permits unrestricted use, distribution, and reproduction in any medium, provided the original author and source are credited.
Data Availability Statement:All relevant data are within the paper and its Supporting Information files.
Funding:LEAA is a postdoctoral fellow funded by CAPES and MS/SCTIE/Decit 12/2009.
Leprosy, caused by intracellular pathogenMycobacterium leprae, can only progress to active disease in a fraction of infected individuals. A sustained IL-10 production, although increases phagocytosis in macrophages can drive a permissive anti-microbial programming that leads to intracellularM.lepraereplication [2]. In fact, CD163+phagocytic phenotype is positively cor-related with higher IL-10 levels in disseminated lepromatous patients [2,3]. Among exposed household contacts with longer patient exposition a lower ratio of TNF/IL-10 was observed when compared to short term contacts [4].
Polymorphisms in theIL10promoter have been targeted of several case-control studies in an attempt to determine genetic markers that could associate to disease outcome [5]. The most common promoter polymorphisms include a distal group of three polymorphisms: -3575 T>A
(rs1800890), -2849 G>A (rs6703630), -2763 C>A (rs6693899), and three proximal
polymor-phisms: -1082 G>A (rs1800896), -819 C>T (rs1800871) and -592 C>A (rs1800872) [6].
The first meta-analysis ofIL10polymorphisms and association with leprosy was published in 2009 [7]. Several studies became available in the past few years testing other polymorphisms in the same gene as associated with leprosy. Our main purpose was to perform and updated meta-analysis on the -819 C>T polymorphism and include novel data based on transmission
disequilibrium tests and to evaluate otherIL10promoter polymorphisms using meta-analysis.
Material and Methods
Study subjects
We conducted two new association studies between the IL10–819 C>T (rs1800871)
polymor-phism and leprosy susceptibility using family-based study designs. The first family-based study included a total of 443 individuals comprising 80 families recruited from Duque de Caxias, an hyperendemic municipality of Rio de Janeiro state (RJ) [8]. The second family based study enrolled 447 individuals in 119 families from Almenara municipality in Minas Gerais state (MG) [9]. Both states are located in the Southeastern region of Brazil. Data and sample collec-tion protocols were accepted by local institucollec-tional review boards: Ethics Committee at Federal University in Rio de Janeiro state (HUCFF-UFRJ Protocol 187/04) and Ethics Committee at Federal University in Minas Gerais state (COEP-UFMG Protocol ETIC 454/10). All study par-ticipants provided written informed consent. Both familial samples included households of patients diagnosed with leprosy conformed mainly by trios formed by the index patient and their biological parents. Ethnicity of each subject was determined through morphological fea-tures and classified in either of three groups: Caucasoid, Mestizo and Black. General character-istics of both family-based studies are described inTable 1.
DNA extraction and SNP genotyping
We extracted DNA from frozen blood samples using a modified salting out procedure [10]. Genotyping forIL10–819 C>T (rs1800871) polymorphism was performed by real-time PCR
using TaqMan probes (Life Technologies, EUA) C___1747362_10 and following manufactur-er’s recommendations. We used 20–40 ng of DNA in each PCR reaction. Genotypes were determined by allelic discrimination in the StepOne real-time system software (Life Technolo-gies, EUA).
Literature search
Thomson Reuters Web of Science (http://wokinfo.com) and the Knowledge Resource Inte-grated Database from China—CNKI (http://www.cnki.net). Combinations of the keywords were used in the search as follows:“interleukin 10”and“leprosy”,“IL-10”and“leprosy”,“ poly-morphism(s)”and“leprosy”,“SNP(s)”and“leprosy”. Besides, when evaluating each article individually we also reviewed the reference lists and related citations suggested by Pubmed to broaden our results. We did not use specific SNP rs identification numbers to perform search. As inclusion criteria we considered studies if they were published up to February 2015 and pro-vided genotypic data to calculate allelic counts in order to perform analysis. Studies were excluded if they were related to a previous publication or if control population deviated from Hardy-Weinberg equilibrium (HWE).
Data extraction
Two authors (L.E.A.A. and E.P.A.) performed data extraction independently by following inclu-sion criteria as indicated above. The following information was recorded for each study: first author; year in which the study was published; the population that was evaluated; age and num-ber of females and males for both cases and controls; the ratio between multibacillary and pauci-bacillary for case subjects, source of control individuals (household contacts or blood bank donors); genotyping method and, finally, genotype counts for cases and controls (S2 Table).
Statistical analysis
Total genotypic counts for the -819 C>T polymorphism in the Brazilian family-based studies
were characterized by direct counting. Association with leprosy was evaluated with the
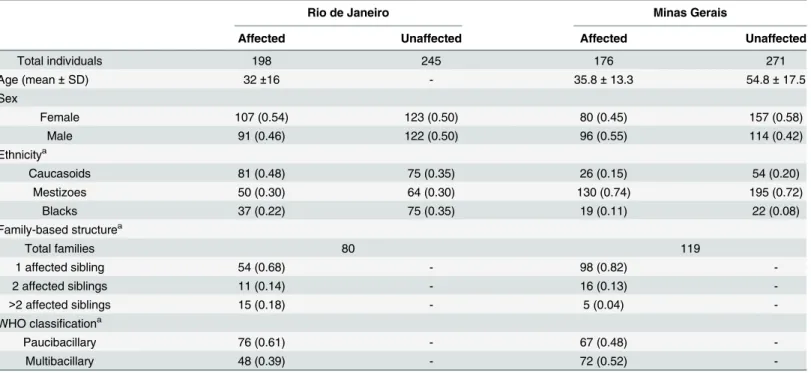
Table 1. Characteristics for the Brazilian family-based studies.
Rio de Janeiro Minas Gerais
Affected Unaffected Affected Unaffected
Total individuals 198 245 176 271
Age (mean±SD) 32±16 - 35.8±13.3 54.8±17.5
Sex
Female 107 (0.54) 123 (0.50) 80 (0.45) 157 (0.58)
Male 91 (0.46) 122 (0.50) 96 (0.55) 114 (0.42)
Ethnicitya
Caucasoids 81 (0.48) 75 (0.35) 26 (0.15) 54 (0.20)
Mestizoes 50 (0.30) 64 (0.30) 130 (0.74) 195 (0.72)
Blacks 37 (0.22) 75 (0.35) 19 (0.11) 22 (0.08)
Family-based structurea
Total families 80 119
1 affected sibling 54 (0.68) - 98 (0.82)
-2 affected siblings 11 (0.14) - 16 (0.13)
->2 affected siblings 15 (0.18) - 5 (0.04)
-WHO classificationa
Paucibacillary 76 (0.61) - 67 (0.48)
-Multibacillary 48 (0.39) - 72 (0.52)
-Abbreviations: SD, standard deviation; WHO, World Health Organization.
aData is presented as total counts (frequency). The number of subject counts in ethnicity and WHO classi
fication can differ from total individuals due to missing information.
transmission disequilibrium test (TDT), which tests for deviations of the expected 50% fre-quency of transmission of the marker allele from heterozygous parents to the affected off-spring. Whenever parental information was missing, we used sibling pairs to estimate
genotypes. Analyses were performed as previously described using the software FBAT, version 2.0.2 [8,11]. The proportion of the transmitted“risk”allele corresponding to the minor fre-quency allele (MA) was calculated with the tdthap package using R Software version 2.13.0.
Meta-analysis
First, for case-control studies retrieved from literature, we used a Chi-square test to determine if genotype frequencies in controls groups of each study were distributed conforming to HWE [12]. Then, we used the methodology proposed by Kazeem et al., (2005) for performing combined meta-analysis of case–control and family-based studies in which is possible to obtain OR values from family-based studies estimated from the proportion of the transmitted high risk allele [13]. For case-control studies we determined total counts and frequency for both the“risk”allele and
“non risk”allele. Publication bias was evaluated through Egger’s test in order to provide statistical evidence for funnel plot symmetry. Heterogeneity across studies was established by Cochran´s Q statistic. Pooled Odds Ratio (OR) estimates were obtained by DerSimonian and Laird random effects model in reference to the MA for each polymorphism. Concordantly, forest plots represent individual OR values for each study and pooled OR referring also to MA for the studied SNPs. In order to evaluate the influence of each study on the overall OR we performed sensitivity analyses in which one study is removed at a time. There was no adjustment for environmental effects or population stratification due to the lack of covariates to perform such analysis.
Specifically for rs1800871 (-819 C>T) we first conducted a meta-analysis considering only
published studies and next we conducted a second analysis including our newly generated data from both Brazilian family-based studies. We consideredP-valuesunder 0.1 as significant for both assessing heterogeneity across studies and funnel plot asymmetry. Finally, association of IL10polymorphisms with leprosy susceptibility was significant withP-values<0.05. R
Soft-ware version 2.13.0 with packages genetics, catmap and meta [14] were used for analyses.
Linkage disequilibrium (LD) analysis across populations
We extracted data from the 1000 genomes browser (http://browser.1000genomes.org/index.
html) encompassing the sixIL10polymorphisms evaluated in this study. Individual genotypes
corresponded to Phase 1 populations. Briefly, European population (EUR) is represented by 379 individuals from Europe with Western European Ancestry (Italy, England, Scotland, Fin-land and Spain), African population (AFR) totalizes 246 from Nigeria, Kenya and African Americans, Asian population (ASN) composed with 286 individuals from China and Japan and Amerindian group (AMR) is represented by 281 individuals from Colombia, Puerto Rico and Mexican Ancestry [15]. We used Haploview software to perform analysis and LD was eval-uated trough r2statistics [16] in each of the above mentioned populations.
Results
Family-based studies
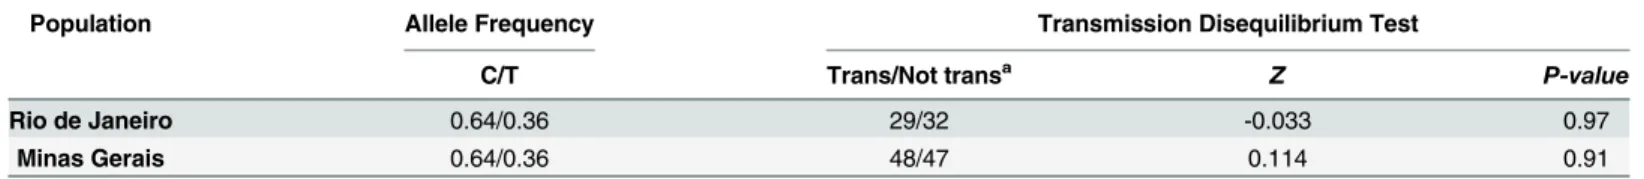
The corresponding TDT results evaluating the -819 C>T polymorphism in the two novel
(Z = 0.114,P-value= 0.91) family-based populations, therefore we found no evidence of associ-ation between leprosy susceptibility and this polymorphism.
Eligible studies for meta-analysis
The flow diagram that allowed for identification of eligible studies is illustrated inFig 1[17]. We found a total of 11 studies that evaluated the influence ofIL10polymorphisms and lep-rosy published between 2001–2015; all of them were case-control studies that were conducted in Brazilian [7,18–20], Indian [21–23], Malawian [24], Mexican [25], Colombian [26] and Chinese [27] populations. The studies from Malhotra et al., 2005 and Aggarwal et al., 2011 pre-sented partially overlapping population, therefore we excluded from meta-analysis the data from Malhotra et al 2005 [21] corresponding to the -819 and -592 polymorphisms. The included studies summarized a total of 2,941 cases and 3,763 controls. The general information regarding included studies is detailed inS2 Table. All control groups followed Hardy-Weinberg distribution, except for the -1082 polymorphism in which the studies [19], [7] and [26] were subsequently excluded from meta-analysis (Table 3).
Meta-analysis
When testing for publication bias results did not indicate funnel plot asymmetry for none of the sixIL10polymorphisms (P-valuesfor Egger´s test>0.1). Cochran´s Q statistic (Table 4)
suggested heterogeneity across studies evaluating leprosy association with two of the polymor-phisms:-1082 and -592 (P-valuesof 0.04 and 0.05 respectively). After removing one study at a time to assess its individual influence over the pooled result, we found no evidence of alteration in OR values for neither -3575 T>A (rs1800890), -2849 G>A (rs6703630), -2763 C>A
(rs6693899), -1082 G>A (rs1800896) polymorphisms (data not shown).
Meta-analysis results (Table 4) showed a significant association of the -819 C>T
(rs1800871) and -592 (rs1800872) polymorphisms with leprosy susceptibility. Amongst the published literature, Cardona et al., 2012 [26] presented OR results that diverged from pooled risk association (S1 Fig). The removal of study [26] during sensitivity analysis for the -819 poly-morphism slightly increased the pooled OR from 1.18 (CI = 1.04–1.34) to 1.22 (CI = 1.10–
1.31) and also improved the significance ofP-value from 0.01 to 3x10⁻⁵. In the case of the -592 polymorphism, after exclusion of Cardona et al., 2012,P-value was altered to 0.02. Pooled OR values for the -592 polymorphism increased from 1.14 (CI = 0.91–1.43) to 1.24 (CI = 1.03–
1.50) after removal of this study from meta-analysis. Therefore, after sensitivity analysis we considered this as an outlier study and decided to remove it from the final quantitative synthe-sis for -592C>A and -819C>T SNPs detailed inTable 4and also visualized inFig 2.
We found significant evidence of association with leprosy susceptibility and the -819 C>T
(rs1800871) polymorphism first when considering the available articles from literature (Pooled OR = 1.22; CI = 1.10–1.31;P-value =3x10⁻⁵). After inclusion of the two Brazilian family-based
Table 2. Summary of the results from the family-based association studies with -819 C>T (rs1800871) and association with leprosy.
Population Allele Frequency Transmission Disequilibrium Test
C/T Trans/Not transa Z P-value
Rio de Janeiro 0.64/0.36 29/32 -0.033 0.97
Minas Gerais 0.64/0.36 48/47 0.114 0.91
Abbreviations: Trans, Transmitted.
aTrans = Transmission in reference to Minor or risk allele
—819 T.
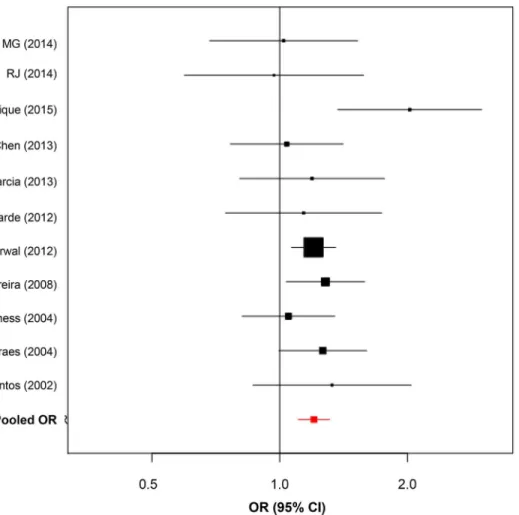
studies data for this SNP summarized 10 studies and pooled results remained similar with OR = 1.20, (95% CI = 1.10–1.31) andP-value = 2x10⁻⁵reinforcing the role of the -819 T allele and leprosy susceptibility (Fig 3).
In contrast the remainingIL10polymorphisms: -3575 T>A (rs1800890), -2849 G>A
(rs6703630), -2763 C>A (rs6693899) and -1082 G>A (rs1800896) showed no significant
asso-ciation with leprosy outcome (P-values>0.05) (S3–S6Figs).
Linkage disequilibrium (LD) analysis across populations
Finally to better understand these results, we performed linkage disequilibrium analysis to test for the presence of bins in the region encompassing these SNPs. LD plots for AFR, EUR, ASN
Fig 1. Flow diagram of the process of identification of eligible studies.
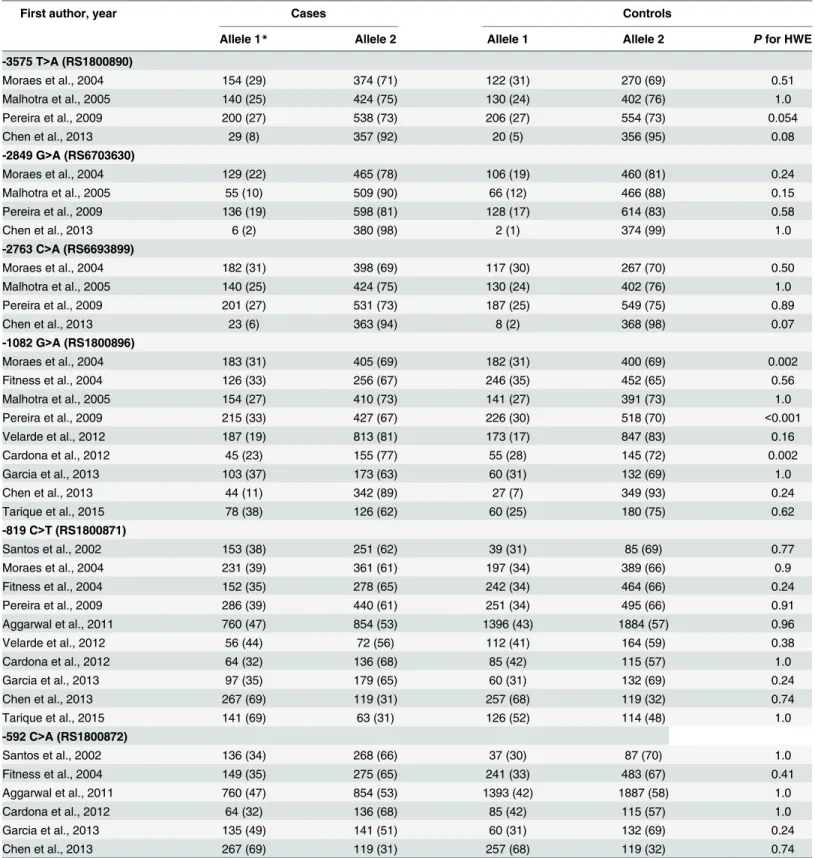
Table 3. Summary of extracted data from the papers selected for the meta-analysis.
First author, year Cases Controls
Allele 1* Allele 2 Allele 1 Allele 2 Pfor HWE
-3575 T>A (RS1800890)
Moraes et al., 2004 154 (29) 374 (71) 122 (31) 270 (69) 0.51
Malhotra et al., 2005 140 (25) 424 (75) 130 (24) 402 (76) 1.0
Pereira et al., 2009 200 (27) 538 (73) 206 (27) 554 (73) 0.054
Chen et al., 2013 29 (8) 357 (92) 20 (5) 356 (95) 0.08
-2849 G>A (RS6703630)
Moraes et al., 2004 129 (22) 465 (78) 106 (19) 460 (81) 0.24
Malhotra et al., 2005 55 (10) 509 (90) 66 (12) 466 (88) 0.15
Pereira et al., 2009 136 (19) 598 (81) 128 (17) 614 (83) 0.58
Chen et al., 2013 6 (2) 380 (98) 2 (1) 374 (99) 1.0
-2763 C>A (RS6693899)
Moraes et al., 2004 182 (31) 398 (69) 117 (30) 267 (70) 0.50
Malhotra et al., 2005 140 (25) 424 (75) 130 (24) 402 (76) 1.0
Pereira et al., 2009 201 (27) 531 (73) 187 (25) 549 (75) 0.89
Chen et al., 2013 23 (6) 363 (94) 8 (2) 368 (98) 0.07
-1082 G>A (RS1800896)
Moraes et al., 2004 183 (31) 405 (69) 182 (31) 400 (69) 0.002
Fitness et al., 2004 126 (33) 256 (67) 246 (35) 452 (65) 0.56
Malhotra et al., 2005 154 (27) 410 (73) 141 (27) 391 (73) 1.0
Pereira et al., 2009 215 (33) 427 (67) 226 (30) 518 (70) <0.001
Velarde et al., 2012 187 (19) 813 (81) 173 (17) 847 (83) 0.16
Cardona et al., 2012 45 (23) 155 (77) 55 (28) 145 (72) 0.002
Garcia et al., 2013 103 (37) 173 (63) 60 (31) 132 (69) 1.0
Chen et al., 2013 44 (11) 342 (89) 27 (7) 349 (93) 0.24
Tarique et al., 2015 78 (38) 126 (62) 60 (25) 180 (75) 0.62
-819 C>T (RS1800871)
Santos et al., 2002 153 (38) 251 (62) 39 (31) 85 (69) 0.77
Moraes et al., 2004 231 (39) 361 (61) 197 (34) 389 (66) 0.9
Fitness et al., 2004 152 (35) 278 (65) 242 (34) 464 (66) 0.24
Pereira et al., 2009 286 (39) 440 (61) 251 (34) 495 (66) 0.91
Aggarwal et al., 2011 760 (47) 854 (53) 1396 (43) 1884 (57) 0.96
Velarde et al., 2012 56 (44) 72 (56) 112 (41) 164 (59) 0.38
Cardona et al., 2012 64 (32) 136 (68) 85 (42) 115 (57) 1.0
Garcia et al., 2013 97 (35) 179 (65) 60 (31) 132 (69) 0.24
Chen et al., 2013 267 (69) 119 (31) 257 (68) 119 (32) 0.74
Tarique et al., 2015 141 (69) 63 (31) 126 (52) 114 (48) 1.0
-592 C>A (RS1800872)
Santos et al., 2002 136 (34) 268 (66) 37 (30) 87 (70) 1.0
Fitness et al., 2004 149 (35) 275 (65) 241 (33) 483 (67) 0.41
Aggarwal et al., 2011 760 (47) 854 (53) 1393 (42) 1887 (58) 1.0
Cardona et al., 2012 64 (32) 136 (68) 85 (42) 115 (57) 1.0
Garcia et al., 2013 135 (49) 141 (51) 60 (31) 132 (69) 0.24
Chen et al., 2013 267 (69) 119 (31) 257 (68) 119 (32) 0.74
Results indicate allele counts (frequency) for each polymorphism. RA = Risk allele. *Refers to risk allele for case-control studies.
Data forIL10–1082 G>A (rs1800896) polymorphism from Moraes et al., 2004, Pereira et al., 2009, Cardona et al., 2012 were excluded from analysis because control groups did not follow HWE.
and AMR populations from 1000 genomes (S7 Fig) presented perfect LD values (r2= 1) between-819 (rs1800871) and -592 (rs1800872) polymorphisms. Specifically in ASN we also observed high LD between the -1082 (rs1800896) and -2763 (rs6693899) polymorphisms. For both EUR and AMR groups the distal polymorphism-3575 (rs1800890) had moderate LD val-ues (r2>0.6) with—2763 (rs6693899) and -1082 (rs1800896) SNPs.
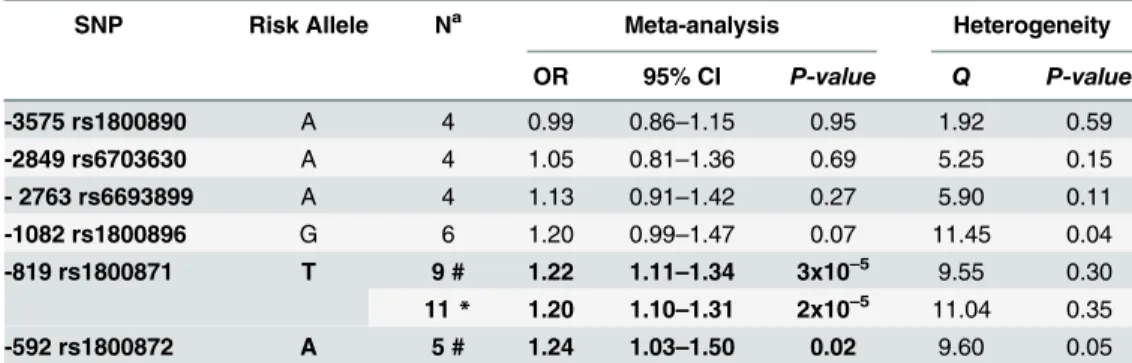
Table 4. Meta-analysis results from studies investigating leprosy association andIL10promoter polymorphisms.
SNP Risk Allele Na Meta-analysis Heterogeneity
OR 95% CI P-value Q P-value
-3575 rs1800890 A 4 0.99 0.86–1.15 0.95 1.92 0.59
-2849 rs6703630 A 4 1.05 0.81–1.36 0.69 5.25 0.15
- 2763 rs6693899 A 4 1.13 0.91–1.42 0.27 5.90 0.11
-1082 rs1800896 G 6 1.20 0.99–1.47 0.07 11.45 0.04
-819 rs1800871 T 9 # 1.22 1.11–1.34 3x10⁻⁵ 9.55 0.30
11* 1.20 1.10–1.31 2x10⁻⁵ 11.04 0.35
-592 rs1800872 A 5 # 1.24 1.03–1.50 0.02 9.60 0.05
Results correspond to random effects analysis. Abbreviations: CI, Confidence Interval.
aN = Number of studies included in the meta-analysis for each polymorphism.
# Combined results only with literature studies excluding Cardona et al., 2012. *Combined results including the two Brazilian family-based association studies
doi:10.1371/journal.pone.0136282.t004
Fig 2. Forest plots summarizing association ofIL10promoter polymorphisms and leprosy. (A)Forest plot for -592 C>A (rs1800872). Five case-control studies were evaluated under random-effects model. Bars represent 95% confidence interval and boxes represent OR values.(B)Forest plot for -819 C>T (rs1800871). Nine case-control studies were evaluated under random-effects model. Bars represent 95% confidence interval and boxes represent OR values.
Discussion
Our goal was to update the previous meta-analysis [7] which suggested the -819T allele as a marker of leprosy susceptibility. We included two previously unpublished Brazilian family samples and reviewed the literature retrieving novel studies. In total, we evaluated ten studies as compared to five in the previous study. When evaluating the results of the two new Brazilian family-based association studies we found no association with -819 T risk allele and leprosy outcome. However, when meta-analysis was performed combining literature data, results indi-cate a significant risk association for the -819 T allele with pooled OR of 1.18. The exclusion of an outlier study raised the pooled estimates to OR = 1.22. In the same reasoning, the -592 A allele showed a significant risk association with pooled OR of 1.24 after exclusion of study [26]. Our criteria for exclusion was corroborated with LD data that suggested clearly that-592C>A
and -819C>T SNPs are linked in a group of reference populations from 1000 genomes
data-base. Therefore, our meta-analysis results seemed to be in accordance and in the same direction for both variants. Although the association in this study suggested a modest risk of 20% for both-819T and -592A alleles in leprosy susceptibility, these results support the role of these polymorphisms on leprosy susceptibility replicating association amongst several populations with different ethnic background included in meta-analysis [7,19,21,22,24,27] reinforcing the role of this cytokine in leprosy outcome. We did not find evidence of association for any other promoter polymorphisms when they were evaluated individually.
Fig 3. Forest plot for -819 C>T (rs1800871) including Brazilian Family-based data (MG and RJ).Bars
represent 95% confidence interval and boxes represent OR values.
Interestingly, unrelated household contacts (HC) constituted the control group in the Car-dona study, differently from control groups of other reviewed articles that consisted of blood bank (BB) donors or healthy individuals (HI). We cannot directly infer that the control group composition could influence the results, but some cryptic consanguineous relations between controls and cases could introduce bias.
Recently, two meta-analysis also showed thatIL10–819C>T and -592C>A were associated
with tuberculosis. Both studies pointed to the -819T allele as significantly associated in Asians when subgroup analyses were performed [28,29]. The -592 polymorphism was associated with TB risk in Asians [28] differently from the second study that suggested association in European subgroup [29]. Unfortunately, as a limitation in this study, the number of combined studies for theIL10polymorphisms did not allow us to explore possible sources of heterogeneity such as subgroup analysis, this, for instance, could allow stratifying multibacillary or paucibacilary groups. It would be interesting that the publication of future studies evaluating such polymor-phisms in well-defined clinical groups could aid in confirming results for distal polymorpolymor-phisms and to perform clinical stratification analysis in proximalIL10polymorphisms.
Conclusions
In the present study, we provided an updated pooled OR estimate strengthening previous find-ings forIL10promoter polymorphisms and its association with leprosy. A better understand-ing of the genomic arrangements of this region indicated perfect LD between -819C>T and
-592C>A, and, consequently, both SNPs were associated with leprosy.
Supporting Information
S1 Meta-Analysis Checklist. Meta-analysis on genetic association studies form
(PDF)
S1 Fig. Forest plots summarizing association ofIL10promoter polymorphisms and leprosy
including ref [26] in analysis. (A)Forest plot forIL10–592 C>A (rs1800872). Bars represent
95% confidence intervals and boxes represent OR values. (B)Forest plot forIL10–819 C>T
(rs1800871). Bars represent 95% and boxes represent OR values (TIF)
S2 Fig. Funnel plot for publication bias. (A)IL10–592 C>A (rs1800872).(B)IL10–819
C>T (rs1800871)
(TIF)
S3 Fig.IL10–3575 T>A (RS1800890) and leprosy association. (A)Forest plot summarizing
association. Bars represent 95% confidence intervals and boxes represent OR values.(B) Fun-nel plot for publication bias
(TIF)
S4 Fig.IL10–2849 G>A (rs6703630) and leprosy association. (A)Forest plot summarizing
association. Bars represent 95% confidence intervals and boxes represent OR values.(B) Fun-nel plot for publication bias
(TIF)
S5 Fig.IL10–2763 C>A (rs6693899) and leprosy association. (A)Forest plot summarizing
association. Bars represent 95% confidence intervals and boxes represent OR values.(B) Fun-nel plot for publication bias
S6 Fig.IL10–1082 G>A (rs1800896) and leprosy association. (A)Forest plot summarizing
association. Bars represent 95% confidence intervals and boxes represent OR values.(B) Fun-nel plot for publication bias
(TIF)
S7 Fig. Linkage disequilibrium analysis forIL10polymorphisms in populations from 1000
genomes Phase 1. (A)African-AFR.(B)European-EUR.(C)Asian-ASN and(D) Amerin-dian-AMR. Values shown in each box and the intensity of shading are proportional to r2.IL10
–592 C>A (rs1800872) andIL10–819 C>T (rs1800871) promoter polymorphisms are shown
with. (TIF)
S1 Table. PRISMA Checklist for Meta-analysis on genetic association studies.
(PDF)
S2 Table. Characteristics of the studies included in the meta-analysis for theIL10
polymor-phisms and leprosy.
(DOC)
Acknowledgments
The authors would like to thank all the individuals included in the Brazilian Family-Based association studies for their participation.
Author Contributions
Conceived and designed the experiments: MOM. Performed the experiments: EPA CCC SMBD LEAA CSM. Analyzed the data: LEAA EPA CCC SMBD. Contributed reagents/materi-als/analysis tools: AGP FCL ENS. Wrote the paper: LEAA MOM AGP FCL.
References
1. Cyktor JC, Turner J. Interleukin-10 and immunity against prokaryotic and eukaryotic intracellular patho-gens. Infect Immun. 2011; 79(8):2964–73. Epub 2011/05/18. doi:10.1128/IAI.00047–11IAI.00047–11 [pii]. PMID:21576331; PubMed Central PMCID: PMC3147550.
2. Montoya D, Cruz D, Teles RM, Lee DJ, Ochoa MT, Krutzik SR, et al. Divergence of macrophage phago-cytic and antimicrobial programs in leprosy. Cell Host Microbe. 2009; 6(4):343–53. Epub 2009/10/20. doi:10.1016/j.chom.2009.09.002S1931–3128(09)00311–4 [pii]. PMID:19837374; PubMed Central PMCID: PMC2764558.
3. Moura DF, de Mattos KA, Amadeu TP, Andrade PR, Sales JS, Schmitz V, et al. CD163 favors Myco-bacterium leprae survival and persistence by promoting anti-inflammatory pathways in lepromatous macrophages. European Journal of Immunology. 2012; 42(11):2925–36. doi:10.1002/eji.201142198 PMID:22851198
4. Lima MCBS, Pereira GMB, Rumjanek FD, Gomes HM, Duppre N, Sampaio EP, et al. Immunological Cytokine Correlates of Protective Immunity and Pathogenesis in Leprosy. Scandinavian Journal of Immunology. 2000; 51(4):419–28. doi:10.1046/j.1365–3083.2000.00703.xPMID:10736116
5. Cardoso CC, Pereira AC, de Sales Marques C, Moraes MO. Leprosy susceptibility: genetic variations regulate innate and adaptive immunity, and disease outcome. Future Microbiology. 2011; 6(5):533–49. doi:10.2217/fmb.11.39PMID:21585261
6. Gibson AW, Edberg JC, Wu J, Westendorp RG, Huizinga TW, Kimberly RP. Novel single nucleotide polymorphisms in the distal IL-10 promoter affect IL-10 production and enhance the risk of systemic lupus erythematosus. J Immunol. 2001; 166(6):3915–22. Epub 2001/03/10. PMID:11238636. 7. Pereira AC, Brito-de-Souza VN, Cardoso CC, Dias-Baptista IM, Parelli FP, Venturini J, et al. Genetic,
8. Cardoso CC, Pereira AC, Brito-de-Souza VN, Duraes SM, Ribeiro-Alves M, Nery JA, et al. TNF-308G>A single nucleotide polymorphism is associated with leprosy among Brazilians: a genetic epide-miology assessment, meta-analysis, and functional study. J Infect Dis. 2011; 204(8):1256–63. Epub 2011/09/16. doi: jir521 [pii] doi:10.1093/infdis/jir521PMID:21917899.
9. Marques C de S, Brito-de-Souza VN, Guerreiro LT, Martins JH, Amaral EP, Cardoso CC, et al. Toll-like receptor 1 N248S single-nucleotide polymorphism is associated with leprosy risk and regulates immune activation during mycobacterial infection. J Infect Dis. 2013; 208(1):120–9. Epub 2013/04/03. doi:10.1093/infdis/jit133jit133 [pii]. PMID:23547143.
10. Miller SA, Dykes DD, Polesky HF. A simple salting out procedure for extracting DNA from human nucle-ated cells. Nucleic Acids Res. 1988; 16(3):1215. Epub 1988/02/11. PMID:3344216; PubMed Central PMCID: PMC334765.
11. Laird NM, Horvath S, Xu X. Implementing a unified approach to family-based tests of association. Genet Epidemiol. 2000; 19 Suppl 1:S36–42. Epub 2000/10/31. doi:10.1002/1098–2272(2000)19:1+<::
AID-GEPI6>3.0.CO;2-MPMID:11055368.
12. Wigginton JE, Cutler DJ, Abecasis GR. A note on exact tests of Hardy-Weinberg equilibrium. Am J Hum Genet. 2005; 76(5):887–93. Epub 2005/03/25. doi: S0002–9297(07)60735–6 [pii] doi:10.1086/ 429864PMID:15789306; PubMed Central PMCID: PMC1199378.
13. Kazeem GR, Farrall M. Integrating case-control and TDT studies. Ann Hum Genet. 2005; 69(Pt 3):329– 35. Epub 2005/04/23. doi: AHG156 [pii] doi:10.1046/j.1529–8817.2005.00156.xPMID:15845037.
14. "RDevelopmentCoreTeam". R: A language and environment for statistical computing. In: Computing" RFfS, editor. Vienna, Austria2011.
15. An integrated map of genetic variation from 1,092 human genomes. Nature. 2012; 491(7422):56–65. http://www.nature.com/nature/journal/v491/n7422/abs/nature11632.html#supplementary-information. doi:10.1038/nature11632PMID:23128226
16. Barrett JC, Fry B, Maller J, Daly MJ. Haploview: analysis and visualization of LD and haplotype maps. Bioinformatics. 2005; 21(2):263–5. Epub 2004/08/07. doi:10.1093/bioinformatics/bth457bth457 [pii]. PMID:15297300.
17. Moher D, Liberati A, Tetzlaff J, Altman DG. Preferred Reporting Items for Systematic Reviews and Meta-Analyses: The PRISMA Statement. Journal of Clinical Epidemiology. 2009; 62(10):1006–12. doi: 10.1016/j.jclinepi.2009.06.005PMID:19631508
18. Santos AR, Suffys PN, Vanderborght PR, Moraes MO, Vieira LM, Cabello PH, et al. Role of tumor necrosis factor-alpha and interleukin-10 promoter gene polymorphisms in leprosy. J Infect Dis. 2002; 186(11):1687–91. Epub 2002/11/26. doi: JID020214 [pii] doi:10.1086/345366PMID:12447749. 19. Moraes MO, Pacheco AG, Schonkeren JJ, Vanderborght PR, Nery JA, Santos AR, et al. Interleukin-10
promoter single-nucleotide polymorphisms as markers for disease susceptibility and disease severity in leprosy. Genes Immun. 2004; 5(7):592–5. Epub 2004/08/13. doi:10.1038/sj.gene.63641226364122 [pii]. PMID:15306847.
20. Garcia P, Alencar D, Pinto P, Santos N, Salgado C, Sortica VA, et al. Haplotypes of the IL10 gene as potential protection factors in leprosy patients. Clin Vaccine Immunol. 2013; 20(10):1599–603. Epub 2013/08/24. doi:10.1128/CVI.00334–13CVI.00334–13 [pii]. PMID:23966553; PubMed Central PMCID: PMC3807203.
21. Malhotra D, Darvishi K, Sood S, Sharma S, Grover C, Relhan V, et al. IL-10 promoter single nucleotide polymorphisms are significantly associated with resistance to leprosy. Hum Genet. 2005; 118(2):295– 300. Epub 2005/09/16. doi:10.1007/s00439–005–0042–8PMID:16163478.
22. Aggarwal S, Ali S, Chopra R, Srivastava A, Kalaiarasan P, Malhotra D, et al. Genetic variations and interactions in anti-inflammatory cytokine pathway genes in the outcome of leprosy: a study conducted on a MassARRAY platform. J Infect Dis. 2011; 204(8):1264–73. Epub 2011/09/16. doi:10.1093/infdis/ jir516jir516 [pii]. PMID:21917900.
23. Tarique M, Naqvi RA, Santosh KV, Kamal VK, Khanna N, Rao DN. Association of TNF-alpha-(308 (GG)), IL-10(-819(TT)), IL-10(-1082(GG)) and IL-1R1(+1970(CC)) genotypes with the susceptibility and progression of leprosy in North Indian population. Cytokine. 2015; 73(1):61–5. Epub 2015/02/24. doi:10.1016/j.cyto.2015.01.014S1043–4666(15)00018–6 [pii]. PMID:25697140.
24. Fitness J, Floyd S, Warndorff DK, Sichali L, Malema S, Crampin AC, et al. Large-scale candidate gene study of tuberculosis susceptibility in the Karonga district of northern Malawi. Am J Trop Med Hyg. 2004; 71(3):341–9. Epub 2004/09/24. doi: 71/3/341 [pii]. PMID:15381817.
26. Cardona-Castro N, Sánchez-Jiménez M, Rojas W, Bedoya-Berrío G. IL-10 gene promoter polymor-phisms and leprosy in a Colombian population sample. Biomédica: Revista del Instituto Nacional de Salud. 2012; 32(1).
27. Chen XH, Xiong JH, Ning Y, Wen Y, Liu J, Mao C, et al. IL-10 promoter SNPs and susceptibility to lep-rosy in ethnic groups from southwest China. Genet Mol Res. 2013; 12(3):2876–85. Epub 2013/09/26. doi:10.4238/2013.August.12.3gmr2360[pii]. PMID:24065643.
28. Liang B, Guo Y, Li Y, Kong H. Association between IL-10 Gene Polymorphisms and Susceptibility of Tuberculosis: Evidence Based on a Meta-Analysis. PLoS One. 2014; 9(2):e88448. doi:10.1371/ journal.pone.0088448PMID:24523896