ABCD Arq Bras Cir Dig
2019;32(1):e1415
DOI: /10.1590/0102-672020180001e1415
From the 1Shahid Sadoughi University of Medical Sciences, Pathology, Yazd, Yazd; 2Shahid Sadoughi University of Medical Sciences, Medical Genetics, Yazd, Yazd; 3Shahid Sadoughi University of Medical Sciences, Radiology, Yazd, Yazd; 4Shahid Sadoughi University of Medical Sciences, Emergency Medicine, Yazd, Yazd; 5Shahid Sadoughi University of Medical Sciences, Anesthesiology, Yazd, Yazd; 6Shahid Beheshti University of Medical Sciences, Forensic Medicine, Tehran, Tehran, Iran.
HEADINGS - Stomach neoplasms. Interleukin-10. Polymorphism, genetic. Meta-analysis
ABSTRACT - Introduction: A series of studies have evaluated the association between -592A>C and -819T>C polymorphisms in the promoter regions of Interleukin-10 (IL-10) and gastric cancer (GC) risk. However, the results remain inconclusive. Objective: To better understand the association of the polymorphisms with GC risk, we performed a comprehensive meta-analysis.
Method: An electronic search was performed of several databases to identify relevant studies up to April 2018. Results: A total of 44 case-control studies, including 26 studies on IL-10 -592A>C (5,332 cases and 8,272 controls) and 18 studies on IL-10 -819T>C (3,431 cases and 6,109 controls) were selected. Overall, -592A>C polymorphism was associated with the risk of GC under the heterozygote model (OR=1.153, 95% CI=1.020-1.305, p=0.023), but not -819T>C polymorphism. When stratified by ethnicity, significant association was only observed in the Asians under the allele model (OR=1.153, 95% CI=1.007-1.320, p=0.040) and the heterozygote model (OR=1.218, 95% CI=1.076-1.379, p=0.002) for -592A>C. Conclusion: The current meta-analysis results inconsistent with previous meta-analyses; showed that the IL-10 -592A>C polymorphism, but not -819T>C polymorphism, may be contributed to the susceptibility of GC in overall and Asian populations.
RESUMO - Introdução: Uma série de estudos avaliou a associação entre os polimorfismos
-592A>C e -819T>C nas regiões promotoras do risco de interleucina-10 (IL-10) e câncer gástrico (GC). No entanto, os resultados permanecem inconclusivos. Objetivo: Para entender melhor a associação dos polimorfismos com o risco de GC, realizamos uma meta-análise abrangente. Método: Foi realizada busca eletrônica de vários bancos de dados para identificar
estudos relevantes até abril de 2018. Resultados: Um total de 44 estudos caso-controle, incluindo 26 estudos sobre IL-10 -592A>C (5.332 casos e 8.272 controles) e 18 estudos sobre IL-10 -819T>C (3.431 casos e 6.109 controles) foram selecionados. No geral, o polimorfismo -592A> C foi associado ao risco de GC sob o modelo heterozigoto (OR=1,153, 95% IC=1,020-1,305, p=0,023), mas não polimorfismo -819T>C. Quando estratificada por etnia, associação significativa foi observada apenas nos asiáticos sob o modelo alelo (OR=1,153, IC 95%=1,007-1,320, p=0,040) e o modelo heterozigoto (OR=1,218, IC 95%=1,076-1,379, p=0,002) para -592A>C. Conclusão: Os atuais resultados são inconsistentes com metanálises anteriores; mostrou que o polimorfismo IL-10 -592A> C, mas não o polimorfismo -819T>C, pode ter contribuído para a suscetibilidade de GC em populações globais e asiáticas.
Correspondence: Amir Arjmandi
E-mail: [email protected]; [email protected]
Financial source: none Conflict of interest: none
Received for publication: 21/08/2018 Accepted for publication: 11/10/2018
DESCRITORES - Neoplasias Gástricas. Interleucina-10. Polimorfismo genético. Metanálise
INTRODUCTION
G
astric cancer (GC) is the 5th most common cancer and second leading cause of cancer-related deaths globally 21,32,36. In 2016 there were an estimated 26,370 new cases of GC in the United States 39. The recent years have brought much progress regarding the genetics of GC and the numberof confirmed GC associated SNPs and genes have risen dramatically 4,48. In addition, several studies have supported the concept that environmental factors are critical components of GC pathogenesis 52. However, genetic factors may modify the propensity
for GC development through an alteration of the inflammatory state and may also
interact with other risk factors 44.
Presently the mechanisms of the etiology and progression of GC are far from clear 4,38. Several genes have been identified to be associated with GC risk, including
Interleukin-10 (IL-10). IL-10 is a multifunctional cytokine with anti-inflammatory
properties, which has been reported involving in the some malignancies progress How to cite this article: Moghmi M, Arjmandi A, Aghili K, Jafari M, Zare-Shehneh M, Rastegar S, Abolbaghaei SM, Neamatzadeh H. Associação de polimorfismos da Interleucina-10 -592a>c e -819t>c com risco de câncer gástrico: revisão sistemática e metanálise de 44 estudos de caso-controle. ABCD Arq Bras Cir Dig. 2019;32(1):e1415. DOI: /10.1590/0102-672020180001e1415
Review Article
ASSOCIATION OF INTERLEUKIN-10 -592A>C AND -819T>C
POLYMORPHISMS WITH GASTRIC CANCER RISK: A SYSTEMATIC
REVIEW AND META-ANALYSIS OF 44 CASE-CONTROL STUDIES
Associação de polimorfismos da Interleucina-10 -592A>C e -819T>C com risco de câncer gástrico: Revisão sistemática e metanálise de 44 estudos de caso-controle
and development 22,48. The human gene that encodes IL-10
(Gene ID: 3586) maps to the long arm of chromosome 1 (1q31-32), which contains three most common 21082A>G (rs1800896), 2592C>A (rs1800872) and 2829C>T (rs1800871) polymorphisms located within the promoter region. These polymorphisms are associated with low/high amount of IL-10 secretion 31,45.
A series of epidemiological studies have reported the association of -592A>C (rs1800872) and -819T>C (rs3021097) polymorphisms of IL-10 gene with GC risk 22,31,45, but the results
remain conflicting rather than conclusive. Some meta-analyses
previously published regarding the association of -592A>C (rs1800872) and -819T>C (rs3021097) polymorphisms with GC risk 4, 48,55. A few studies were not included in these
meta-analyses and also original studies with larger sample sizes
in different ethnicity have been published since then. In
addition, some of the previous meta-analyses have reported
conflicting conclusions.
Hence, we performed this meta-analysis to evaluate whether the IL-10 -592A>C and -819T>C polymorphisms contributed to the susceptibility of GC. Based on our knowledge, this is the most comprehensive and accurate meta-analysis of the association of IL-10 -592A>C and -819T>C polymorphisms with GC risk.
METHOD
Search strategy
The electronic databases of the US National Library of Medicine’s PubMed, EMBASE, Web of Knowledge, Google Scholar, Wanfang, Chinese National Knowledge Infrastructure (CNKI), and Chinese Biomedical Literature Database (CBM) were systematically searched to retrieve potential publications that assessed the association between -592A>C and -819T>C polymorphisms of IL-10 gene and GC risk up to April 10, 2018. Key search terms used were as follows: (gastric cancer OR gastric neoplasm OR stomach neoplasms) AND (Interleukin-10 OR IL-10) AND (-592A>C OR rs1800872) AND (-819T>C OR rs1800871) AND (Polymorphism OR SNP OR single nucleotide polymorphism OR variation OR mutation). This meta-analysis included only publications relating to humans, covering all relevant written in English and Chinese publications with available full-text articles. Reference lists of retrieved articles, review articles, and previous meta-analysis were also manually searched to avoid missing relevant studies.
Inclusion and exclusion criteria
Studies were included in the meta-analysis if they met the following criteria: 1) full text available; 2) case-control or cohort studies; 3) studies focus on the association of -592A>C (rs1800872) and -819T>C (rs3021097) polymorphisms of IL-10
gene with GC risk; 4) sufficient published data for genotype
and allele frequencies to calculate the Odds Ratio (OR) and
95% confidence interval (CI).
Major reasons for exclusion of studies were as follows: 1) abstract, review articles, case reports, unpublished data and comments; 2) studies with overlapped or duplicate data; 3) no healthy control group established in the study; 4) studies with unclear or ambiguous data or genotype frequencies. When duplicated studies were published by the same author obtained from the same patient sample, only the one with the largest sample size was included in this meta-analysis.
Data extraction
Data were carefully extracted from all eligible studies independently by two investigators according to the inclusion and exclusion criteria. The following data were collected
from each study: first author, year of publication, country
origin, ethnicity, total number of cases and controls, the frequencies of genotypes, minor allele frequencies (MAFs), p-value for Hardy-Weinberg equilibrium (HWE). In case of disagreement (in the data extraction), consensus was resolved through consensus, or a third author would assess these articles. In the current meta-analysis, the quality of selected
studies was tested by the confirmation of HWE in control groups, and studies without the confirmation of HWE in controls were defined as low-quality studies, while studies with the confirmation of HWE in controls were defined as
high-quality studies (Table 1).
Statistical analysis
All meta-analyses were conducted using Comprehensive Meta-Analysis (CMA) software (USA, version 2.2.064) and a
p value below 0.05 was considered statistically significant.
The strength of the association of -592A>C and -819T>C polymorphisms of IL-10 gene with GC risk was estimated by
crude odds ratios (ORs) with corresponding 95% confidence intervals (CIs). The significance of the pooled OR was determined
by the Z-test. An allele contrast model (C vs. T), homozygote model (CC vs. TT), heterozygote model (CT vs. TT), dominant (CC+CT vs. TT), and recessive (CC vs. CT+TT) model were used for IL-10 -819T>C polymorphism. An allele contrast model (C vs. A), homozygote model (CC vs. AA), heterozygote model (CA vs. AA), dominant (CC+CA vs. AA), and recessive (CC vs. CA+AA) model were used for -592A>C polymorphism.
The Cochran chi-square-based Q statistical test was used to
evaluate statistical between-study heterogeneity (with p<0.05
for statistical significance). In addition, a quantitative measure
of between-study heterogeneity was also investigated using the I2 statistic, and which the between-study heterogeneity was considered low, moderate, and high based on I2 values of 25%, 50%, and 75%, respectively18. If the between-study
heterogeneity was statistically significant the random effects
model7 was applied; otherwise, the fixed effects model 29 was used. The sensitivity analysis was performed to assess the contribution of individual studies to pooled effect estimate by sequentially removing each study one at a time
and computing differential estimates for rest. In addition,
sensitivity analysis was performed by excluding the low quality studies to test the stability of the results. Publication bias was examined using the Begg’s funnel plot and Egger’s test 2,9. If publication bias existed, the Duval and Tweedie
non-parametric ‘’trim and fill’’ method was used to adjust
for it. Subgroup analyses by ethnicity and studies quality (by HWE status) were performed subsequently. The distribution of genotypes in control groups was evaluated for a departure from HWE using chi-square test.
RESULTS
Characteristics of studies
Tables 1 and 2 showed the characteristics of all the eligible studies selected in the meta-analysis. The study selection processes were presented in Figure 1 (PRISMA 2009 Flow Diagram). We evaluated all the retrieved studies by examining titles, abstracts and conclusions. According to the criteria eligibility, 44 studies
in 29 publications was identified regarding the association
between the IL-10 -592A>C and -819T>C polymorphisms with susceptibility to the GC. All of these 44 case-control studies
provided sufficient data to calculate the association between
included five groups of Caucasians 5,10,11,19,53, 16 groups of Asians 8,14,20,22,24,25,27,28,33,34,37,43,47,46,50,54, and five Latinos populations 1,3,6,31,39 (Table 1). While, 18 case-control studies evaluated the association between the -819T>C polymorphisms and GC risk, with 3,431 cases and 6,109 controls, included three groups of Caucasians 5,19,53, 14 groups of Asians 14,22-24,26,27,33,37,42,43,46,47,51,54, and one Latinos populations1 (Table 2). The countries of these studies included China, Korea, Japan, India, USA, Italy, Finland, Spain, Netherland, Costa Rica, Brazil, Mexico and Chile. All the genotype distributions of controls were in agreement with HWE for IL-10 -592A>C and -819T>C polymorphisms except
for nine studies in five publications11,21,30,31,40. Therefore, 35 of
44 case-control studies were defined as high-quality studies
(Tables 1 and 2).
FIGURE 1 - Flow chart of studies selection in this meta-analysis (IL-10 -592A>C and -819T>C Polymorphisms)
Meta-analysis
IL-10 -592A>C Polymorphism
Table 3 listed the main results of the meta-analysis of IL-10 -592A>C polymorphism and GC risk. When all the eligible studies were pooled into the meta-analysis of IL-10
-592A>C polymorphism, a significant association was found
only under the heterozygote model (CA vs. AA: OR=1.153, 95%
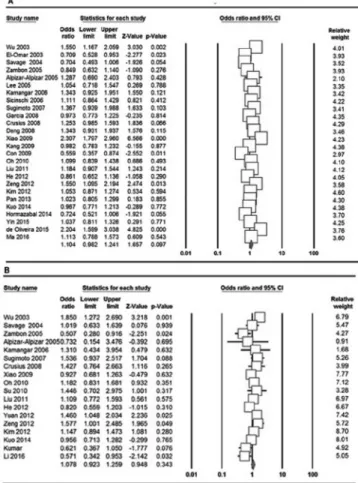
CI=1.020-1.305, p=0.023, Figure 2A). In addition, significant
between-study heterogeneity was detected in all genetic
models. When stratified by ethnicity, a significant association
between of IL-10 -592A>C polymorphism and increased GC risk among Asians was detected under the allele model (C vs. A: OR=1.153, 95% CI=1.007-1.320, p=0.040) and the heterozygote model (CA vs. AA: OR=1.218, 95% CI=1.076-1.379, p= 0.002), but not among Caucasian and Latinos populations. Subgroup analysis of studies with high quality
showed that there was a significant association between
IL-10 -1082 A>G polymorphism and increased risk of GC only under the allele model (OR=1.154, 95% CI=1.004-1.326, p=0.044, Table 2).
IL-10 -819T>C Polymorphism
Table 4 and Figure 2B showed the main results of the meta-analysis of IL-10 -819T>C polymorphism and GC risk. When all the eligible studies were pooled into the meta-analysis of IL-10 -819T>C polymorphism, no significant
association was observed in any genetic model. In the
stratified analyses based on ethnicity and studies quality,
there was not still significant association between IL-10 -819T>C polymorphism and risk of GC.
FIGURE 2 -Forest plot of the association of IL-10 -592A>C and -819T>C Polymorphisms with GC: A) -592A>C (homozygote model: C vs. A); B) -819T>C (dominant model: CC+CT vs. TT)
Heterogeneity and sensitivity analysis
As shown in Tables 3 and 4, there was a significant
between-study heterogeneity for IL-10 -592A>C polymorphism under all genetic models (C vs. A: Ph=0.001; CC vs. AA: Ph=0.001; CA vs. AA: Ph=0.009; CC+CA vs. AA: Ph=0.001; CC vs. CA+ AA: Ph=0.001), and for of IL-10 -819T>C (rs3021097) polymorphism under four genetic models (C vs. A: Ph=0.001; CC vs. TT: Ph=0.0160.001; CT vs. TT: Ph=021; and CC+CT vs. TT: Ph=0.002), except the recessive genetic model (CC vs. CT+ TT: Ph=0.150). We performed sensitivity analysis by omitting one study at a time and calculating the pooled ORs again. However, the
results did not show any significant statistical differences when
studies were omitted. Therefore, the stability of the study was
not influenced by any individual study.
Publication bias
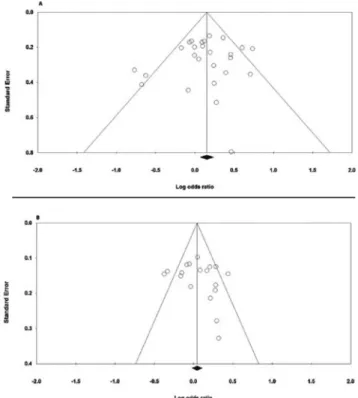
Both Begg’s funnel plot and Egger’s test were carried out to evaluate the publication bias of the studies. Tables 3 and 4 presents the results of Begg’s funnel plot and Egger’s test under
the five genetic models. As shown in Figure 3A, the shapes of
the Begg’s funnel plots under the allele model of IL-10 -592A>C
polymorphism shown approximately symmetrical and significant
evidence of publication bias was not observed by the Egger’s test. As for the IL-10 -819T>C polymorphism, the shapes of the Begg’s funnel plots under the heterozygote comparison model seemed symmetrical (Figure 3B). In addition, the Egger’s tests (all p values for Egger’s test>0.05) also showed that there was no evidence of publication bias for both polymorphisms.
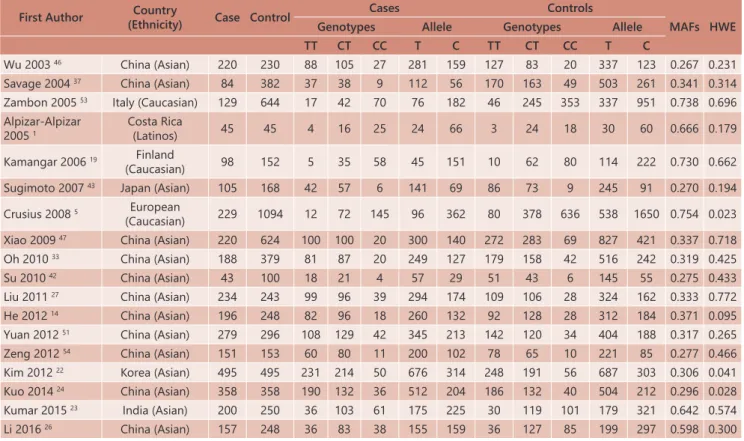
TABLE 1 -The general characteristics of eligible studies in the meta-analysis of IL-10 -592A>C
First Author Country
(Ethnicity) Case Control
Cases Controls
MAFs HWE Genotypes Allele Genotypes Allele
AA CA CC A C AA CA CC A C
Wu 2003 46 China (Asian) 220 230 88 105 27 281 159 127 83 20 337 123 0.267 0.231 El-Omar 2003 10 USA(Caucasian) 314 210 35 101 178 171 457 13 70 127 96 324 0.771 =0.001 Savage 2004 37 China (Asian) 84 386 9 39 36 57 111 49 166 171 205 567 0.734 0.382 Zambon 2005 53 Italy (Caucasian) 129 644 17 42 70 76 182 46 245 353 337 951 0.738 0.696 Alpizar-Alpizar
2005 1 Costa Rica(Latinos) 45 45 3 20 21 27 63 5 21 18 32 58 0.647 0.761
Lee 2005 25 Korea (Asian) 122 120 52 62 8 166 78 53 60 7 166 74 0.308 0.059
Kamangar 2006 19 Finland
(Caucasian) 112 237 6 38 68 50 174 17 82 109 132 342 0.721 0.775
Sicinschi 2006 39 Mexico (Latinos) 181 369 40 90 51 170 192 95 176 98 366 372 0.504 0.376 Sugimoto 2007 43 Japan (Asian) 105 168 43 54 8 140 70 88 70 10 246 90 0.267 0.419 Garcia 2008 11 Spain (Caucasian) 404 404 24 143 237 191 617 28 131 245 187 621 0.768 0.075
Crusius 2008 5 Netherland
(Caucasian) 237 1122 11 78 148 100 374 83 397 642 563 1681 0.749 0.049 Deng 2008 8 China (Asian) 125 110 30 39 56 99 151 39 25 46 103 117 0.531 =0.001 Xiao 2009 47 China (Asian) 220 624 100 100 20 300 140 272 283 69 1038 210 0.337 0.718 Kang 2009 20 Korea (Asian) 333 332 142 157 34 441 225 146 145 41 437 227 0.341 0.591 Con 2009 3 Costa Rica(Latinos) 52 191 10 26 16 44 60 23 65 103 111 271 0.709 0.015 Oh 2010 33 China (Asian) 178 362 77 81 20 235 121 167 159 36 493 231 0.319 0.861 Liu 2011 27 China (Asian) 234 243 99 96 39 294 174 109 106 28 324 162 0.333 0.772 He 2012 14 China (Asian) 196 248 82 96 18 260 132 92 128 28 312 184 0.371 0.095
Zeng 2012 54 China (Asian) 151 153 59 77 15 195 107 80 66 7 226 80 0.261 0.147
Kim 2012 22 Korea (Asian) 495 495 231 214 50 676 314 248 191 56 687 303 0.306 0.041 Pan 2013 34 China (Asian) 308 308 144 128 36 416 200 142 135 31 419 197 0.319 0.895 Kuo 2014 24 China (Asian) 358 358 186 134 38 506 210 358 180 141 501 215 0.340 =0.001 Hormazabal
2014 31 Chile (Latinos) 147 172 19 73 55 111 183 11 83 78 105 239 0.694 0.070
Yin 2015 50 China (Asian) 228 461 112 96 20 320 136 235 184 42 654 268 0.290 0.490 de Oliveira 2015 6 Brazil (Latinos) 207 240 104 82 21 290 124 169 64 7 402 78 0.162 0.753
Ma 2016 28 China (Asian) 147 150 67 63 17 197 97 71 67 12 208 92 0.303 0.486
TABLE 2 - The general characteristics of eligible studies in the meta-analysis of IL-10 -819T>C
First Author Country
(Ethnicity) Case Control
Cases Controls
MAFs HWE Genotypes Allele Genotypes Allele
TT CT CC T C TT CT CC T C
Wu 2003 46 China (Asian) 220 230 88 105 27 281 159 127 83 20 337 123 0.267 0.231 Savage 2004 37 China (Asian) 84 382 37 38 9 112 56 170 163 49 503 261 0.341 0.314 Zambon 2005 53 Italy (Caucasian) 129 644 17 42 70 76 182 46 245 353 337 951 0.738 0.696 Alpizar-Alpizar
2005 1
Costa Rica
(Latinos) 45 45 4 16 25 24 66 3 24 18 30 60 0.666 0.179
Kamangar 2006 19 Finland
(Caucasian) 98 152 5 35 58 45 151 10 62 80 114 222 0.730 0.662
Sugimoto 2007 43 Japan (Asian) 105 168 42 57 6 141 69 86 73 9 245 91 0.270 0.194
Crusius 2008 5 European
(Caucasian) 229 1094 12 72 145 96 362 80 378 636 538 1650 0.754 0.023 Xiao 2009 47 China (Asian) 220 624 100 100 20 300 140 272 283 69 827 421 0.337 0.718 Oh 2010 33 China (Asian) 188 379 81 87 20 249 127 179 158 42 516 242 0.319 0.425
Su 2010 42 China (Asian) 43 100 18 21 4 57 29 51 43 6 145 55 0.275 0.433
TABLE 3 -The meta-analysis of IL-10 -592A>C polymorphism and risk of GC
Subgroup Study
number Genetic model
Type of model
Heterogeneity Odds ratio Publication Bias I2 (%) PH OR 95% CI Ztest POR PBeggs PEggers
Overall 26 C vs. A Random 76.40 =0.001 1.104 0.982-1.241 1.657 0.097 0.724 0.974 26 CC vs. AA Random 63.55 =0.001 1.081 0.868-1.345 0.694 0.488 0.427 0.401 26 CA vs. AA Random 44.34 0.009 1.153 1.020-1.305 2.268 0.023 0.860 0.569 26 CC+CA vs. AA Random 89.63 =0.001 1.085 0.828-1.422 0.589 0.556 0.964 0.559 26 CC vs. CA+ AA Random 77.34 =0.001 1.003 0.815-1.235 0.030 0.976 0.171 0.254 By
Ethnicity
Caucasian 5 C vs. A Random 67.19 0.016 0.992 0.797-1.235 -0.007 0.944 0.806 0.953 5 CC vs. AA Random 65.33 0.021 0.959 0.572-1.608 -0.157 0.875 0.806 0.601 5 CA vs. AA Random 60.26 0.039 0.891 0.540-1.470 -0.452 0.651 1.000 0.869 5 CC+CA vs. AA Random 81.47 =0.001 1.125 0.569-2.223 0.339 0.735 0.462 0.252 5 CC vs. CA+ AA Random 55.56 0.061 1.071 0.922-1.245 0.895 0.371 0.462 0.456 Asian 17 C vs. A Random 73.59 0.001 1.153 1.007-1.320 2.057 0.040 0.224 0.664 17 CC vs. AA Random 59.74 0.001 1.193 0.937-1.519 1.429 0.153 0.029 0.003 17 CA vs. AA Random 40.21 0.044 1.218 1.076-1.379 3.111 0.002 0.536 0.356 17 CC+CA vs. AA Random 92.39 =0.001 1.133 0.810-1.585 0.728 0.467 0.483 0.648 17 CC vs. CA+ AA Random 81.80 =0.001 1.050 0.755-1.461 0.290 0.771 0.052 0.013 Latinos 5 C vs. A Random 87.97 =0.001 1.053 0.660-1.681 0.216 0.829 0.806 0.759 5 CC vs. AA Random 80.95 0.001 0.518 0.151-1.776 -1.047 0.295 0.308 0.373 5 CA vs. AA Fixed 20.76 0.286 1.001 0.707-1.418 0.007 0.995 1.000 0.737 5 CC+CA vs. AA Fixed 55.11 0.083 0.925 0.667-1.283 -0.469 0.639 1.000 0.591 5 CC vs. CA+ AA Random 65.75 0.033 0.787 0.491-1.261 -0.997 0.319 0.734 0.757 High Quality Studies
20 C vs. A Random 77.22 =0.001 1.154 1.004-1.326 2.012 0.044 0.417 0.791 20 CC vs. AA Random 54.37 0.002 1.191 0.989-1.342 1.820 0.069 0.381 0.717 20 CA vs. AA Random 45.14 0.015 1.131 0.982-1.304 1.710 0.087 0.721 0.873 20 CC+CA vs. AA Random 63.33 =0.001 1.176 0.997-1.387 1.930 0.054 0.256 0.630 20 CC vs. CA+ AA Fixed 31.81 0.086 1.079 0.961-1.211 1.285 0.199 0.040 0.029
TABLE 4 - The meta-analysis of IL-10 -819T>C polymorphism and risk of GC
Subgroup Study
number Genetic model
Type of model
Heterogeneity Odds ratio Publication Bias I2 (%) PH OR 95% CI Ztest POR PBeggs PEggers
Overall 18 C vs. T Random 58.48 0.001 1.057 0.950-1.177 1.017 0.309 0.820 0.381 18 CC vs. TT Random 46.47 0.016 0.987 0.795-1.225 -0.120 0.905 0.544 0.469 18 CT vs. TT Random 44.86 0.021 1.092 0.943-1.264 1.171 0.242 0.324 0.376 18 CC+CT vs. TT Random 55.29 0.002 1.078 0.923-1.259 0.948 0.343 0.404 0.621 18 CC vs. CT+ TT Fixed 25.96 0.150 1.003 0.890-1.131 0.056 0.955 0.448 0.492 By
Ethnicity
Caucasian 3 C vs. T Fixed 50.64 0.132 1.086 0.914-1.289 0.937 0.349 1.000 0.982 3 CC vs. TT Random 66.66 0.050 1.008 0.474-2.144 0.021 0.983 1.000 0.753 3 CT vs. TT Fixed 59.86 0.083 0.803 0.524-1.232 -1.004 0.315 1.000 0.799 3 CC+CT vs. TT Random 67.42 0.046 0.938 0.445-1.980 -0.167 0.867 1.000 0.744 3 CC vs. CT+ TT Fixed 0.00 0.552 1.163 0.941-1.438 1.398 0.162 1.000 0.979 Asian 14 C vs. T Random 63.82 0.001 1.046 0.924-1.184 0.708 0.479 0.742 0.499 14 CC vs. TT Random 49.48 0.018 0.987 0.778-1.254 -0.104 0.917 0.661 0.545 14 CT vs. TT Random 42.40 0.047 1.132 0.980-1.307 1.684 0.092 0.742 0.879 14 CC+CT vs. TT Random 57.22 0.004 1.105 0.942-1.295 1.224 0.221 0.584 0.826 14 CC vs. CT+ TT Fixed 20.33 0.232 0.917 0.792-1.062 -1.157 0.247 0.125 0.170 High Quality Studies
15 C vs. T Random 54.22 0.006 1.085 0.966-1.219 1.377 0.169 0.552 0.391 15 CC vs. TT Random 52.77 0.009 0.974 0.742-1.278 -0.191 0.848 0.620 0.488 15 CT vs. TT Random 52.86 0.008 1.077 0.894-1.297 0.779 0.436 0.276 0.326 15 CC+CT vs. TT Random 61.51 0.001 1.063 0.874-1.294 0.611 0.541 0.198 0.460 15 CC vs. CT+ TT Fixed 30.61 0.125 0.980 0.848-1.132 -0.275 0.784 0.322 0.150
FIGURE 3 - Funnel plot for publication bias in the meta-analysis of the IL-10 -592A>C and -819T>C Polymorphisms with GC: A) -592A>C (heterozygote model: CA vs. AA); B) -819T>C (allele model: C vs. T).
DISCUSSION
A meta-analysis can combine results from individual studies to overcome the limitation of small sample sizes and inadequate statistical power, produce a single estimate of the
major effect, answer questions not resolved by the individual studies, resolve controversial debates arising from conflicting
studies and cite limitations of current knowledge 12,15. To date, several meta-analyses have been performed to evaluate the association of the IL-10 gene promoter -592A>C and -819T>C polymorphisms with GC. However, due to lack of ability to obtain overall reliable conclusions because of limited sample sizes, a consensus has not been reached. Therefore, to better elucidate the association of the IL-10 -592A>C and -819T>C polymorphisms with GC, we performed an updated and more comprehensive meta-analysis by collecting 44 relevant case-control studies in 29 publications.
In 2014, Qi et al., in a meta-analysis of twelve studies, with 2,116 GC cases and 4,077 controls, reported that there
was no significant association between the IL-10 -592C>A
polymorphism and GC risk in overall population 35. Since then, a series of better designed case-control studies on the association between IL-10 -592C>A polymorphism and GC were performed. Therefore, their results as a meta-analysis
essentially remain an open field. In the current meta-analysis,
26 eligible case-control studies with 5,332 cases and 8,272
controls were identified and analyzed. Our results showed that there was a significant association between the IL-10 -592C>A
polymorphism and susceptibility to GC in total population. Moreover, compared with Qi et al meta-analysis the allele genetic model and subgroup analysis among Latinos were also carried out. In this meta-analysis we found that the IL-10 -592C>A polymorphism was associated with GC risk in Asians under the allele model (C vs. A: OR=1.153, 95% CI=1.007-1.320, p=0.040) and the heterozygote model (CA vs. AA: OR=1.218, 95% CI=1.076-1.379, p=0.002). In addition, it is worth noting that the association between IL-10 -592C>A polymorphism
and GC risk was significant by studies quality under the allele
model (OR=1.154, 95% CI=1.004-1.326, p=0.044).
In 2016, Cui et al., performed a meta-analysis to assess the susceptibility of the IL-10 -819T>C polymorphism to GC including eleven articles with 1,960 cases and 3,705 controls 4. Their results suggested that L-10 -819T>C polymorphism has a protective role in susceptibility to GC. Although their results suggested that the IL-10 -819T>C polymorphism might not contribute to the risk of GC; however, these studies were with small number of cases and controls. In the current meta-analysis, we included a total of 18 case-control studies with 3,431 cases and 6,109 controls. The pooled results indicated that there was no obvious association between IL-10 -819T>C polymorphism to GC. Therefore, our meta-analysis not only
confirmed Cui et al results, but also provided most reliable statistical results by including more seven case-control studies 4.
Heterogeneity between studies is common in the meta-analysis of genetic association studies 41,49. In each case, the
heterogeneity could be a result of different covariates such as
ethnicity, sources of controls, sample size, HWE and methods used and so on 16,17,30. In the current meta-analysis, significant between-study heterogeneity was detected across studies under all genetic models and thus we selected the
random-effects model to summarize the ORs. Therefore, we performed meta-regression analysis to find the source of between-study
heterogeneity. The results showed that ethnicity and studies quality did not contribute to substantial between-study heterogeneity in the current meta-analysis. Moreover, we have performed sensitivity analysis according to sample size and
leave-one-out analysis to determine whether modification of the inclusion criteria by removing one study each time affected
the results. However, for both IL-10 -592A>C and -819T>C polymorphisms, the sensitivity analyses did not materially
affected the original results.
The present meta-analysis has some advantages compared to the previous meta-analyses. However, it does have some limitations that should be taken into account. First, we have included only studies published in the English and Chinese language in this meta-analysis; therefore, publication bias may have occurred. Second, in this meta-analysis the great proportion of statistical power was contributed by the Asian ethnicity. There were not enough studies in Caucasians and Latinos, which limited the statistical power. Moreover, African was one of the three largest ethnics, but we have not found any study on Africans. Third, the current meta-analysis was performed to analyze these polymorphisms separately; however, a haplotype analysis may have been more powerful
for finding significant associations with GC. Forth, the ORs
extracted from each eligible study were based on unadjusted estimates, while a more precise analysis should be performed in all individual data available, which would allow for the adjustment by other co-variants including age, environmental exposures, smoking status, and other lifestyle factors. Finally, gene-gene and gene-environment interactions which may modulate the GC susceptibility were not addressed in this
meta-analysis for the lack of sufficient data.
CONCLUSION
The current meta-analysis results inconsistent with the previous meta-analyses showed that the IL-10 -592A>C polymorphism contributed to the susceptibility of GC in overall population, particularly in Asian populations. However, the IL-10 -819T>C polymorphism was not associated with an increased risk of GC. Further large well-designed studies are still needed
to determine the effects of the IL-10 -592A>C and -819T>C
REFERENCES
1. Alpízar-Alpízar W, Pérez-Pérez GI, Une C, Cuenca P, Sierra R. Association of interleukin-1B and interleukin-1RN polymorphisms with gastric cancer in a high-risk population of Costa Rica. Clin Exp Med. 2005;5(4):169-176. doi:10.1007/s10238-005-0082-3.
2. Begg CB, Mazumdar M. Operating characteristics of a rank correlation test for publication bias. Biometrics. 1994;50(4):1088-1101.
3. Con SA, Takeuchi H, Con-Chin GR, Con-Chin VG, Yasuda N, Con-Wong R. Role of bacterial and genetic factors in gastric cancer in Costa Rica. World J Gastroenterol. 2009;15(2):211-218. doi:10.3748/WJG.15.211. 4. Cui X, Huang Q, Li X, Liu F, Wang D, Yan D, et al. Relationship between
Interleukin-10 Gene C-819T Polymorphism and Gastric Cancer Risk: Insights from a Meta-Analysis. Med Sci Monit. 2016;22:2839-2845. 5. Crusius JB1, Canzian F, Capellá G, Peña AS, Pera G, Sala N, et al. Cytokine
gene polymorphisms and the risk of adenocarcinoma of the stomach in the European prospective investigation into cancer and nutrition (EPIC-EURGAST). Ann Oncol. 2008;19(11):1894-1902. doi:10.1093/ annonc/mdn400.
6. de Oliveira JG, Rossi AF, Nizato DM, Cadamuro AC, Jorge YC, Valsechi MC, et al. Influence of functional polymorphisms in TNF-a, IL-8, and IL-10 cytokine genes on mRNA expression levels and risk of gastric cancer. Tumor Biol. 2015;36(12):9159-9170. doi:10.1007/s13277-015-3593-x. 7. DerSimonian R, Laird N. Meta-analysis in clinical trials. Control Clin Trials.
1986;7(3):177-188.
8. Deng W, He L, Peng X. [The relationship among IL-10 gene polymorphisms H elicobacter pylori and noncardia gastric cancer development in Fujian province]. [Article in Chinese]. Wei Chang Bing Xue He Gan Bing Xue Za Zhi. 2008;17:212-214.
9. Egger M, Davey Smith G, Schneider M, Minder C. Bias in meta-analysis detected by a simple, graphical test. BMJ. 1997;315(7109):629-634. 10. El-Omar EM, Rabkin CS, Gammon MD, Vaughan TL, Risch HA, Schoenberg
JB, et al. Increased risk of noncardia gastric cancer associated with proinflammatory cytokine gene polymorphisms. Gastroenterology. 2003;124(5):1193-1201.
11. García-González MA, Lanas A, Quintero E, Nicolás D, Parra-Blanco A, Strunk M, Benito R, et al. Gastric Cancer Susceptibility Is Not Linked to Pro-and Anti-Inflammatory Cytokine Gene Polymorphisms in Whites: A Nationwide Multicenter Study in Spain. Am J Gastroenterol. 2007;102(9):1878-1892. doi:10.1111/j.1572-0241.2007.01423.x
12. Garg AX, Hackam D, Tonelli M. Systematic Review and Meta-analysis: When One Study Is Just not Enough. Clin J Am Soc Nephrol. 2008;3(1):253-260. doi:10.2215/CJN.01430307.
13. Gonzalez-Hormazabal P, Musleh M, Bustamante M, Stambuk J, Escandar S, Valladares H, et al. Role of cytokine gene polymorphisms in gastric cancer risk in Chile. Anticancer Res. 2014;34(7):3523-3530.
14. He B, Pan Y, Xu Y, Nie Z, Chen L, Gu L, et al. Increased Risk for Gastric Cancer in Carriers of the Lymphotoxin-a+252G Variant Infected by Helicobacter pylori. Genet Test Mol Biomarkers. 2012;16(1):9-14. doi:10.1089/gtmb.2011.0078.
15. Haidich AB, Haidich AB. Meta-analysis in medical research. Hippokratia. 2010;14(Suppl 1):29-37.
16. Jafari Nedooshan J, Kargar S, Neamatzadeh H, Haghighi F, Dehghani Mohammad-Abadi R, Seddighi N. Lack of Association of the Fat Mass and Obesity Associated (FTO) Gene rs9939609 Polymorphism with Breast Cancer Risk: a Systematic Review and Meta-Analysis Based on Case - Control Studies. Asian Pac J Cancer Prev. 2017;18(4):1031-1037. doi:10.22034/APJCP.2017.18.4.1031.
17. Jafari Nedooshan J, Forat-Yazdi M, Neamatzadeh H, Zare Shehneh M, Kargar S, Seddighi N. Genetic Association of XRCC1 Gene rs1799782, rs25487 and rs25489 Polymorphisms with Risk of Thyroid Cancer: Meta-Analysis. Asian Pac J Cancer Prev. 2017;18(1):263-270.
18. Kamali M, Hantoushzadeh S, Borna S, Neamatzadeh H, Mazaheri M, Noori-Shadkam M, et al. Association between Thrombophilic Genes Polymorphisms and Recurrent Pregnancy Loss Susceptibility in the Iranian Population: a Systematic Review and Meta-Analysis. Iran Biomed J. 2018;22(2):78-89.
19. Kamangar F, Abnet CC, Hutchinson AA, Newschaffer CJ, Helzlsouer K, Shugart YY, et al. Polymorphisms in inflammation-related genes and risk of gastric cancer (Finland). Cancer Causes Control. 2006;17(1):117-125. doi:10.1007/s10552-005-0439-7.
20. Kang JM, Kim N, Lee DH, Park JH, Lee MK, Kim JS, et al. The effects of genetic polymorphisms of IL-6, IL-8, and IL-10 on Helicobacter pylori-induced gastroduodenal diseases in Korea. J Clin Gastroenterol. 2009;43(5):420-428. doi:10.1097/MCG.0b013e318178d1d3.
21. Khoram-Abadi KM, Forat-Yazdi M, Kheirandish S, Saeidi N, Zarezade Z, Mehrabi N, et al. DNMT3B -149 C>T and -579 G>T polymorphisms and risk of gastric and colorectal cancer: A meta-analysis. Asian Pacific J Cancer Prev. 2016;17(6).
22. Kim J, Cho YA, Choi IJ, Lee YS, Kim SY, Shin A, et al. Effects of interleukin-10 polymorphisms, Helicobacter pylori infection, and smoking on the risk of noncardia gastric cancer. Katoh M, ed. PLoS One. 2012;7(1):e29643. doi:10.1371/journal.pone.0029643.
23. Kumar S, Kumari N, Mittal RD, Mohindra S, Ghoshal UC. Association between pro-(IL-8) and anti-inflammatory (IL-10) cytokine variants and their serum levels and H. pylori-related gastric carcinogenesis in northern India. Meta Gene. 2015;6:9-16. doi:10.1016/j.mgene.2015.07.008. 24. Kuo WH, Huang CY, Fu CK, Hsieh YH, Liao CH, Hsu CM,et al. Effects of
interleukin-10 polymorphisms and smoking on the risk of gastric cancer in Taiwan. In Vivo. 2014;28(5):967-971.
25. Lee JY, Kim HY, Kim KH, Kim SM, Jang MK, Park JY, et al. Association of polymorphism of IL-10 and TNF-A genes with gastric cancer in Korea. Cancer Lett. 2005;225(2):207-214. doi:10.1016/j.canlet.2004.11.028. 26. Li L, Tang XY, Ye LM, Yang Q, Li Y. Investigation on the association between
IL-10 C819T gene polymorphisms and susceptibility to gastric cancer. Genet Mol Res. 2016;15(4). doi:10.4238/gmr15047915.
27. Liu J, Song B, Wang J-L, Li Z-J, Li W-H, Wang Z-H. Polymorphisms of interleukin-10 promoter are not associated with prognosis of advanced gastric cancer. World J Gastroenterol. 2011;17(10):1362. doi:10.3748/ wjg.v17.i10.1362.
28. Ma B, Zhang T, Wan Y, Zhan F. [A case-control study of interleukin-10 gene -592A/C polymorphism and the risk of gastric cancer]. [Article in Chinese].
29. Mantel N, Haenszel W. Statistical aspects of the analysis of data from retrospective studies of disease. J Natl Cancer Inst. 1959;22(4):719-748. 30. Mehdinejad M, Sobhan MR, Mazaheri M, Shehneh MZ, Neamatzadeh
H, Kalantar SM. Genetic association between ERCC2, NBN, RAD51 gene variants and osteosarcoma risk: A systematic review and meta-analysis. Asian Pacific J Cancer Prev. 2017;18(5). doi:10.22034/APJCP.2017.18.5.1315. 31. Mocellin S, Marincola FM, Young HA. Interleukin-10 and the immune
response against cancer: a counterpoint. J Leukoc Biol. 2005;78(5):1043-1051. doi:10.1189/jlb.0705358.
32. Namazi A, Forat-Yazdi M, Jafari M, Farahnak S, Nasiri R, Foroughi E, et al. Association of Interleukin-10 -1082 a/G (Rs1800896) Polymorphism With Susceptibility To Gastric Cancer: Meta-Analysis of 6,101 Cases and 8,557 Controls. Arq Gastroenterol. 2018;55(1):33-40. doi:10.1590/ s0004-2803.201800000-18.
33. Oh SS, Chang SC, Cai L, Cordon-Cardo C, Ding BG, Greenland S, et al. Single nucleotide polymorphisms of 8 inflammation-related genes and their associations with smoking-related cancers. Int J cancer. 2010;127(9):2169-2182. doi:10.1002/ijc.25214.
34. Pan XF, Yang SJ, Loh M, Xie Y, Wen YY, Tian Z, et al. Interleukin-10 gene promoter polymorphisms and risk of gastric cancer in a Chinese population: single nucleotide and haplotype analyses. Asian Pac J Cancer Prev. 2013;14(4):2577-2582.
35. Qi M, Liu DM, Pan LL, Lin YX. Interleukin-10 gene -592C>A polymorphism and susceptibility to gastric cancer. Genet Mol Res. 2014;13(4):8954-8961. doi:10.4238/2014.October.31.10.
36. Sahami-Fard MH, Yazd EF, Khazaei Z, Neamatzadeh H. Lack of association between the CDH1 -160C C>A polymorphism and risk of gastrointestinal cancer - A meta-analysis. Asian Pacific J Cancer Prev. 2016;17(5). doi:10.7314/ APJCP.2016.17.5.2415.
37. Savage SA, Abnet CC, Haque K, Mark SD, Qiao YL, Dong ZW, et al. Polymorphisms in interleukin -2, -6, and -10 are not associated with gastric cardia or esophageal cancer in a high-risk Chinese population. Cancer Epidemiol Biomarkers Prev. 2004;13(9):1547-1549.
38. Shi J, Qu Y-P, Hou P. Pathogenetic mechanisms in gastric cancer. World J Gastroenterol. 2014;20(38):13804. doi:10.3748/wjg.v20.i38.13804. 39. Sicinschi LA, Lopez-Carrillo L, Camargo MC, Correa P, Sierra RA, Henry
RR, et al. Gastric cancer risk in a Mexican population: role of Helicobacter pylori CagA positive infection and polymorphisms in interleukin-1 and -10 genes. Int J cancer. 2006;118(3):649-657. doi:10.1002/ijc.21364. 40. Siegel RL, Miller KD, Jemal A. Cancer statistics, 2016. CA Cancer J Clin.
2016;66(1):7-30. doi:10.3322/caac.21332.
41. Sobhan MR, Mehdinejad M, Jamaladini MH, Mazaheri M, Zare-Shehneh M, Neamatzadeh H. Association between aspartic acid repeat polymorphism of the asporin gene and risk of knee osteoarthritis: A systematic review and meta-analysis. Acta Orthop Traumatol Turc. 2017;51(5). doi:10.1016/j. aott.2017.08.001.
42. Su SP, Yang ZB, Tian YL, Xiang Y, Wu M, Ma X. Relationship between Polymorphisms of IL-1ß-31, IL-10-819 and TNF-a-1031 Genes and Susceptibilities to H. Pylori Infection-Associated Gastric Ulcer and Cancer. Chinese Journal of Biologicals. 2010;23(5):517-520.
43. Sugimoto M, Furuta T, Shirai N, Nakamura A, Kajimura M, Sugimura H, et al. Effects of interleukin-10 gene polymorphism on the development of gastric cancer and peptic ulcer in Japanese subjects. J Gastroenterol Hepatol. 2007;22(9):1443-1449. doi:10.1111/j.1440-1746.2006.04613.x 44. Tan P, Yeoh K-G. Genetics and Molecular Pathogenesis of Gastric
Adenocarcinoma. Gastroenterology. 2015;149(5):1153-1162.e3. doi:10.1053/j. gastro.2015.05.059.
45. Wang P, An J, Zhu Y, Wan X, Zhang H, Xi S, et al. Association of three promoter polymorphisms in interleukin-10 gene with cancer susceptibility in the Chinese population: a meta-analysis. Oncotarget. 2017;8(37):62382-62399. doi:10.18632/oncotarget.18220.
46. Wu MS, Wu CY, Chen CJ, Lin MT, Shun CT, Lin JT. Interleukin-10 genotypes associate with the risk of gastric carcinoma in Taiwanese Chinese. Int J cancer. 2003;104(5):617-623. doi:10.1002/ijc.10987.
47. Xiao H, Jiang Y, Li R, Xia B. [Association of IL-10 gene polymorphisms with gastroduodenal diseases in Hubei Han population]. Zhonghua Yi Xue Yi Chuan Xue Za Zhi. 2009;26(4):423-426.
48. Xue H, Lin B, An J, Zhu Y, Huang G. Interleukin-10-819 promoter polymorphism in association with gastric cancer risk. BMC Cancer. 2012;12(1):102. doi:10.1186/1471-2407-12-102.
49. Yazdi MM, Jamalaldini MH, Sobhan MR, Jafari M, Mazaheri M, Zare-Shehneh M, et al. Association of ESRα Gene Pvu II T>C, XbaI A>G and BtgI G>A Polymorphisms with Knee Osteoarthritis Susceptibility: A Systematic Review and Meta-Analysis Based on 22 Case-Control Studies. Arch Bone Jt Surg. 2017;5(6). doi:10.22038/abjs.2017.22391.1578.
50. Yin J, Wang X, Wei J, Wang L, Shi Y, Zheng L,et al. Interleukin 12B rs3212227 T>G polymorphism was associated with an increased risk of gastric cardiac adenocarcinoma in a Chinese population. Dis esophagus Off J Int Soc Dis Esophagus. 2015;28(3):291-298. doi:10.1111/dote.12189. 51. Yuan LJ, Jin TB, Yin JK, Du XL, Wang Q, Dong R, et al. Polymorphisms
of tumor-related genes IL-10, PSCA, MTRR and NOC3L are associated with the risk of gastric cancer in the Chinese Han population. Cancer Epidemiol. 2012;36(6):e366-e372. doi:10.1016/j.canep.2012.05.016.
52. Zabaleta J. Multifactorial Etiology of Gastric Cancer. Methods Mol Biol. 2012;863:411-35. doi: 10.1007/978-1-61779-612-8_26.
53. Zambon CF, Basso D, Navaglia F, Belluco C, Falda A, Fogar P, et al. Pro- and anti-inflammatory cytokines gene polymorphisms and Helicobacter pylori infection: interactions influence outcome. Cytokine. 2005;29(4):141-152. doi:10.1016/j.cyto.2004.10.013.
54. Zeng X, Li Y, Liu T, Zhang J. Diverse H. pylori strains, IL-10 promoter polymorphisms with high morbidity of gastric cancer in Hexi area of Gansu Province, China. Mol Cell Biochem. 2012;362(1-2):241-248. doi:10.1007/s11010-011-1149-y.