BGD
12, 18463–18512, 2015
Simulating oxygen isotope ratios in tree
ring cellulose
S. G. Keel et al.
Title Page
Abstract Introduction
Conclusions References
Tables Figures
◭ ◮
◭ ◮
Back Close
Full Screen / Esc
Printer-friendly Version Interactive Discussion
Discussion
P
a
per
|
Discussion
P
a
per
|
Discussion
P
a
per
|
Discussion
P
a
per
|
Biogeosciences Discuss., 12, 18463–18512, 2015 www.biogeosciences-discuss.net/12/18463/2015/ doi:10.5194/bgd-12-18463-2015
© Author(s) 2015. CC Attribution 3.0 License.
This discussion paper is/has been under review for the journal Biogeosciences (BG). Please refer to the corresponding final paper in BG if available.
Simulating oxygen isotope ratios in tree
ring cellulose using a dynamic global
vegetation model
S. G. Keel1,a, F. Joos1, R. Spahni1, and M. Saurer2
1
University of Bern, Physics Institute, Climate and Environmental Physics & Oeschger Centre for Climate Change Research, Bern, Switzerland
2
Paul Scherrer Institute, Laboratory of Atmospheric Chemistry, Villigen, Switzerland a
currently at: Agroscope, Institute for Sustainability Sciences, Climate and Air Pollution, Zurich, Switzerland
Received: 20 October 2015 – Accepted: 2 November 2015 – Published: 16 November 2015
Correspondence to: S. G. Keel (sonjakeel@live.com)
BGD
12, 18463–18512, 2015
Simulating oxygen isotope ratios in tree
ring cellulose
S. G. Keel et al.
Title Page
Abstract Introduction
Conclusions References
Tables Figures
◭ ◮
◭ ◮
Back Close
Full Screen / Esc
Printer-friendly Version Interactive Discussion
Discussion
P
a
per
|
Discussion
P
a
per
|
Discussion
P
a
per
|
Discussion
P
a
per
|
Abstract
Records of stable oxygen isotope ratios in tree rings are valuable tools to reconstruct past climatic conditions and the response of trees to those conditions. So far they have not been made use of in global dynamic vegetation models, which integrate many hy-drological and physiological processes and could improve proxy-model comparisons.
5
Here we present an approach to simulate stem celluloseδ18O of trees using the LPX-Bern Dynamic Global Vegetation Model (LPX-LPX-Bern). Our results compare well with measured tree ringδ18O of thirty-one different forest stands mainly located in Europe. Temporal means over the last five decades as well as inter-annual variations for a sub-set of sites in Switzerland are captured well. A sensitivity analysis reveals that relative
10
humidity, temperature, and the water isotope boundary conditions have the largest in-fluence on simulated stem cellulose δ18O, followed by all climatic factors combined, whereas increasing atmospheric CO2 and nitrogen deposition exert no impact. We conclude that simulations with LPX-Bern are useful to investigate large-scale oxygen isotope patterns of tree-ring cellulose, to elucidate the importance of different
environ-15
mental factors on isotope variations and therefore help to reduce uncertainties in the interpretation ofδ18Oof tree-rings.
1 Introduction
Stable oxygen isotope ratios (18O/16O) are widely used to reconstruct past cli-matic conditions and to characterize the modern hydrological cycle. δ18O (δ18O=
20
[((18O/16O)sample/( 18
O/16O)standard)−1]×1000 [‰]) is routinely measured in various
cli-mate archives such as ice cores (Dansgaard, 1964; Johnsen et al., 2001; Jouzel et al., 2003; Severinghaus et al., 2009), speleothems (Fleitmann et al., 2004; McDermott, 2004), corals (Dunbar et al., 1994), ocean sediments (Shackleton and Obdyke, 1973; Elderfield and Ganssen, 2000), and tree rings (Libby et al., 1976; Treydte et al., 2006)
25
BGD
12, 18463–18512, 2015
Simulating oxygen isotope ratios in tree
ring cellulose
S. G. Keel et al.
Title Page
Abstract Introduction
Conclusions References
Tables Figures
◭ ◮
◭ ◮
Back Close
Full Screen / Esc
Printer-friendly Version Interactive Discussion
Discussion
P
a
per
|
Discussion
P
a
per
|
Discussion
P
a
per
|
Discussion
P
a
per
|
Regarding the tree ring archive, recent efforts were directed to documentδ18O vari-ability in stem cellulose from tree ring samples over the last millennium (e.g. Masson-Delmotte et al., 2005; Treydte et al., 2006) and the industrial period (Anderson et al., 1998; Miller et al., 2006). The spatial distribution of tree ringδ18O has been character-ized across large areas (e.g. Saurer et al., 2002; Herweijer et al., 2007; Treydte et al.,
5
2007). In addition, attempts have been made to unravel the processes that determine stem celluloseδ18O (e.g. Gessler et al., 2009; Offermann et al., 2011).
The cycling of water isotopes through the climate system including the transfer of wa-ter associated with gross primary productivity on land was successfully implemented in atmospheric general circulation and in Earth System Models (Joussaume et al.,
10
1984; Jouzel et al., 1987; Hoffmann et al., 1998; Noone and Simmonds, 2002; Sturm et al., 2005; Werner et al., 2011) to characterize the hydrological cycle. Model results are used to demonstrate that the El Niño Southern Oscillation imprints a pronounced signal on water isotopes (Hoffmann et al., 1998), to reconstruct past precipitation pat-terns (Risi et al., 2010), and to explainδ18O paleo data (Hoffmann et al., 2003). Model
15
results are evaluated against stable isotope ratios in precipitation (Joussaume et al., 1984), snow (Jouzel et al., 1987), ground water (Hoffmann et al., 1998), water vapor (Werner et al., 2011), and ice coreδ18O data (e.g. Risi et al., 2010). Because none of these models describesδ18O in stem cellulose, a direct model-data comparison is not yet possible for tree rings and global scale models. So far process-models describing
20
the transfer of isotopic signals from soil water and water vapor to leaf water, and finally stem cellulose were applied for single sites only (Roden et al., 2000; Ogée et al., 2009; Kahmen et al., 2011; Treydte et al., 2014). Yet, the implementation of such an ap-proach in large-scale global land biosphere models is missing. A large-scale apap-proach would have the advantage that many hydrological and physiological processes could
25
BGD
12, 18463–18512, 2015
Simulating oxygen isotope ratios in tree
ring cellulose
S. G. Keel et al.
Title Page
Abstract Introduction
Conclusions References
Tables Figures
◭ ◮
◭ ◮
Back Close
Full Screen / Esc
Printer-friendly Version Interactive Discussion
Discussion
P
a
per
|
Discussion
P
a
per
|
Discussion
P
a
per
|
Discussion
P
a
per
|
The goals of this study are (i) to describe the implementation of the stable water isotope fluxes and pools in the LPX-Bern Dynamic Global Vegetation Model (DGVM), includingδ18O in stem cellulose for direct model-proxy comparison, (ii) to estimate the large-scale spatial distribution ofδ18O in leaf water and stem cellulose, (iii) to quantify the drivers of spatio-temporal trends and variability of stem celluloseδ18O in the model
5
context and to assist in the interpretation of tree ringδ18O data, and (iv) to assess the model performance for large-scale spatial gradients, multi-decadal trends, and inter-annual variability with a focus on extra-tropical forests. We compiled time-averaged tree ringδ18O data from thirty-one boreal and temperate forest sites to capture spatial variability and use five tree-ring-δ18O records from Switzerland to detail local temporal
10
variability. Soil water and water vaporδ18O results from transient simulations with the model ECHAM5-JSBACH (Haese et al., 2013) over the past 50 years are applied as boundary conditions. Factorial experiments at the site scale are performed to identify drivers of decadal trends and inter-annual variability.
1.1 Isotope background
15
Evaporation and condensation are the two processes that predominantly influence wa-ter oxygen isotope ratios in the climate system. Wawa-ter molecules containing the lighwa-ter
16
O isotopes evaporate more readily compared to molecules containing the heavier
18
O. Therefore moisture evaporated from the ocean is depleted in 18O compared to ocean water, which has a δ18O of near zero per mil. As air cools by rising into the
20
atmosphere or moving toward the poles, moisture begins to condense and falls as pre-cipitation. Water vapor molecules containing18O condense more readily and rain is enriched in18O compared to its vapor source. As the air continues to move pole-ward into colder regions (temperature effect) or further inland (continental effect) the remain-ing moisture in the air as well as the water that condenses and precipitates become
25
BGD
12, 18463–18512, 2015
Simulating oxygen isotope ratios in tree
ring cellulose
S. G. Keel et al.
Title Page
Abstract Introduction
Conclusions References
Tables Figures
◭ ◮
◭ ◮
Back Close
Full Screen / Esc
Printer-friendly Version Interactive Discussion
Discussion
P
a
per
|
Discussion
P
a
per
|
Discussion
P
a
per
|
Discussion
P
a
per
|
modified through evaporation or mixing with ground water, the δ18O of surface soil water corresponds to that of precipitation averaged over a certain amount of time.
Plants take up water which carries this precipitation or soil water δ18O signature. During transport from roots to leaves isotope ratios are not modified (Wershaw et al., 1966). In the leaves, water becomes enriched in18O relative to source water as a result
5
of transpiration (Dongmann et al., 1974). The enrichment at the site of evaporation (the stomata) is primarily driven by the ratio of the vapor pressure outside vs. inside the leaf. Source water (i.e. soil water) that enters the leaf via the transpirational stream, mixes with the 18O-enriched water and dilutes the leaf water δ18O signal (a Péclet effect, Barbour et al., 2004). Bulk leaf water is therefore less18O-enriched when transpiration
10
rates are high. Sucrose formed in the leaves is 27 ‰ enriched in18O compared to leaf water due to fractionation during the exchange of oxygen between carbonyl groups in organic molecules and water (Sternberg et al., 1986). Sugars are then transported down the trunk where partial exchange with xylem water occurs before tree-ring cel-lulose is formed (Roden et al., 2000; Gessler et al., 2014). Based on isotope theory,
15
oxygen isotope ratios in tree rings serve as proxy data for relative humidity and reflect the signature of soil water (McCarroll and Loader, 2004). The relative strength of the humidity and soil water signal, however, is expected to vary due to the Péclet effect and oxygen isotope exchange during stem cellulose formation (see below) and is often difficult to quantify, which somewhat hampers current interpretation of tree-ring results.
20
Tree ring chronologies have been found to correlate with relative humidity (Burk and Stuiver, 1981; An et al., 2014; Xu et al., 2014) andδ18O of precipitation (Water-house et al., 2002). In addition tree ringδ18O archives are proxies for e.g. precipitation amounts (Treydte et al., 2006), the occurrence of droughts (Masson-Delmotte et al., 2005; Herweijer et al., 2007) and tropical cyclones (Miller et al., 2006), or leaf-to-air
25
vapor pressure differences (Kahmen et al., 2011).
BGD
12, 18463–18512, 2015
Simulating oxygen isotope ratios in tree
ring cellulose
S. G. Keel et al.
Title Page
Abstract Introduction
Conclusions References
Tables Figures
◭ ◮
◭ ◮
Back Close
Full Screen / Esc
Printer-friendly Version Interactive Discussion
Discussion
P
a
per
|
Discussion
P
a
per
|
Discussion
P
a
per
|
Discussion
P
a
per
|
A formulation of leaf water enrichment at the site of evaporation (i.e. the stomata) based on the model by Craig and Gordon (1965) is common to all models, but additional processes related to leaf water are resolved at varying degrees of complexity. Some models include boundary layer considerations (Flanagan et al., 1991) or the Péclet effects that reduce leaf water enrichment (Barbour et al., 2004; Farquhar and Gan,
5
2003). Others account for variations in isotopic exchange of oxygen with xylem water (Barbour and Farquhar, 2000), or weight diurnal variations in leaf water enrichment by photosynthetic rates (Cernusak et al., 2005). Here, we use a rather general approach with a single Péclet effect and constant isotopic exchange with xylem water, as we aim to simulate stem cellulose across a large range of different species. On the other hand,
10
we move a step forward in that we integrate a mechanistic model for stem cellulose
δ18O into a DGVM that allows us to cover large spatial and temporal scales and that explicitly considers numerous hydrological and physiological processes.
2 Material and methods
2.1 Model description
15
Stable oxygen isotopes were implemented in the LPX-Bern DGVM (Land surface Pro-cesses and eXchanges, Bern version 1.0) (Spahni et al., 2013; Stocker et al., 2013). LPX-Bern describes the evolution of vegetation cover, carbon (C) and N dynamics in soil and vegetation, and the exchange of water, CO2, C isotopes, methane, and nitrous
oxide between the atmosphere and the land biosphere.
20
The model version applied here features a horizontal resolution of 3.75◦
×2.5◦, a
ver-tically resolved soil hydrology with heat diffusion and an interactive thawing-freezing scheme (Gerten et al., 2004; Wania et al., 2009). The soil hydrology scheme is similar to a concurrent LPX version (Murray et al., 2011; Prentice et al., 2011). There are ten plant functional types (PFTs) that have distinct bioclimatic limits and differ in their
phys-25
BGD
12, 18463–18512, 2015
Simulating oxygen isotope ratios in tree
ring cellulose
S. G. Keel et al.
Title Page
Abstract Introduction
Conclusions References
Tables Figures
◭ ◮
◭ ◮
Back Close
Full Screen / Esc
Printer-friendly Version Interactive Discussion
Discussion
P
a
per
|
Discussion
P
a
per
|
Discussion
P
a
per
|
Discussion
P
a
per
|
Ruosch et al., 2015). The distribution of fine roots in the soil profile is also PFT-specific and leads to competition for water. Daily evapotranspiration is calculated for each PFT as the minimum of a plant- and soil-limited supply function (Esupply) and the demand
for transpiration (Edemand).Esupplyis the product of root-weighted soil moisture
availabil-ity and a maximum transpiration rate that is equal for all PFTs.Edemand is calculated 5
following Monteith’s (Monteith, 1995) empirical relation between evaporation efficiency and surface conductance,
Edemand=Eeqαm
1−exp
−gcφ gm
, (1)
whereEeq is the equilibrium evaporation rate, gm and αm are empirical parameters,
andgcthe canopy conductance ,φthe fraction of present foliage area to ground area. 10
Equation (1) is solved forEdemand using the non-water-stressed potential canopy
con-ductance as calculated by the photosynthesis routine for a fixed ratio (0.8) between the CO2mole fraction in the stomatal cavity and the ambient air. In case of water-stressed
conditions whenEdemandexceedsEsupply, canopy conductance and photosynthesis are
jointly and consistently down-regulated;Edemand is set to Esupply and Eq. (1) is solved 15
forgc.
Photosynthesis is modeled following (Collatz et al., 1991, 1992), which is a Farquhar model (Farquhar et al., 1980; Farquhar and von Caemmerer, 1982) generalized for global modeling purposes. The N content and Rubisco activity of leaves are assumed to vary seasonally and with canopy position in a way to maximize net assimilation at the
20
leaf level. For C3plants assimilation is a function of the daily integral of absorbed pho-tosynthetically active radiation. For a detailed description see Haxeltine and Prentice (1996b, a).
Canopy conductance,gc, is linked to daytime assimilation,Adt, through
gc=gmin+
1.6Adt
ca(1−λ)
, (2)
BGD
12, 18463–18512, 2015
Simulating oxygen isotope ratios in tree
ring cellulose
S. G. Keel et al.
Title Page
Abstract Introduction
Conclusions References
Tables Figures
◭ ◮
◭ ◮
Back Close
Full Screen / Esc
Printer-friendly Version Interactive Discussion
Discussion
P
a
per
|
Discussion
P
a
per
|
Discussion
P
a
per
|
Discussion
P
a
per
|
wheregminis a PFT specific minimum canopy conductance andcais the ambient mole
fraction of CO2andλthe ratio between the CO2mole fraction in the stomatal cavity and
the ambient air. The equations for water supply and demand, assimilation, and canopy conductance are solved simultaneously by varyingλto yield self-consistent values for
λ,gc, assimilation and transpiration. 5
2.2 Leaf water and stem celluloseδ18O model
To calculate δ18O in leaf water we use the Péclet modified Craig–Gordon (PMCG) model as described e.g. in Kahmen et al. (2011).
The evaporative enrichment of leaf water above the plant’s source water at the site of evaporation (∆18Oe), is based on the Craig–Gordon formulation (Craig and Gordon,
10
1965; Dongmann et al., 1974)
∆18Oe=ε++εk+
∆18Ov−εk ea
ei
(3)
whereε+ is the temperature-dependent equilibrium fractionation factor between liquid and vapor water and is calculated as
ε+=2.644−3.206 10 3
Tl !
+1.534 10
6
Tl2 !
(‰), (4)
15
with Tl the leaf temperature in K (Bottinga and Craig, 1969 in Barbour, 2007). ε+
in-creases with decreasing temperature and is around 8.8 ‰ at 30◦C and around 11.5 ‰
at 0◦C.ε
kis the kinetic fractionation factor for water vapor diffusion from the leaf to the
atmosphere (32 ‰),∆18OVdescribes the oxygen isotope enrichment of water vapor in
the atmosphere above source water, andea/ei is the ratio of ambient to intercellular
20
vapor pressures. This ratio is equal to relative humidity when leaf and air temperatures are similar andeiis at saturation pressure. We assume that leaf temperature is
BGD
12, 18463–18512, 2015
Simulating oxygen isotope ratios in tree
ring cellulose
S. G. Keel et al.
Title Page
Abstract Introduction
Conclusions References
Tables Figures
◭ ◮
◭ ◮
Back Close
Full Screen / Esc
Printer-friendly Version Interactive Discussion
Discussion
P
a
per
|
Discussion
P
a
per
|
Discussion
P
a
per
|
Discussion
P
a
per
|
All other results were derived with the expanded model that includes a Péclet effect. The Péclet number is defined as
℘=LE
cD, (5)
and accounts for the dilution of 18O-enriched leaf water by unenriched source water that enters the leaf via the transpirational stream (E, mol m−2s−1) and is e
ffective over
5
a path length L (set to 0.03 m) (Farquhar and Lloyd, 1993). c is the molar density of water (55.5×10³mol m−3) and D the temperature dependent diffusivity of H182 O in
water:
D=10−8exp
−0.4+1528 Tl
+−554 368
Tl2 !
(m2s−1). (6)
Bulk leaf water18O enrichment can then be calculated as
10
∆18OLW=
∆18Oe 1−e−℘
℘ (7)
∆18OLWis smaller than∆ 18
Oeand approaches∆ 18
Oefor small transpiration ratesE. In
regions with high leaf transpiration rates such as high latitudes the reduction of∆18Oe due to the Péclet effect is most strongly expressed (Fig. S1 in the Supplement). Leaf waterδ18O is
15
δ18O
LW= ∆18OLW+δ18OSW. (8)
Stem cellulose isotopic composition is calculated as
δ18OSC=pexpx
δ18OSW+εwc
+(1−pexpx)
δ18OLW+εwc
(9)
BGD
12, 18463–18512, 2015
Simulating oxygen isotope ratios in tree
ring cellulose
S. G. Keel et al.
Title Page
Abstract Introduction
Conclusions References
Tables Figures
◭ ◮
◭ ◮
Back Close
Full Screen / Esc
Printer-friendly Version Interactive Discussion
Discussion
P
a
per
|
Discussion
P
a
per
|
Discussion
P
a
per
|
Discussion
P
a
per
|
whereεwcis the fractionation betweenδ 18
O of water and theδ18O of the primary prod-ucts of photosynthesis of 27 ‰ (Epstein et al., 1977),pexis the proportion of
exchange-able oxygen in cellulose formed from sucrose, andpx is the proportion of δ 18
OSW at the site of cellulose formation (Roden et al., 2000). For our simulations we used val-ues of 0.4 for pex (Cernusak et al., 2005; Sternberg, 2009) and 1.0 for px (Kahmen 5
et al., 2011).
Photosynthesis and plant water fluxes and thus changes in leaf water and stem cel-lulose δ18O are computed with a daily time step. Because stem cellulose formation is restricted to the vegetation period in temperate and boreal regions, we apply posi-tive net primary production (NPP) as weight to compute time-averaged stem cellulose
10
and leaf water δ18O and apply a cutoff of 1.0 g C m−2month−1. This means that
an-nual δ18O of stem cellulose is calculated only based on months with a NPP higher than 1.0 g C m−2month−1 and months with high NPP have a stronger weight. E
ffects of C storage related to the incorporation of photo assimilates from previous years into current year’s cellulose is not accounted for (Gessler et al., 2007).
15
2.3 Input data
Monthly gridded meteorological data (temperature, precipitation, cloud cover, and num-ber of wet days (CRU TS v. 3.21; Harris et al., 2014), annual atmospheric N-deposition fields (Lamarque et al., 2011), and atmospheric CO2 (Etheridge et al., 1998; Mac-Farling Meure et al., 2006) are prescribed to LPX-Bern. Monthly soil water δ18O,
20
water vapor δ18O and relative humidity data are from a simulation with the cou-pled atmosphere–land surface model ECHAM5-JSBACH for the period 1960 to 2012 (Haese et al., 2013).
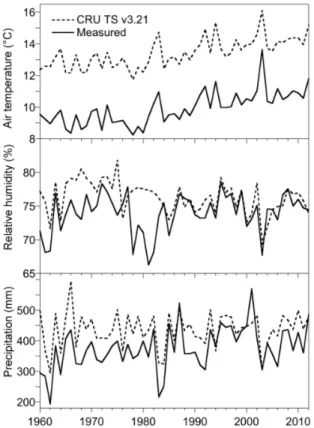
For five tree-ring sites in Switzerland (see Sect. 2.5), we compared the CRU climate input data against relative humidity from meteorological stations (Meteoswiss) and
ho-25
BGD
12, 18463–18512, 2015
Simulating oxygen isotope ratios in tree
ring cellulose
S. G. Keel et al.
Title Page
Abstract Introduction
Conclusions References
Tables Figures
◭ ◮
◭ ◮
Back Close
Full Screen / Esc
Printer-friendly Version Interactive Discussion
Discussion
P
a
per
|
Discussion
P
a
per
|
Discussion
P
a
per
|
Discussion
P
a
per
|
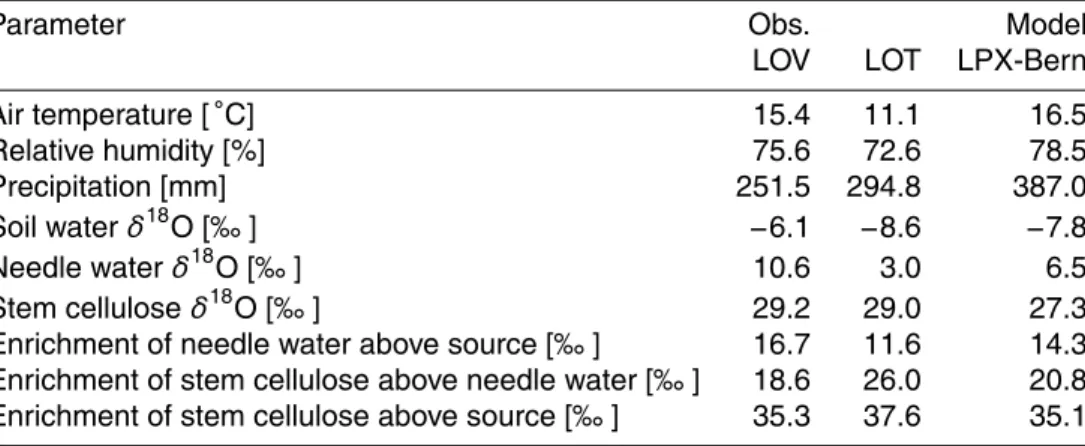
humidity input data are slightly higher than data from meteorological stations in the 60s and 70s and similar thereafter (Fig. 3). Air temperatures for the corresponding pixel from the gridded CRU data set are around 4◦C higher than in the Meteoswiss data at
DVN, as the CRU data represent averages for a large area. The CRU data for the sites LOV and LOT compare relatively well with the meteorological station data (Table 1),
5
except for higher precipitation (both sites) and higher air temperature (site LOT). A first-order correction is applied to the relative humidity data from ECHAM5-JSBACH to account for the daily cycle. Leaf water18O enrichment is driven by daytime relative humidity (when stomata are open), whereas the available ECHAM5-JSBACH data represent 24 h averages. Relative humidity is reduced uniformly by an absolute
10
value of 10 % based on a comparison of 24 h against 08:00–18:00 LT summertime av-erage relative humidity values in temperate and boreal regions (Kearney et al., 2014).
ECHAM5-JSBACH includes the atmosphere model ECHAM5 (Roeckner et al., 2003), and the land surface scheme JSBACH (Jena Scheme for Biosphere– Atmosphere Interaction in Hamburg; Raddatz et al., 2007). The model comprises three
15
surface water reservoirs: a snow layer, water at the skin layer of the canopy or bare soil, and a soil water layer. These three pools are each represented by a single layer bucket model, and each of them has a prescribed maximum field capacity. The drainage to groundwater has the isotopic composition of the soil water. No fractionation during snowmelt is assumed. Liquid precipitation and melt water are added to the skin layer
20
reservoir and the soil reservoir, respectively. After these reservoirs are filled, the resid-ual water yields the runoff.
In order to calculate evapotranspiration in ECHAM5-JSBACH, each grid cell is di-vided into four cover fractions: one covered by snow, one covered with water in the skin layer reservoir, one covered by vegetation, and one covered by bare soil. The complete
25
BGD
12, 18463–18512, 2015
Simulating oxygen isotope ratios in tree
ring cellulose
S. G. Keel et al.
Title Page
Abstract Introduction
Conclusions References
Tables Figures
◭ ◮
◭ ◮
Back Close
Full Screen / Esc
Printer-friendly Version Interactive Discussion
Discussion
P
a
per
|
Discussion
P
a
per
|
Discussion
P
a
per
|
Discussion
P
a
per
|
2.4 Simulations
A spinup of 1500 years is performed with LPX-Bern, where an analytical solution for the C inventory in slow soil pools is applied after 1000 years to ensure that all C pools have established equilibrium conditions by the end of the spinup. Atmospheric CO2 concen-trations of the year 1900, atmospheric N deposition rates of 1901, climate data from
5
1901–1931, andδ18O input data for 1960 are used during the spinup. Transient simula-tions are started in 1901 forced by atmospheric CO2, annual N deposition (Lamarque et al., 2011), and monthly climate (see Sect. 2.3). For the years 1901–1960 we use monthly relative humidity, soil waterδ18O and vaporδ18O of 1960 and 1960–2012 data thereafter. All runs are for potential vegetation (no land use) and feedbacks between C
10
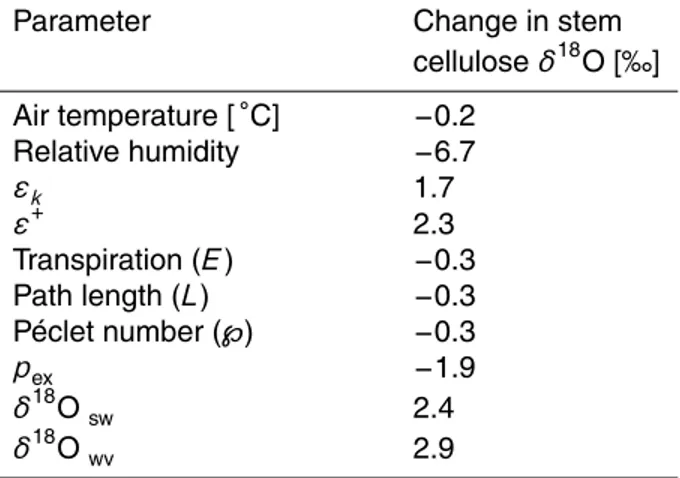
and N cycles are enabled (i.e. potential limitation of growth by low N availability). In factorial simulations, model parameters or input data are increased individually by 10 % and the impact is evaluated for stem celluloseδ18O (Table 2) for the June, July, and August 1960 average for the grid cell that includes the site DVN. In another suite of sensitivity experiments the influence of 20th century trends and variability on simulated
15
δ18O is explored (see Sect. 3.3). Individual input data are kept at initial conditions, while all others are prescribed as in the standard simulation. For these sensitivity ex-periments monthly means of 1901–1931 are applied for air temperature, precipitation, and climate (temperature, precipitation, cloud cover, number of wet days), and monthly means of 1960–1969 for relative humidity, soil waterδ18O and water vaporδ18O, and
20
1901 values for atmospheric CO2 and N deposition. In a similar factorial experiment,
the Péclet effect was excluded. The time series were smoothed using Stineman func-tions. For the site DVN we carried out an additional series of experiments to evaluate the influence of a five degree higher leaf than air temperature, a temperature depen-dent biochemical fractionation as described in Sternberg and Ellsworth (2011),
25
εwc=0.0084T2−0.51T+33.172, (11)
BGD
12, 18463–18512, 2015
Simulating oxygen isotope ratios in tree
ring cellulose
S. G. Keel et al.
Title Page
Abstract Introduction
Conclusions References
Tables Figures
◭ ◮
◭ ◮
Back Close
Full Screen / Esc
Printer-friendly Version Interactive Discussion
Discussion
P
a
per
|
Discussion
P
a
per
|
Discussion
P
a
per
|
Discussion
P
a
per
|
2.5 Tree-ringδ18O data
To validate our model with regard to spatial variations, we compare mean δ18O of stem cellulose for the years 1960–2003 (or until 2012 depending on availability of data) against observations from 31 sites in temperate and boreal forests (Table S1 in the Supplement). The sites span an area from Spain to Pakistan in the East–West and in
5
the North–South from Morocco to Finland, but the majority is located in Europe. Mea-surements were performed on different tree species. In most cases, the correspond-ing plant functional type (temperate broad-leaved summergreen, temperate or boreal needle-leaved evergreen, or boreal needle-leaved summergreen) is simulated by LPX-Bern at the location of interest and used for model-data comparison. Otherwise, we
10
use simulatedδ18O values of the dominant tree plant functional type. This is permis-sible as the differences inδ18O between functional types are rather minor (Fig. 4; the modeled data represent different tree types for the identical grid cell).
Five sites in Switzerland were chosen for a comparison of time series. DVN is a West-facing site at 1660 m above sea level (a.s.l.) dominated by the evergreenPicea abies 15
(L.) H. Karst near the village of Davos. The sites on the mountain Lägern (LAA and LAB), are on similar altitudes of about 720 m a.s.l., have a South aspect, but are on dif-ferent soil types. Site LAA is on sandstone and is dominated by the evergreen needle-leaved Abies alba Mill. and the deciduous broad-leaved Fagus sylvatica L., site LAB is on limestone and is dominated by the two deciduous broad-leaved species F. syl-20
vaticaand Fraxinus excelsior L. The North-facing site in the Lötschen Valley (N19) is at 2000 m a.s.l. and is dominated by the evergreenP. abiesand the deciduous needle-leavedLarix deciduaMill. Close by is an additional site LOE in the Lötschen Valley at 2100 m a.s.l. that has a South–North exposure and is dominated byL. decidua(Kress et al., 2010).
25
BGD
12, 18463–18512, 2015
Simulating oxygen isotope ratios in tree
ring cellulose
S. G. Keel et al.
Title Page
Abstract Introduction
Conclusions References
Tables Figures
◭ ◮
◭ ◮
Back Close
Full Screen / Esc
Printer-friendly Version Interactive Discussion
Discussion
P
a
per
|
Discussion
P
a
per
|
Discussion
P
a
per
|
Discussion
P
a
per
|
LOT is in immediate neighborhood to the site LOE but different trees were sampled at the two sites. In contrast to all other sites, whole woodδ18O was analyzed instead of cellulose. We therefore increased the whole wood values by 4.0 ‰ to convert them to cellulose, according to the constant difference documented in larch for the last decades (Sidorova et al., 2008).
5
3 Results
3.1 Large scale, global patterns ofδ18O in soil water, leaf water, and stem
cellulose
We first analyze the large scale, global patterns ofδ18O in soil and leaf water and in stem cellulose to identify characteristic features and to evaluate the plausibility of
sim-10
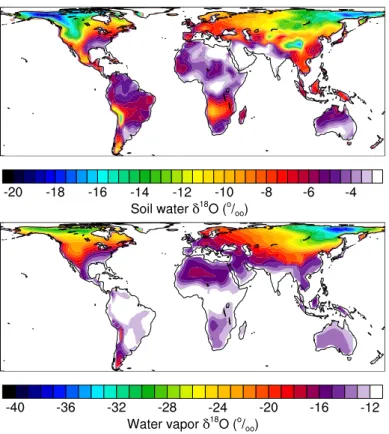
ulated results. Annual mean soil waterδ18O values simulated by ECHAM5-JSBACH range between−1 and−21 ‰ (1990–1960; Fig. 1) and are in the same range as
recon-structions ofδ18O in precipitation from the Global Network for Isotopes in Precipitation (GNIP) database (Bowen and Revenaugh, 2003). For precipitation Haese et al. (2013) estimates that the root mean square error between precipitation δ18O simulated by
15
ECHAM5-JSBACH and the GNIP data is 1.78 ‰. The simulated soil waterδ18O pattern represents major features as identified forδ18O in precipitation (e.g., Bowen and Reve-naugh, 2003). Namely, a decrease inδ18O from mid-latitudes to high latitudes, lower signatures at high elevation, and a decrease from coastal regions towards the conti-nental interior. The simulated soil waterδ18O pattern generally agrees with the pattern
20
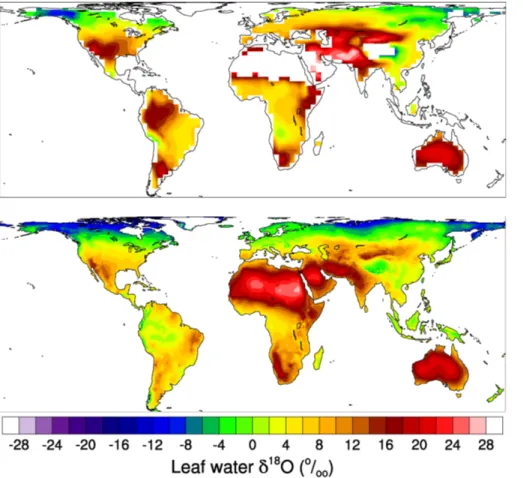
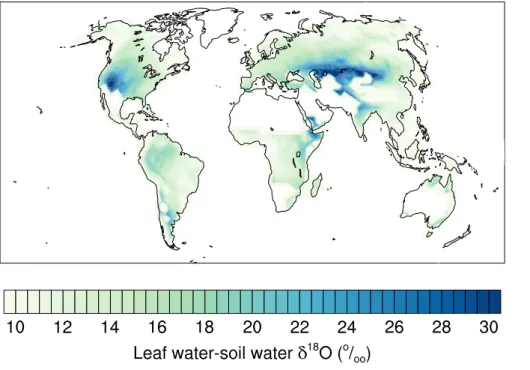
interpolated for precipitation from the GNIP data (Bowen and Revenaugh, 2003). Simulated leaf water δ18O averaged across all plant functional types range from about−14 ‰ at high latitudes to about 28 ‰ in the Middle East (Fig. 2, upper panel).
Thus, the simulatedδ18O values in leaf water at the grid-cell and climatological scale span a range of∼40 ‰.δ18O values in leaf water results from the combination of soil 25
BGD
12, 18463–18512, 2015
Simulating oxygen isotope ratios in tree
ring cellulose
S. G. Keel et al.
Title Page
Abstract Introduction
Conclusions References
Tables Figures
◭ ◮
◭ ◮
Back Close
Full Screen / Esc
Printer-friendly Version Interactive Discussion
Discussion
P
a
per
|
Discussion
P
a
per
|
Discussion
P
a
per
|
Discussion
P
a
per
|
in the evaporative enrichment ofδ18O in leaf water mainly due to large differences in air humidity, i.e. higher enrichment in arid regions than high latitude regions (Fig. 5). These differences are much larger than the differences between annual mean δ18O in soil water from ECHAM5-JSBACH and reconstructedδ18O in precipitation discussed in the previous paragraph. This suggests that soil waterδ18O fields from ECHAM5 provide
5
a reasonable input to force LPX-Bern simulations and that evaporative enrichment is a major process shaping the spatial pattern in leaf waterδ18O.
West et al. (2008) combined annual averageδ18O data in precipitation (Bowen and Revenaugh, 2003), monthly climatology for air temperature and relative humidity, and elevation data with the Craig–Gordon formulation for evaporative enrichment to
esti-10
mate leaf waterδ18O. Our values roughly agree with the Geographic Information Sys-tem (GIS) model by West et al. (2008) (Fig. 2, lower panel), but differences exist in many regions. Our estimates tend to be substantially higher in e.g. Western Amazonia, Central Siberia and the Middle East, while they are significantly lower for small regions in Central Africa and China. Leaf waterδ18O in Australia and Eastern Russia agree
15
comparatively well.
Differences in simulated leaf water δ18O between the two approaches are much larger than differences between annual mean δ18O in precipitation, used by West et al. (2008) as input to their GIS approach, and annual meanδ18O in soil water from ECHAM5-JSBACH. Thus, uncertainties in the source water input data do not explain
20
the differences between the two approaches. The mechanistic approach implemented in LPX-Bern to model leaf water isotopic signatures considers seasonally varyingδ18O of both, source water and atmospheric water vapor, and models explicitly daily stomatal conductance, transpiration, and associatedδ18O transport.
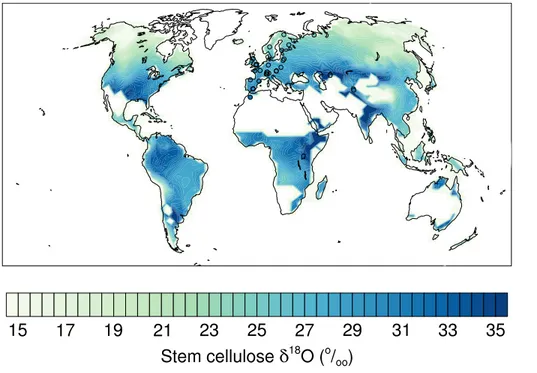
Celluloseδ18O is in the expected range for most regions (Fig. 6). Generally values
25
BGD
12, 18463–18512, 2015
Simulating oxygen isotope ratios in tree
ring cellulose
S. G. Keel et al.
Title Page
Abstract Introduction
Conclusions References
Tables Figures
◭ ◮
◭ ◮
Back Close
Full Screen / Esc
Printer-friendly Version Interactive Discussion
Discussion
P
a
per
|
Discussion
P
a
per
|
Discussion
P
a
per
|
Discussion
P
a
per
|
However, the simulated range ofδ18O in cellulose is comparable to theδ18O range in soil water (or precipitation), but only half as large as theδ18O range in leaf water. Due to biochemical fractionation during cellulose synthesis (εwc), cellulose δ
18
O is up to 27 ‰ higher compared to leaf waterδ18O and cellulose depends linearly on leaf water
δ18O. The difference between stem cellulose and leaf water δ18O can be calculated
5
by combining equations 8 and 9 and this yields a simple linear relationship with leaf water enrichment (δ18OSC−δ
18
OLW=εwc−pexpx∆ 18
OLW, wherepexpxis 0.4 andεwc=
27 ‰). The difference between cellulose and leaf waterδ18O is thus highest in regions with very low leaf water enrichment such as at high latitudes. The simulated enrichment of stem cellulose with respect to soil water is also proportional to leaf water enrichment
10
(δ18OSC−δ18OSW= ∆ 18
OLW(1−pexpx)+εwc). The slope of this relationship is with 0.6
smaller than unity, which explains the smaller spatial gradients in stem celluloseδ18O compared to leaf waterδ18O.
3.2 Comparison of simulated stem celluloseδ18O with tree ring data
Next, we quantitatively evaluate simulatedδ18O in stem cellulose by comparing
mod-15
eled long-term (∼50 years) averages at individual grid cells with measuredδ18O from
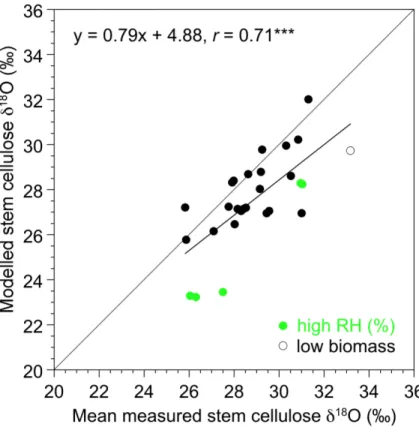
local, site-specific tree ring data (Table S1). Simulated stem celluloseδ18O agrees well (Fig. 7) with measured tree ring data from 31 sites mainly located in European tem-perate and boreal forests (circles in Fig. 6). The model captures the observation-based range inδ18O for these sites from about 26 to 32 ‰ and the correlation between model
20
and tree ring data isr=0.71 across all data points. In general the model tends to un-derestimateδ18O values of stem cellulose. Modeled grid cell values at five Swiss sites, that will be used to explore temporal dynamics, also show somewhat lower δ18O in stem cellulose (0–2 ‰) than the tree ringδ18O data suggest (Figs. 4 and 8). This holds for the alpine, high altitude sites at DVN and in the Lötschen Valley (N19, LOE) as
25
humid-BGD
12, 18463–18512, 2015
Simulating oxygen isotope ratios in tree
ring cellulose
S. G. Keel et al.
Title Page
Abstract Introduction
Conclusions References
Tables Figures
◭ ◮
◭ ◮
Back Close
Full Screen / Esc
Printer-friendly Version Interactive Discussion
Discussion
P
a
per
|
Discussion
P
a
per
|
Discussion
P
a
per
|
Discussion
P
a
per
|
ity (annual mean 1960–2012 weighted by NPP is>80 %, Fig. 7 green symbols (sites FON, GUT, INA, LIL, MOT)). This bias at high humidity sites could potentially arise from a bias inδ18O of soil water, inδ18O of water vapor, or in relative humidity, and thus water pressure deficit, and could be related to differences in the spatial scale, i.e. local measurements at individual trees vs. averages over all trees of a plant functional type
5
and over a grid cell. We note that daily-average relative humidity is reduced by 10 % for the simulation of leaf waterδ18O to account for the lower daytime vs. 24 h humidity; un-certainties in this correction have a larger influence on the water vapor pressure deficit, the driving force for transpiration, at humid sites. At a single site (CAZ) where LPX-Bern simulates very low biomass of less than 30 g C m−2,δ18O is also underestimated 10
(Fig. 7). Excluding these sites yields a correlation coefficient of r=0.65, which is not higher than for all sites. We conclude that LPX-Bern is able to represent the magnitude and the spatial climatological pattern of δ18O in stem cellulose in Europe, generally within the uncertainty of the soil waterδ18O input data.
This conclusion is further corroborated by comparing LPX-Bern results with δ18O
15
data from two Swiss sites (LOV, LOT) for which detailed δ18O data are available for soil water, needle water, and stem wood (Table 1), but for a single year only. Simulated enrichment of needle water above soil water as well as simulated enrichment of stem cellulose above needle water is within the observed range at the two sites (Table 1). We note that this comparison is somewhat hampered by the large variability in the weekly
20
samples (e.g., for leaf waterδ18O at LOV: 3.9–16.4 ‰ and at LOT:−4.6–11.4 ‰) that
LPX-Bern cannot reproduce because the model is driven by monthly data.
The inter-annual variability and decadal-scale trends of stem celluloseδ18O are an-alyzed for five tree ring sites in Switzerland and for the period 1960 to 2012 for which temporally resolved input data from ECHAM5-JSBACH are available (Figs. 4 and 8).
25
BGD
12, 18463–18512, 2015
Simulating oxygen isotope ratios in tree
ring cellulose
S. G. Keel et al.
Title Page
Abstract Introduction
Conclusions References
Tables Figures
◭ ◮
◭ ◮
Back Close
Full Screen / Esc
Printer-friendly Version Interactive Discussion
Discussion
P
a
per
|
Discussion
P
a
per
|
Discussion
P
a
per
|
Discussion
P
a
per
|
LOE: deciduous needle-leaved) selected for the comparison with the tree ring δ18O data.
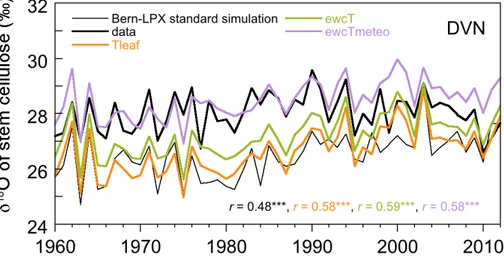
The simulated stem celluloseδ18O time series capture the measured evolution and inter-annual variability (Figs. 4 and 8). Based on visual comparison, the correlation between simulated and measured stem cellulose δ18O is best in the 60s and early
5
70s and is weaker thereafter. Model values increase after 1990 probably due to higher temperature and soil water δ18O, which is not recognized in the tree ring data. For the entire time series the correlations range between 0.48 and 0.7, with the highest value at LAA (r =0.7) in the Swiss central plateau (Fig. 4) and the lowest value at the alpine site DVN (r =0.48; Fig. 8). The correlation coefficients are comparable to
10
the correlations between the four tree ring series in the Swiss Central Plateau (LAA, LAB) and the Lötschen Valley (N19, LOE) which range between 0.55 and 0.82. In other words, the correlation between measured and modeled grid cell values reflects site-to-site variability within the grid-cell.
An extreme heat wave hit Europe and Switzerland in 2003 (Figs. 3, S2, and S3)
15
with JJA temperatures of 3◦C above the 1961 to 1990 mean (Schär et al., 2004) and
one expects to find extreme values inδ18O. Indeed, simulated stem cellulose δ18O peaks in this year with record or near-record high values for the analysis period (Figs. 4 and 8). Very low humidity and high air temperatures most likely lead to a strong leaf water δ18O enrichment. Surprisingly, the response inδ18O in the tree ring data
20
is different for different sites. Measurements at LAA, N19, and LOE show a strong peak in δ18O, DVN a small peak, and site LAB even lower values than during the previous and following year (Figs. 4 and 8). Apparently, local differences in conditions or different reactions of different tree species may mask the expected drought signal in stem celluloseδ18O. A well-known phenomenon is that extreme conditions may not
25
BGD
12, 18463–18512, 2015
Simulating oxygen isotope ratios in tree
ring cellulose
S. G. Keel et al.
Title Page
Abstract Introduction
Conclusions References
Tables Figures
◭ ◮
◭ ◮
Back Close
Full Screen / Esc
Printer-friendly Version Interactive Discussion
Discussion
P
a
per
|
Discussion
P
a
per
|
Discussion
P
a
per
|
Discussion
P
a
per
|
3.3 Sensitivity analysis to explore the influence of individual drivers
Simulated variability in stem celluloseδ18O arises from various drivers and their influ-ence is quantified within LPX-Bern. In the standard simulation with the combination of all drivers, air temperature, soil water δ18O and water vapor δ18O are positively cor-related with celluloseδ18O as demonstrated for site DVN (Fig. 8). In contrast relative
5
humidity and precipitation are negatively correlated with celluloseδ18O. The correla-tion is strongest with soil waterδ18O suggesting a high dependence of our results on the isotope input data.
The influence of various drivers on celluloseδ18O is further investigated in transient factorial simulations where individual drivers were kept at their climatological mean
val-10
ues representative for the early 20th century for the meteorological variables temper-ature, precipitation, cloud cover, and number of wet days, and 1960 values for relative humidity,δ18O soil water and water vapor input data. The results (Fig. 9) show that, in order of importance, variations in relative humidity, temperature, δ18O in soil wa-ter, and water vaporδ18O force decadal-scale and inter-annual variability in cellulose
15
δ18O. The simple sensitivity analysis for the site DVN, where input data or parameters were increased by 10 %, also reveals that stem celluloseδ18O is sensitive to changes in relative humidity, soil water and water vaporδ18O (Table 2). Precipitation had no in-fluence on stem celluloseδ18O in the transient simulation (Fig. 9). In contrast, account-ing for the Péclet effect, resulted in consistently lower values with nearly no influence
20
on inter-annual variation. Atmospheric CO2had a very minor effect on celluloseδ 18
O (<0.04 ‰ except for a single year with an effect of 0.18 ‰), while N deposition had no influence. In years when relative humidity and temperature had a positive effect, the combined effect of temperature, precipitation, number of wet days and cloud cover (termed “climate” in Fig. 9) was often large and also positive. In years when the
influ-25
BGD
12, 18463–18512, 2015
Simulating oxygen isotope ratios in tree
ring cellulose
S. G. Keel et al.
Title Page
Abstract Introduction
Conclusions References
Tables Figures
◭ ◮
◭ ◮
Back Close
Full Screen / Esc
Printer-friendly Version Interactive Discussion
Discussion
P
a
per
|
Discussion
P
a
per
|
Discussion
P
a
per
|
Discussion
P
a
per
|
The combination of changes in the meteorological drivers temperature, precipitation, cloud cover, and number of wet days leads to slightly higher decadal-averaged values in stem celluloseδ18O (+0–2 ‰) towards the end of the simulation (Fig. 9a). However, these values are not unusual in the context of the decadal variability simulated for the past five decades.
5
Sensitivities of cellulose δ18O to the input data are similar at all sites (Fig. 9c–e). Compared to DVN, the magnitude of the decadal-scale trends induced by “climate” and soil waterδ18O changes are somewhat smaller at other sites though. Conversely, changes in relative humidity have a stronger influence at LAB and N19. At all sites, the prescribed changes in relative humidity cause on average lower cellulose δ18O
10
during the 1980s than compared to the end of the simulation. Decadal-scale variability is also related to changes in soil waterδ18O. In particular, soil waterδ18O variations caused an increase in stem cellulose δ18O of about 0.3 to 0.5 ‰ in the 1980s that persisted thereafter (Fig. 9e). A similar trend was simulated for “climate”, but with more variability between sites. At N19 the “climate” effect was always lowest and there was
15
no clear trend. In brief, LPX-Bern simulates substantial inter-annual and decadal scale variability in stem celluloseδ18O which is attributable to variability in relative humidity, temperature, andδ18O in soil water and vapor.
West et al. (2008) assumed that leaf temperature exceeds air temperature by 5◦C in
their implementation of the Craig–Gordon model. Increasing leaf temperature by five
20
degrees compared to air temperature improved the correlation of simulated and mea-sured stem celluloseδ18O at DVN although the absolute values did not change much compared to the original simulation (Fig. 10, “Tleaf” vs. “LPX-Bern standard simula-tion”: 26.64 ‰ vs. 26.47 ‰ (average for 1960–2012)). The sign of the effect varied from year to year. In contrast, accounting for a temperature dependent biochemical
fraction-25
ation (“ewcT”) led to consistently higher celluloseδ18O (27.21 ‰), but the correlation coefficient did not improve compared to the “Tleaf” simulation. When the temperature-dependent formulation forεwc was combined with temperature forcing from a nearby
BGD
12, 18463–18512, 2015
Simulating oxygen isotope ratios in tree
ring cellulose
S. G. Keel et al.
Title Page
Abstract Introduction
Conclusions References
Tables Figures
◭ ◮
◭ ◮
Back Close
Full Screen / Esc
Printer-friendly Version Interactive Discussion
Discussion
P
a
per
|
Discussion
P
a
per
|
Discussion
P
a
per
|
Discussion
P
a
per
|
even slightly higher than the measured data (28.47 ‰ vs. 28.02 ‰, average for 1960– 2012). The correlation remained equally good though compared to the simulation with a temperature dependent εwc and CRU climate. We also evaluated temporal mean
stem cellulose across all sites. Compared to the original simulations (Fig. 7) the cor-relation between modeled and measured data was slightly lower ifεwcwas allowed to 5
depend on temperature (r =0.68 vs. r=0.71, data not shown). Since we know that the CRU temperatures are too low for some sites (e.g. Fig. 3), we performed an ad-ditional test where we setεwcto 31 ‰ to mimic the effect of low growth temperatures
on biochemical fractionation. This test should improve results for cool sites, which was indeed what we observed. For the sites INA, GUT, ILO, CAV the model-observation
10
differences decreased (results not shown), while for sites with high mean annual tem-peratures (e.g. REN, LIL) LPX-Bern overestimated stem cellulose δ18O or left them unchanged.
4 Discussion and conclusions
Formulations to describe δ18O in leaf water and stem cellulose are implemented in
15
the LPX-Bern DGVM and a compilation of tree ring data of δ18O in stem cellulose, mainly for Europe, is established. This allows us to model the large scale distribution of leaf water and stem celluloseδ18O on the global scale, to study spatio-temporal vari-ability inδ18O, to evaluate model formulations describing the transfer ofδ18O signals within plants, and, last but not least, to investigate underlying drivers and processes.
20
Further, the model permits us to address how inter-annual, decadal and 20th century changes in climate and environmental variables may have affectedδ18O in stem cellu-lose, thereby contributing to the interpretation of tree ringδ18O data.
The comparison of 50 year averaged model results with tree ring data, mainly across Europe, shows that the large scale climatological-mean pattern in stem celluloseδ18O
25
inter-BGD
12, 18463–18512, 2015
Simulating oxygen isotope ratios in tree
ring cellulose
S. G. Keel et al.
Title Page
Abstract Introduction
Conclusions References
Tables Figures
◭ ◮
◭ ◮
Back Close
Full Screen / Esc
Printer-friendly Version Interactive Discussion
Discussion
P
a
per
|
Discussion
P
a
per
|
Discussion
P
a
per
|
Discussion
P
a
per
|
annual variability in stem celluloseδ18O is also well represented by LPX-Bern (Figs. 4 and 8). Thus, the formulations describing water uptake by plants and transpiration, reg-ulated by stomatal conductance and influenced by ambient CO2 concentrations, and corresponding isotope fractionations appear consistent with tree ringδ18O data. In an earlier study (Saurer et al., 2014) it is shown that LPX-Bern is also able to represent the
5
spatial gradients inδ13C and the temporal change inδ13C and intrinsic water use effi -ciency over the 20th century as reconstructed from a European-wide tree ring network. The good agreement with tree ring data suggests that LPX-Bern is suited to explore theδ18O signal transfer within forest ecosystems and to study the relationship between
δ18O in stem cellulose and meteorological drivers in a mechanistic way, at least within
10
European boreal and temperate forests. This aspect may become particularly relevant in the context of global warming, with more extreme conditions including heat waves and droughts expected, and the model could be used in future work in connection with tree ring data of growth, δ13C, and δ18O to study the nexus between flows of water, governing evaporative cooling and runoff, and C as well as C sequestration.
15
Inter-annual variability and decadal scale trends of modeled tree-ring δ18O in Switzerland are predominantly driven by the meteorological variables relative humidity and temperature and the variability in soil water and water vaporδ18O (Fig. 9, Table 2). In contrast, N deposition or increasing CO2leading to CO2fertilization within LPX-Bern do not influence trends and variability in stem celluloseδ18O at the investigated sites.
20
This is a novel finding that is important for tree-ring-δ18O interpretation, and contrasts with respective findings forδ13C, where CO2is an important factor (Saurer et al., 2014). A strong influence of relative humidity and soil water on stem celluloseδ18O is consis-tent with expectations from isotope theory (McCarroll and Loader, 2004). This is also in agreement with many tree-ring studies that found a significant effect of relative
hu-25
midity (Burk and Stuiver, 1981), vapor pressure differences (Kahmen et al., 2011) and
clima-BGD
12, 18463–18512, 2015
Simulating oxygen isotope ratios in tree
ring cellulose
S. G. Keel et al.
Title Page
Abstract Introduction
Conclusions References
Tables Figures
◭ ◮
◭ ◮
Back Close
Full Screen / Esc
Printer-friendly Version Interactive Discussion
Discussion
P
a
per
|
Discussion
P
a
per
|
Discussion
P
a
per
|
Discussion
P
a
per
|
tological mean values. Nevertheless, time series of precipitation are correlated with modeled time series of δ18O in stem cellulose in agreement with observations (e.g. Reynolds-Henne et al., 2007; Rinne et al., 2013; Hartl-Meier et al., 2015), albeit less than correlations for soil and water vaporδ18O, air temperature and humidity (Fig. 8). This correlation likely arises from the impact of precipitation on other variables, e.g.
5
relative humidity, and from the correlation of precipitation with other driving variables. There is clearly decadal variability in simulated stem celluloseδ18O linked to variability inδ18O and climate input data. The identification of potential century-scale trends is hampered by the lack of suitable input data for relative humidity andδ18O in this study. There are several sources of uncertainty that may explain the remaining deviations
10
between simulated and measured stem cellulose δ18O for the Swiss and European sites. First, we run the model at a coarse spatial resolution (about 220 km×320 km in
Southern Europe) and local site conditions are expected to be different from grid cell average conditions. Climate input data and prescribed δ18O in soil water and water vapor therefore only approximate local values at the site. Sensitivity simulations
(Ta-15
ble 2) and a comparison of soil waterδ18O with theδ18O from the GNIP precipitation network reveal that uncertainties in the input data can indeed well explain deviations between modeled and measuredδ18O in stem cellulose. Uncertainties in relative hu-midity appear particularly relevant and are likely at the origin of relatively large data-model discrepancies at humid sites. Only modest changes in humidity, and thus water
20
pressure deficit, do result in significant changes in stem cellulose δ18O. Daily varia-tions and within canopy variavaria-tions in humidity (and other variables) are not taken into account in our approach. Second, we assume that parameters such as the fractiona-tion between water and cellulose, εwc, the path length,L, for the Péclet effect or the
proportion of carbonyl oxygen exchange with source water,pex, are constant, although 25
they may vary (e.g. Wang et al., 1998; Ripullone et al., 2008; Sternberg and Ellsworth, 2011; Song et al., 2014). The biochemical fraction factorεwcis commonly assumed to
be 27 ‰. Only recently Sternberg and Ellsworth (2011) suggested thatεwcincreases
BGD
12, 18463–18512, 2015
Simulating oxygen isotope ratios in tree
ring cellulose
S. G. Keel et al.
Title Page
Abstract Introduction
Conclusions References
Tables Figures
◭ ◮
◭ ◮
Back Close
Full Screen / Esc
Printer-friendly Version Interactive Discussion
Discussion
P
a
per
|
Discussion
P
a
per
|
Discussion
P
a
per
|
Discussion
P
a
per
|
performed in a rather artificial system as they studied wheat seedlings cultivated in the dark and their findings are controversially discussed (Sternberg, 2014; Zech et al., 2014). Application of a temperature dependent εwc in LPX-Bern in combination with
meteorological data from a nearby weather station removed the model-measurement offset for the alpine site DVN and improved the model-measurement correlation
com-5
pared to the standard setup. So far our results seem the first to indicate that a tem-perature dependent εwc might perhaps also be relevant under field conditions. Yet, uncertainties in other input data and model structure are too large to draw any firm conclusions. The path length (L) of 0.03 m for the Péclet number agrees with previous studies (Wang et al., 1998; Gessler et al., 2013), although large variability has been
10
reported. Also the proportion of carbonyl oxygen exchange with source water (pex) of
0.4 seems reasonable compared with published values (Cernusak et al., 2005; Gessler et al., 2009, 2013; Song et al., 2014). However, relatively small changes inpex have
a significant impact on δ18O in stem cellulose (Table 2) and recent studies suggest this value could range between 0.2 and 0.42 (Gessler et al., 2009; Song et al., 2014).
15
Third, photoassimilates are allocated to growing tissues instantaneously and are not stored e.g. as starch. The simulated tree ringδ18O is therefore exclusively affected by the current year’s meteorology, and not by that of a previous year.
The fact that soil water δ18O has a strong effect on stem cellulose δ18O calls for a very careful evaluation of the source water input data. Unfortunately oxygen
iso-20
tope ratios of soil water are not systematically measured as is the case for pre-cipitation (Global Network for Isotopes in Prepre-cipitation, The GNIP Database, http: //www.iaea.org/water). However, the comparison of the soil waterδ18O data from the ECHAM5-JSBACH model as used as input to LPX-Bern with the GNIP data reveal a good agreement and deviations inδ18O between ECHAM5-JSBACH soil and GNIP
25
precipitationδ18O data are generally less than two per mill.
BGD
12, 18463–18512, 2015
Simulating oxygen isotope ratios in tree
ring cellulose
S. G. Keel et al.
Title Page
Abstract Introduction
Conclusions References
Tables Figures
◭ ◮
◭ ◮
Back Close
Full Screen / Esc
Printer-friendly Version Interactive Discussion
Discussion
P
a
per
|
Discussion
P
a
per
|
Discussion
P
a
per
|
Discussion
P
a
per
|
higher compared to simulations by West et al. (2008) (Fig. 2). First, theδ18O input data and relative humidity forcings were not the same. West and colleagues used annually-averaged δ18O from the GNIP precipitation network, which obviously provides lower values than when summer δ18O would have been used. The mechanistic approach implemented in LPX-Bern considers seasonally varying δ18O of both, source water
5
and atmospheric water vapor, and models explicitly daily stomatal conductance, tran-spiration, and associatedδ18O transport. Second, West et al. (2008) assumed that leaf temperature is 5◦C higher than air temperature. Observations support this for
broad-leaved, but less so for needle leaved species (Leuzinger and Körner, 2007). Because sites with conifers dominate our observational data set, it is reasonable to assume that
10
leaf temperature equals air temperature in our study. Nevertheless we tested the ef-fect of a five degree higher foliage temperature. Averaged over the years 1960–2012 leaf water δ18O changed by less than 0.5 ‰ for a specific site (Fig. 10) and across all plant functional types (data not shown) and can thus not explain the difference be-tween the two approaches. The LPX-Bern simulated mean value of leaf waterδ18O for
15
one grid cell is within the range of the mean values measured at two sites in this grid cell (Table 1). However, more field data would be needed for a meaningful evaluation of simulated leaf waterδ18O. The good agreement between measured and modeled stem celluloseδ18O in Europe appears to implicitly support the LPX-Bern estimates in leaf waterδ18O for this region.
20
We implemented routines to simulate leaf water and stem celluloseδ18O in the LPX-Bern DGVM and successfully modeled the spatio-temporal variability inδ18O as re-vealed by European tree ring data. As tree-ring isotope networks are becoming more wide-spread, the18O-enabled LPX-Bern model provides an ideal tool to explore large-scale spatial and temporal patterns in celluloseδ18O and to help unravel underlying
25
processes and drivers.
BGD
12, 18463–18512, 2015
Simulating oxygen isotope ratios in tree
ring cellulose
S. G. Keel et al.
Title Page
Abstract Introduction
Conclusions References
Tables Figures
◭ ◮
◭ ◮
Back Close
Full Screen / Esc
Printer-friendly Version Interactive Discussion
Discussion
P
a
per
|
Discussion
P
a
per
|
Discussion
P
a
per
|
Discussion
P
a
per
|
Acknowledgements. We thank Martin Werner for providing the soil water and humidity δ18O data from the ECHAM5-JSBACH model, Rosi Weigt for gathering the stem celluloseδ18O data across Europe, and Kerstin Treydte for sharing data from two of the Lötschen Valley sites. Jason West is acknowledged for providing the leaf waterδ18O data and Ansgar Kahmen for sharing his offline model. We thank Rolf Siegwolf for his valuable input and Raphael Roth for
sup-5
port during model development. Measurements from weather stations are from MeteoSwiss. This study is supported by the Swiss National Science Foundation (SNF) through the Sinergia Project iTREE (CRSII3_136295) and the grant to the Division of Climate and Environmental Physics (200020-14174).
References
10
An, W., Liu, X., Leavitt, S. W., Xu, G., Zeng, X., Wang, W., Qin, D., and Ren, J.: Relative humidity history on the Batang-Litang Plateau of western China since 1755 reconstructed from tree-ringδ18O- andδD, Clim. Dynam., 42, 2639–2654, 2014.
Anderson, W. T., Bernasconi, S. M., McKenzie, J. A., and Saurer, M.: Oxygen and carbon isotopic record of climatic variability in tree ring cellulose (Picea abies): an example from
15
central Switzerland (1913–1995), J. Geophys. Res.-Atmos., 103, 31625–31636, 1998. Barbour, M. M.: Stable oxygen isotope composition of plant tissue: a review, Funct. Plant Biol.,
34, 83–94 doi:10.1071/FP06228, 2007.
Barbour, M. M. and Farquhar, G. D.: Relative humidity- and ABA-induced variation in carbon and oxygen isotope ratios of cotton leaves, Plant Cell Environ., 23, 473–485, 2000.
20
Barbour, M. M., Roden, J. S., Farquhar, G. D., and Ehleringer, J. R.: Expressing leaf water and cellulose oxygen isotope ratios as enrichment above source water reveals evidence of a Péclet effect, Oecologia, 138, 426–435, 2004.
Begert, M., Schlegel, T., and Kirchhofer, W.: Homogeneous temperature and precipitation se-ries of Switzerland from 1864 to 2000, Int. J. Climatol., 25, 65–80, doi:10.1002/joc.1118,
25
2005.
Bottinga, Y. and Craig, H.: Oxygen isotope fractionation between CO2and water and isotopic composition of marine atmospheric CO2, Earth Planet. Sc. Lett., 5, 285–295, 1969.
Bowen, G. J. and Revenaugh, J.: Interpolating the isotopic composition of modern meteoric precipitation, Water Resour. Res., 39, 1299, doi:10.1029/2003WR002086, 2003.