Modulated by Intraspecific Variation in Dominant
Species
Danny J. Gustafson1*, Charles Major1, Dewitt Jones1, John Synovec1, Sara G. Baer2, David J. Gibson2
1Department of Biology, The Citadel, Charleston, South Carolina, United States of America,2Department of Plant Biology and Center for Ecology, Southern Illinois University Carbondale, Carbondale, Illinois, United States of America
Abstract
Genetic variation in a single species can have predictable and heritable effects on associated communities and ecosystem processes, however little is known about how genetic variation of a dominant species affects plant community assembly. We characterized the genetic structure of a dominant grass (Sorghastrum nutans) and two subordinate species (Chamaecrista fasciculata,Silphium integrifolium), during the third growing season in grassland communities established with genetically distinct (cultivated varieties or local ecotypes) seed sources of the dominant grasses. There were genetic differences between subordinate species growing in the cultivar versus local ecotype communities, indicating that intraspecific genetic variation in the dominant grasses affected the genetic composition of subordinate species during community assembly. A positive association between genetic diversity ofS. nutans,C. fasciculata, andS. integrifoliumand species diversity established the role of an intraspecific biotic filter during community assembly. Our results show that intraspecific variation in dominant species can significantly modulate the genetic composition of subordinate species.
Citation:Gustafson DJ, Major C, Jones D, Synovec J, Baer SG, et al. (2014) Genetic Sorting of Subordinate Species in Grassland Modulated by Intraspecific Variation in Dominant Species. PLoS ONE 9(3): e91511. doi:10.1371/journal.pone.0091511
Editor:Justin O. Borevitz, The Australian National University, Australia
ReceivedNovember 21, 2013;AcceptedFebruary 10, 2014;PublishedMarch 17, 2014
Copyright:ß2014 Gustafson et al. This is an open-access article distributed under the terms of the Creative Commons Attribution License, which permits unrestricted use, distribution, and reproduction in any medium, provided the original author and source are credited.
Funding:This research has been made possible by funding from National Science Foundation (NSF (DEB 0516429), www.nsf.gov) to S. G. Baer and D. J. Gibson, National Science Foundation supplemental Research Opportunity Award (NSF ROA through DEB 0516429, http://www.nsf.gov/bio/deb/suppopp.jsp) to D. J. Gustafson and The Citadel Foundation (TCF, http://foundation.citadel.edu/) to D. J. Gustafson. The funders had no role in study design, data collection and analysis, decision to publish, or preparation of the manuscript.
Competing Interests:The authors have declared that no competing interests exist.
* E-mail: [email protected]
Introduction
Ecological change can direct evolutionary change on contem-porary scales though ecological-evolutionary feedbacks, which may arise at different levels of biological organization, from genes to ecosystems. Individual genotype by environmental interactions direct phenotypic variation at the population level, whereas natural selection drives population dynamics as well as community interactions and ecosystem functions [1–6]. A new frontier in studying ecological-evolutionary (eco-evol) dynamics is determin-ing the relative contribution of intraspecific genetic variation and genetic differentiation of a focal species on population, commu-nity, and ecosystem processes [7]. Although genetic variation in single species has been shown to have predictable and heritable effects on associated communities and ecosystems [2], [6], [8–12], this pattern is not universal [13].
Genetic variation within a species can be influenced by local biotic and abiotic conditions, resulting in a genetically distinct population (local ecotype) adapted to specific environmental conditions [14–16]. Many studies have documented local adap-tation, identifying ecological and evolutionary factors that contribute to population genetic divergence [17–21]. Local ecotypes tend to outperform non-local ecotypes in their site of origin approximately 70% of the time, although evidence of divergent selection driving local adaptation (sensu Kawecki and Ebert [19]) was observed is less than half of the pair-wise
comparisons [20], [21]. This intraspecific genetic variation can have ecological consequences on population dynamics, commu-nity structure, and ecosystem processes [2], [11], [12], [22–29]. Despite these advances in our understanding of community genetic dynamics, how intraspecific genetic variation in dominant species affects genetic structure of other species during plant community development has received less attention.
research using the same seed sources, we expected genetic differences in the subordinate species to arise between plots sown with cultivar or local ecotype sources of the dominant grass species if intraspecific variation in these dominant species leads to genetic sorting of subordinate species during community assembly. Difference in the genetic structure (similarity or diversity) within subordinate species growing in the presence of the cultivar or local ecotype grasses treatments could represent an indirect interspecific genetic effect of dominant species genetic structure on community neighbors.
Materials and Methods
Field design and sampling
The field experiment contained 12 whole plots assigned to either cultivar or local ecotype source of dominant grasses (n = 6 per treatment) and three subplots seeded with different pools of subordinate species within each whole plot, resulting in six replicates of three different prairie communities (Fig. 1). We used ‘Rountree’ (Andropogon gerardii Vitman), ‘Aldous’ (Schizachyrium scoparium (Michx.) Nash), and ‘Rumsey’ (Sorghastrum nutans (L.) Nash) cultivars of each species per USDA recommendations for this region, based on land resource regions and plant hardiness zones [41]. Breeding methods of these cultivars were cross-pollination, increased field selection, and composite progeny of these accessions made after several generations of selection for seedling vigor, forage production, rust and lodging resistance [41]. The local ecotype seed forA. gerardii, S. scoparium, andS. nutans were hand collected from four remnant prairies within 75 km from the experimental field site [42]. Seeds of subordinate species were purchased from the most local native seed supplier (Hamilton Seed Co., Hamilton, MO, USA) [42]. The origins of the seeded subordinate species were not known; however, none were cultivated varieties and any potential variation within each subordinate species was assumed to be equally distributed among replicated subplots [42]. The dominant grasses were seeded at a rate of 300 live seeds m22. The 15 other native species representing three unique species pools (A, B, and C) were each sown at a rate of 20 seeds m22. Each species pool contained the same number of species representing four functional groups (C4
grasses, C3 grasses, legumes, and forbs) (Table S1). Six meter
buffer areas between the whole plots were sown with two native prairie grasses, Elymus canadensis L. and Bouteloua curtipendula (Michx.) Torr. The focal annual and perennial species in this study, Chamaecrista fasciculata (Michx.) Greene (Fabaceae) and Silphium integrifolium Michx. (Asteraceae), were sown into species pools A and B, respectively.
The experiment was initiated in March 2006 at the Southern Illinois University Agronomy Research Center (37u419N, 89u149W). The formerly cultivated soil was classified as a fine-silty, mixed, superactive, mesic, Fragiaquic Hapludalf, with topsoil (0–0.25 m) comprised of silt loam and subsoil (0.25–1.30 m) of silt clay loam [25]. We sampled an increasingly dominant grass [42] and two subordinate species in the summer of 2008, corresponding to the third year of community assembly. Two to three newly expanded leaves were collected, of a single tiller or stem of a rooted plant, from up to 25 individuals for each of the three species from within each replicate dominant grass treatment, placed on ice, and stored at 220uC until genomic DNA was extracted. A total of 141Sorghastrum nutansplants were sampled across all three species pools, whereasC. fasciculataandS. integrifoliumwere sampled from the species pools A and B, respectfully into which they had been sown. Chamaecrista fasciculata and S. integrifolium did not establish in each plot in which they were sown, hence a total of 203
C. fasciculataplants were sampled from 10 plots and a total of 135 S. integrifolium plants from 9 plots. Establishment of field plots, access, and field sampling efforts followed Southern Illinois University Agronomy Research Center policies and did not affect endangered or protected species.
To characterize the developing plant communities, we estimat-ed percent cover of each species in 1 m22 quadrats centrally located within each subplot in June and August of 2008. Only plots for which we had genetic data were included in the vegetation sampling. Because some early blooming species senesce by August, we used the common practice of calculating community metrics of Shannon’s diversity (H9) and Simpson’s diversity (D) using the maximum cover of each species from the late spring and summer surveys [43], as was used in the analyses of plant community dynamics in this experiment [44].
Molecular Methods
Plant genomic DNA was extracted from approximately 0.5 g leaf material using a E.Z.N.A. plant DNA miniprep kit (Omega Bio-Tek, Norcross, Georgia, U.S.A.). Twenty five Inter-Simple Sequence Repeat (ISSR) primers were surveyed, with four polymorphic primers selected for each species (sequence, number of bands; Chamaecrista fasciculata, (CT)8RG, 5 bands; (CT)8T, 6
bands; (CA)6RY, 7 bands; (AC)8YA, 6 bands;Silphium integrifolium,
Figure 1. Field experimental design with three species pools (A,B,C) planted with local ecotype or cultivar grasses.The two subordinate species were sampled from their respective species pools (Chamaecrista fasciculata-A, Silphium integrifolium-B); the ‘Rumsey’
Sorghastrum nutanscultivar and local ecotype individuals were sampled across all three replicated species pools.
(CA)8RT, 6 bands; (CA)8G, 5 bands; (AG)8YT, 6 bands; (AC)8YT,
5 bands; Sorghastrum nutans, (AG)8T, 10 bands; (GA)8C, 8 bands;
(CT)8RC, 8 bands; (CA)8RC, 8 bands). ISSR polymerase chain
reaction (PCR) protocol followed that of Wolfeet al.[45]; 94uC for 1 min 30 sec, 40 cycles of 94uC for 40 sec, 43uC for 45 sec, and 72uC for 1 min 30 sec, followed by a final extension at 72uC for 5 min. PCR profiles were visualized in 1.5% agarose gels and stained with ethidium bromide. Images were captured using a digital camera (Olympus C-4000 Zoom, Melville, NY), converted to a negative image, and fragment size was estimated based on a DNA marker (Benchtop pGEM, #G7521, Promega, Madison, WI). Fragment sizes were used to assign loci for each primer and bands were scored as diallelic for each locus (1 = band present, 0 = band absent). All S. integrifolium, C. fasciculata, and S. nutans individuals sampled in this study had unique ISSR DNA fingerprint profiles based on the four polymorphic primers and 22–34 loci profiles, respectively.
Data Analysis
Percent polymorphic (PPISSR) bands and Shannon’s diversity (H9ISSR) were used to characterize the genetic diversity for all three species. We used multi-response permutation procedure (MRPP) to test the hypothesis that the genetic structure of the plants growing with cultivar grasses was different from the genetic structure of the same species growing with local ecotype grasses. A non-significant result indicates no difference in the genetic structure. Principal Coordinates Analysis (PCO) was used to investigate plot level genetic relationships ofC. fasciculata and S. integrifolium using ISSR frequency data and relative Euclidean distance (PC-Ord, ver. 4.2, MjM Software Design, Gleneden Beach, Oregon, U.S.A.). Spearman correlations were used to test for associations between genetic diversity of all three species and tallgrass prairie community diversity, for the plots in which we have both genetic and community data, using SAS (SAS Enterprise Guide 4.3, SAS Institute Inc., Cary, NC).
Results
Sorghastrum nutans became the most abundant grass during
assembly, with an average of 26.8 (64.0) percentage cover compared to A. gerardii 7.2 (61.2) and S. scoparium 6.6 (61.5) during the third year of community assembly. Variation in genetic structure of the dominant grass was first reported in Baer et al. [42] to establish the efficacy of the seed source treatment. There was a significant difference inS. nutansgenetic structure between the ‘Rumsey’ cultivar (T =21.86, A = 0.004,P,0.05) and local ecotype source, which was expected given the different population sources. There were significant differences in genetic structure of the annual legumeC. fasciculata(T =25.51, A = 0.008,P,0.001) and perennial forbS. integrifolium(T =22.53, A = 0.007,P,0.05) growing in the developing communities sown with the cultivar and local ecotype sources of the dominant grasses. Genetic relation-ships among plots based on ISSR frequency data also showed a general pattern of genetic differences between subordinate species growing in a matrix of cultivar dominant grasses relative to local ecotype sources (Fig. 2). Both C. fasciculata and S. integrifolium showed plot level separation according to dominant grass species source (cultivar or local ecotypes) with 70% and 82.9% of the variance explained in the first three PCO axes, respectfully.
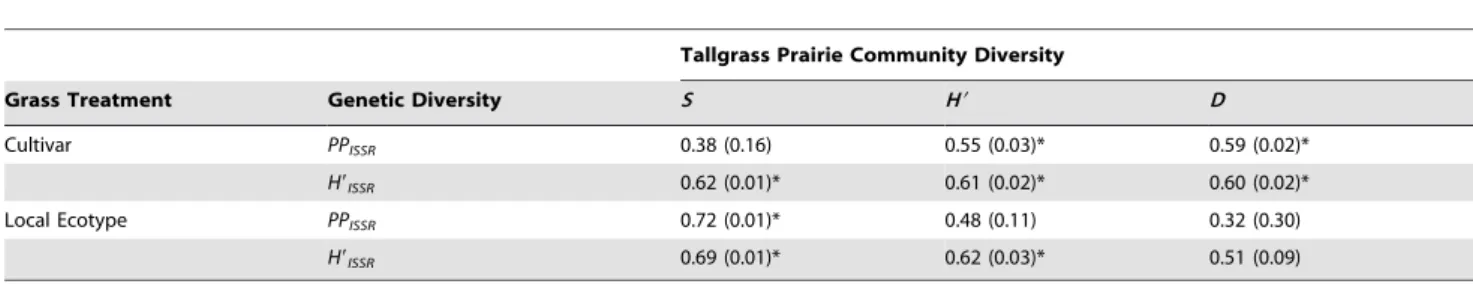
There were significant positive associations between ISSR genetic diversity ofS. nutans, C. fasciculata, andS. integrifoliumand plant community diversity (Fig. 3). In communities sown with cultivars of the grasses, percent polymorphic (PPISSR) bands and Shannon’s Diversity (H9ISSR) were positively correlated with
tallgrass prairie community Shannon’s Diversity (H9) and Simpson’s Diversity (D9), however tallgrass prairie community species richness (S) was only positively correlated with Shannon’s Diversity (H9ISSR) (Table 1). Tallgrass prairie community species richness (S) was positively correlated withPPISSRandH9ISSR, and Shannon’s Diversity (H9) was positively correlated withH9ISSRin the local ecotype grass communities.
Discussion
We tested a genetic assembly rule for dependent communities (sensuBangert and Whitham), where intraspecific variation in the dominant warm season grasses differentially affected the genetic structure of two subordinate species in replicated assembling grassland communities established from seed [46]. Genetic, physiological, and competitive differences between warm-season perennial grasses developed as forage corps (cultivars) versus their non-selected local ecotype populations have been previously Figure 2. Principal coordinate analysis ofChamaecrista fascicu-lataandSilphium integrifoliumbased on ISSR band frequency data.Genetic relationships ofChamaecrista fasciculata(A) andSilphium integrifolium(B) growing in plots sown with cultivar (filled) and local ecotype (open) dominant grasses.
documented [25], [34], [37], [38], [47], [48]. The results of this study are novel in that they demonstrate genetic differences in two subordinate forbs of contrasting life history (i.e., the annual C. fasciculata and the perennial S. integrifolium) when grown with dominant perennial grasses from two different seed sources. For a grassland community dominated by C4 grasses, the S. nutans
genotypes may provide a spatially varying biotic selection pressure through interspecific competitive interactions during community development. The genetic diversity of subordinate species can be filtered through competitive exclusion of subordinate species genotypes by dominant species during community assembly, which could explain the differences in the genetic structure we observed ofC. fasciculataandS. integrifoliumduring the third year of community establishment. The species, and by extension their genotypes, that become established during the early stages of community assembly are the genetic individuals who will be available for driving subsequent population and community genetic dynamics. This biotic filtering of subordinate species genotypes by the dominant species genotypes is similar to the indirect abiotic filtering that can occur due to soil resource change or heterogeneity in grasslands [49].
There was a positive association between genetic diversity and community diversity, which may reflect local site characteristics positively influencing population genetic diversity and community diversity or possibly the direct effects of one level of diversity on another level of diversity during community assembly [50]. The notion that genotypic diversity of a dominant species provides a source of diversifying selection within the plant community is consistent with other grassland studies [51], [52]. Gibsonet al.[44] and Baeret al. [42] demonstrated no strong effect of dominant grass source on community diversity and ecosystem processes for the first four years of community establishment from this field experiment. Similar diversity and functioning of communities sown with the different grass sources was attributed to the high productivity of subordinate species (i.e., a dilution effect), close proximity of the germplasm of theS. nutanscultivar to the local ecotype, and strong filtering of environment or site effects [42], [44]. Both studies acknowledge that there could be other (unmeasured) ecological consequences of using cultivars or long-term effects on community structure and ecosystem functioning, which could be exacerbated by variation in genetic structure and traits [6] of neighboring subordinate species. The differences in
subordinate species genetic structure resulting from the two different dominant species sources may represent a future ‘‘hidden’’ effect of population source in community assembly.
This study captured the genetic patterns of one dominant and two subordinate species in replicated developing tallgrass prairie communities. If S. nutans and other sown dominant grasses continue to increase in cover and ANPP over time, their influence on community dynamics and biotic filtering could reduce genetic diversity through loss of individual genotypes [53]. If interspecific competitive outcomes are influenced by dominant species geno-type by subordinate species interactions or specific genogeno-type by genotype interactions, then biotic filtering could maintain or even promote genotypic and species diversity [50]. Using long-term experimental grassland plots, Whitlocket al.[23], [54] showed that individual genotypes achieved consistent abundance levels in genetically diverse communities. These genotypes exhibited substantial phenotypic variation driving genotype by environment interactions influencing competitive interactions. In the early stages of tallgrass prairie community assembly it is unclear whether genotype by genotypic interactions will promote community diversity through niche complementarity [24] or if genotypic specific dominance hierarchies will reduce community diversity through biotic filtering.
Quantifying the importance of intraspecific genetic variation relative to ecological factors is an ongoing challenge in community and ecosystem genetics [2], [6], [9], [27], [55], however it is also important to know how selection drives genetic divergence in communities across the landscape. In contrast to our community genetic findings, biotic filtering during early community assembly has had only limited effects on the community as a whole [52] and multiple aspects of ecosystem functioning [42]. This supports, in part, the role of intraspecific biotic filtering that we proposed [53], but not at all ecological scales. Ecological sorting may continue to drive genetic divergence of subordinate species between the communities established with grass cultivars and local ecotypes, respectively, or ecological factors may lead to community genetic convergence of subordinate genetic structure as these grassland communities continue to assemble (sensuVellend and Geber [50]). Regardless, this study clearly demonstrates that genetic divergence can occur rapidly during community assembly and molecular markers can be used to quantify these population, community, and ecosystem genetic dynamics.
Figure 3. Genetic diversity by tallgrass prairie community structure associations.Scatter plots representing genetic diversity (H9ISSR) by tallgrass prairie community structure (H9, S, D) growing in plots sown with cultivar (filled) and local ecotypes (open) of the dominant grasses. doi:10.1371/journal.pone.0091511.g003
Table 1.Spearman’s Correlation Coefficient (P-value) between genetic diversity (PPISSR,H9ISSR) and tallgrass prairie community diversity (S, H9,D) within cultivar and local ecotype dominant grass treatment.
Tallgrass Prairie Community Diversity
Grass Treatment Genetic Diversity S H9 D
Cultivar PPISSR 0.38 (0.16) 0.55 (0.03)* 0.59 (0.02)*
H9ISSR 0.62 (0.01)* 0.61 (0.02)* 0.60 (0.02)*
Local Ecotype PPISSR 0.72 (0.01)* 0.48 (0.11) 0.32 (0.30)
H9ISSR 0.69 (0.01)* 0.62 (0.03)* 0.51 (0.09)
*P,0.05.
Supporting Information
Table S1 Tallgrass Prairie Community Species Pools (A, B, C).
(DOCX)
Acknowledgments
We acknowledge the thoughtful comments and suggestions by Drs. Matt Bahm and Scott Franklin that improved this manuscript. We thank Lewis Reed for collecting percentage cover data and Southern Illinois University
Carbondale Agronomy Research Center for field site preparation and maintenance. Data for this study are available at Dryad Digital Repository [56].
Author Contributions
Conceived and designed the experiments: DJ. Gustafson DJ. Gibson SGB. Performed the experiments: CM DJ JS DJ. Gustafson. Analyzed the data: DJ. Gustafson. Contributed reagents/materials/analysis tools: DJ. Gus-tafson. Wrote the paper: DJ. Gustafson CM DJ JS SGB DJ. Gibson.
References
1. Thompson JM (1998) Rapid evolution as an ecological process. Trends Ecol Evol 13: 329–332.
2. Johnson MTJ, Vellend M, Stinchcombe JR (2009) Evolution in plant populations as a driver of ecological changes in arthropod communities. Proc Roy Soc B-Biol Sci 364: 1593–1605.
3. Coulson T, Benton TG, Ludberg P, Dall SRX, Kendall BE (2006) Putting evolutionary biology back in the ecological theatre: a demographic framework mapping genes to communities. Evol Ecol Res 8: 1155–1171.
4. Coulson T, Benton TG, Ludberg P, Dall SRX, Kendall BE, et al. (2006) Estimating individual contributions to population growth: evolutionary fitness in ecological time. Proc Roy Soc B-Biol Sci 273: 547–555.
5. Pelletier F, Clutton-Brock T, Pemberton J, Tuliapurkar S, Coulson T (2007) The evolutionary demography of ecological change: linking trait variation and population growth. Science 315: 157–1574.
6. Genung MA, Bailey JK, Schweitzer JA (2012) Welcome to the neighborhood: interspecific genotype by genotype interactions inSolidagoinfluence above- and belowground biomass and associated communities. Ecol Lett 15: 65–73. 7. Genung MA, Schweitzer JA, Ubeda F, Fitzpatrick BM, Pregitzer CC, et al.
(2011) Genetic variation and community change – selection, evolution, and feedbacks. Funct Ecol 25: 408–419.
8. Whitham TG, Young WP, Martinsen GD, Gehring CA, Schweitzer JA, et al. (2003) Community and ecosystem genetics: a consequence of the extended phenotype. Ecology 84: 559–573.
9. Whitham TG, Bailey JK, Schweitzer JA, Shuster SM, Bangert RK, et al. (2006) A framework for community and ecosystem genetics: from genes to ecosystems. Nat Rev Genet 7: 510–523.
10. Bailey JK, Wooley SC, Lindroth RL, Whitham TG (2006) Importance of species interactions to community inheritability: a genetic basis to trophic-level interactions. Ecol Lett 9: 78–85.
11. Bailey JK, Schweitzer JA, Ubeda F, Koricheva J, LeRoy CJ, et al. (2009) From genes to ecosystems: a synthesis of the effects of plant genetic factors across levels of organization. Proc Roy Soc B-Biol Sci 364: 1607–1616.
12. Bangert RK, Lonsdorf EV, Wimp GM, Shuster SM, Fischer D, et al. (2008) Genetic structure of a foundation species: scaling community phenotypes from the individual to the region. Heredity 100: 121–131.
13. Taberlet P, Zimmermann NE, Englisch T, Tribsch A, Holderegger R, et al. (2012) Genetic diversity in widespread species is not congruent with species richness in alpine plant communities. Ecol Lett 15: 1439–1448.
14. Turesson G (1925) The plant species in relation to habitat and climate. Hereditas 6: 147–236.
15. Clausen J, Keck DD, Hiesey WM (1947) Heredity of geographically and ecologically isolated races. Am Nat 81: 114–133.
16. McMillan C (1959) The role of ecotypic variation in the distribution of the central grassland of North America. Ecol Monogr 29: 285–308.
17. Linhart YB, Grant MC (1996) Evolutionary significance of local genetic differentiation in plants. Annu Rev Ecol Syst 24: 237–277.
18. Hufford KM, Mazer S (2003) Plant ecotypes: genetic differentiation in the age of ecological restoration. Trends Ecol Evol 18: 147–155.
19. Kawecki TJ, Ebert D (2004) Conceptual issues in local adaptation. Ecol Lett 7: 1255–1241.
20. Leimu R, Fischer M (2008) A meta-analysis of local adaptation in plants. PLoS ONE 3: e4010.
21. Hereford J (2009) A quantitative survey of local adaptation and fitness trade-offs. Am Nat 173: 579–588.
22. Seliskar DM, Gallagher JL, Burdick DM, Mutz LA (2002) The regulation of ecosystem functions by ecotypic variation in the dominant plant: aSpartina alterniflorasalt-marsh case study. J Ecol 90: 1–11.
23. Whitlock R, Grime JP, Booth R, Burke T (2007) The role of genotypic diversity in determining grassland community structure under constant environmental conditions. J Ecol 95: 895–907.
24. Cook-Patton SC, McArt ST, Parachnowitsch AL, Thaler JS, Agrawal AA (2011) A direct comparison of the consequences of plant genotypic and species diversity on communities and ecosystem function. Ecology 92: 915–923.
25. Lambert AM, Baer SG, Gibson DJ (2011) Intraspecific variation in ecophysiology of three dominant tallgrass prairie grasses used in restoration: cultivar versus non-cultivar population sources. Restor Ecol 19: 43–52.
26. Crawford KM, Rudgers JA (2012) Plant species diversity and genetic diversity within a dominant species interactively affect plant community biomass. J Ecol 100: 1512–1521.
27. Avolio ML, Beaulieu JM, Smith MD (2013) Genetic diversity of a dominant C4 grass is altered with increased precipitation variability. Oecologia 171: 571–581. 28. Laincourt P, Spence LA, Song DS, Lkhagva A, Sharkhuu A, et al. (2013) Plant response to climate change varies with topography, interactions with neighbors, and ecotype. Ecology 94: 444–453.
29. Schroder R, Presse R (2013) Do cultivated varieties of native plants have the ability to outperform their wild relatives? PLoS ONE 8: e71066.
30. Grime JP (1998) Benefits of plant diversity to ecosystems: immediate, filter and founder effects. J Ecol 86: 902–901.
31. Fehr WR (1987) Principles of cultivar development: theory and technique. New York: Macmillan Publishing Company. 536 p.
32. USDA NRCS (2002) The PLANTS Database (ver 3.5) National Plant Data Center. Available: http://plant.usda.gov. Accessed 2008 Aug 5.
33. Tilman D, Hill J, Lehman C (2006) Carbon-negative biofuels from low-input high-diversity grassland biomass. Science 314: 1598–1600.
34. Huff DR, Quinn JA, Higgins B, Palazzo AJ (1998) Random amplified polymorphic DNA (RAPD) variation among native little bluestem [Schizachyrium scoparium(Michx.) Nash] populations from sites of high and low fertility in forest and grassland biomes. Mol Ecol 7: 1591–1597.
35. Gustafson DJ, Gibson DJ, Nickrent DL (1999) Random amplified polymorphic DNA (RAPD) variation among remnant big bluestem [Andropogon gerardii Vitman] populations from Arkansas’ Grand Prairie. Mol Ecol 8: 1693–1701. 36. Gustafson DJ, Gibson DJ, Nickrent DL (2001) Characterizing three restored
Andropogon gerardiiVitman (big bluestem) populations established with Illinois and Nebraska seed: established plants and their offspring.In: Bernstein NP, Ostrander LJ, editors. Proceedings of the 17th North American Prairie Conference. Mason City: Northern Iowa Area Community College. pp. 118– 124.
37. Gustafson DJ, Gibson DJ, Nickrent DL (2004) Competitive relationships of Andropogon gerardii(big bluestem) from remnant and restored native populations and select cultivated varieties. Funct Ecol 18: 451–457.
38. Gustafson DJ, Gibson DJ, Nickrent DL (2004) Conservation genetics of two co-dominant grass species in the endangered grassland ecosystem. J Appl Ecol 41: 389–397.
39. Rouse MN, Saleh AA, Seck A, Keeler KH, Travers SE, et al. (2011) Genomic and resistance gene homolog diversity of the dominant tallgrass prairie species across the U.S. Great Plains precipitation gradient. PLoS ONE 6: e17641. 40. Price DI, Salon PR, Casler MD (2012) Big bluestem gene pools in the Central
and Northeastern United States. Crop Sci 52: 189–200.
41. United States Department of Agriculture USDA (1995) Grass Varieties in the United States. Boca Raton: CRC Press. 304 p.
42. Baer SG, Gibson DJ, Gustafson DJ, Benscoter AM, Reed LR, et al. (2013) No effect of seed source on multiple aspects of ecosystem functioning during ecological restoration: cultivars compared to local ecotypes of dominant grasses. Evol Appl DOI: 10.1111/eva.12124.
43. Gibson DJ, Hulbert LC (1987) Effects of fire, topography and year-to-year climate variation on species composition in tallgrass prairie. Vegetatio 72: 175– 185.
44. Gibson DJ, Baer SG, Klopf RP, Reed LK, Wodika BR, et al. (2013) Limited effects of dominant species population source on community composition during community assembly. J Veg Sci 24: 429–440.
45. Wolfe AD, Xiang QY, Kephart SR (1998) Diploid hybrid speciation inPenstemon (Schrophulariaceae). Proc Natl Acad Sci U S A 95: 5112–5115.
46. Bangert RK, Whitham TG (2007) Genetic assembly rules and community phenotypes. Evol Ecol 21: 549–560.
47. Klopf RP, Baer SG (2011) Root dynamics of cultivar and non-cultivar population sources of two dominant grasses during initial establishment of tallgrass prairie. Restor Ecol 19: 112–117.
48. Carter DL, Blair JM (2012) Seed source affects establishment and survival for three grassland species sown into reciprocal common gardens. Ecosphere 3: 102. 49. Snaydon RW, Davies TW (1987) Rapid divergence of plant populations in
response to recent changes in soil conditions. Evolution 36: 289–297. 50. Vellend M, Geber MA (2005) Connections between species diversity and genetic
51. Aarssen LW, Turkington R (1985) Biotic specialization between neighbouring genotypes inLolium perenneandTrifolium repensfrom a permanent pasture. J Ecol 73: 605–614.
52. Booth RE, Grime JP (2003) Effects of genetic impoverishment on plant community diversity. J Ecol 91: 721–730.
53. Gibson DJ, Allstadt AJ, Baer SG, Geisler M (2012) Effects of foundation species genotypic diversity on subordinate species richness in an assembling community. Oikos 121: 496–507.
54. Whitlock R, Grime JP, Burke T (2010) Genetic variation in plant morphology contributes to the species-level structure of grassland communities. Ecology 91: 1344–1354.
55. Crutsinger GM, Collins MD, Fordyce JA, Gompert Z, Nice CC, et al. (2006) Plant genotypic diversity predicts community structure and governs an ecosystem process. Science 313: 966–968.