A Short–Time Scale Colloidal System Reveals
Early Bacterial Adhesion Dynamics
Christophe Beloin1, Ali Houry2, Manuel Froment2, Jean-Marc Ghigo1, Nelly Henry2*
1Unite´ de Ge´ne´tique des Biofilms, Institut Pasteur, CNRS URA 2172, Paris, France,2Laboratoire Physico-Chimie Curie, Institut Curie, CNRS UMR 168, Universite´ Paris VI , Paris, France
The development of bacteria on abiotic surfaces has important public health and sanitary consequences. However, despite several decades of study of bacterial adhesion to inert surfaces, the biophysical mechanisms governing this process remain poorly understood, due, in particular, to the lack of methodologies covering the appropriate time scale. Using micrometric colloidal surface particles and flow cytometry analysis, we developed a rapid multiparametric approach to studying early events in adhesion of the bacterium Escherichia coli. This approach simultaneously
describes the kinetics and amplitude of early steps in adhesion, changes in physicochemical surface properties within the first few seconds of adhesion, and the self-association state of attached and free-floating cells. Examination of the role of three well-characterizedE. colisurface adhesion factors upon attachment to colloidal surfaces—curli fimbriae, F-conjugative pilus, and Ag43 adhesin—showed clear-cut differences in the very initial phases of surface colonization for cell-bearing surface structures, all known to promote biofilm development. Our multiparametric analysis revealed a correlation in the adhesion phase with cell-to-cell aggregation properties and demonstrated that this phenomenon amplified surface colonization once initial cell-surface attachment was achieved. Monitoring of real-time physico-chemical particle surface properties showed that surface-active molecules of bacterial origin quickly modified surface properties, providing new insight into the intricate relations connecting abiotic surface physicochemical properties and bacterial adhesion. Hence, the biophysical analytical method described here provides a new and relevant approach to quantitatively and kinetically investigating bacterial adhesion and biofilm development.
Citation: Beloin C, Houry A, Froment M, Ghigo JM, Henry N (2008) A short–time scale colloidal system reveals early bacterial adhesion dynamics. PLoS Biol 6(7): e167. doi:10. 1371/journal.pbio.0060167
Introduction
Bacterial growth on surfaces and interfaces leads to the formation of three-dimensional communities called biofilms [1]. Biofilm-specific tolerance to different biocidal treatments used in health care facilities stimulated the investigation of key molecular events in biofilm formation, and molecular factors promoting bacterial adhesion have been character-ized, including surface-exposed adhesins and polysaccharidic polymers. However, initial cell surface attachment itself is still poorly understood, and many questions remain regarding biophysical aspects of the adhesion process due to lack of appropriate investigation tools [2,3].
Physico-chemical approaches based on the Derjaguin-Landau-Verwey-Overbeek (DLVO) [4] theory, although reli-able in predicting interactions between well-controlled model hard spheres, have often proven inappropriate for modeling bacterial adhesion [5]. This is likely due to the multiplicity of parameters involved in the adhesion process, influenced both by biological and environmental factors. On the other hand, most biological approaches to surface colonization rely on procedures that develop on an hourly or daily scale. Hence, interpretations are often made at the final adsorption stage or at equilibrium, when initial adhesion is blurred by subsequent biofilm development steps, thus preventing precise kinetic analysis of the adhesion process [3]. Alternative short-term approaches are therefore needed to provide quantitative and kinetic information on the early stage of bacterial interaction with a surface.
We introduced a new methodology which takes advantage of advanced flow cytometry (FCM) analyses [6] to characterize initial bacterial cell surface attachment. Only a few studies
monitoring bacterial attachment to mammalian cells using FCM have been published [7,8]. Thus far, stream techniques involved in FCM have appeared incompatible with the study of bacterial adhesion usually studied on macroscopic plane surfaces. We have overcome this apparent antagonism by choosing dispersed surfaces in the form of well-characterized micrometric particles as adhesion substrates in order to explore initial events of surface colonization by the bacte-rium Escherichia coli. We used charged particles as adhesion substrates, representing the most widespread situation for surfaces immerged in aqueous media due either to their inherent ionization state or to the water ion structure at the interfaces. Then, we examined the contribution of three well-characterizedE. coliadhesion factors with a time resolution of a few seconds and the precision of one bacterium per particle. This revealed several phases leading to surface colonization, and evidenced clear-cut differences strongly
Academic Editor:Alain Filloux, Imperial College London, United Kingdom
ReceivedNovember 28, 2007;AcceptedMay 29, 2008;PublishedJuly 8, 2008
Copyright:Ó2008 Beloin et al. This is an open-access article distributed under the terms of the Creative Commons Attribution License, which permits unrestricted use, distribution, and reproduction in any medium, provided the original author and source are credited.
Abbreviations:FCM, flow cytometry; FL1, mean fluorescence intensity in channel 1 (BP530/15nm); FL3, mean fluorescence intensity in channel 3 (LP650nm);fli, bacterial cell unitary fluorescence in FL1; FSC, forward scattering; GFP, green fluorescent protein; PBS, phosphate-buffered saline; PI, propidium iodide; PYR, pyranine; R1, free particles scattering region; R2, free particles fluorescence (channel 1) region; R3, bacteria-associated particles fluorescence (channel 1) region; Rb, bacteria scattering region; Rflag, bacterial aggregates fluorescence
(channel 1) region in bacteria records; Rflb, bacteria region; SSC-H, side scattering
height
dependent on the nature of the adhesin expressed at the cell surface. We also explored the contribution of cell-to-cell aggregation properties and particle surface physicochemical property changes throughout the colonization process. This
particles as adhesion substrates, both positively charged (aminated, NH3þ) and negatively charged (carboxylated,
COO–) with zeta potentials of þ45 mV and 55 mV,
respectively. Suspensions of 10-lm particles were resus-pended in phosphate-buffered saline (PBS) and examined by microscopy and FCM. 80% of the events detected with the two types of particles were concentrated in scattering value region R1 (free particles scattering region), corresponding to a monodispersed population (Figure 1A and unpublished data).
Particle surface charge properties were traced using an anionic dye (pyranine, PYR) and a cationic dye (propidium iodide, PI), the fluorescent labeling of which was detected by microscope imaging (Figure 1B) and FCM (Figure S1). Both probes displayed fast (adsorption half-time , 1 s) and selective electrostatic adsorption onto particles carrying opposite charges. PYR was emitted in the FL1 channel [mean fluorescence intensity in channel 1] (525610 nm) and PI in the FL3 channel [mean fluorescence intensity in channel 3] (.670 nm). Labeling properties were conserved in M63B1
Figure 1.Colloidal Substrates
(A) FCM scattering plot and corresponding bright field microscope images of a COO–particle sample washed in water and suspended in PBS. 80% of events were concentrated in the scattering value region R1 corresponding to a monodispersed, 10-lm-diameter population. Outliers corresponded to a population of slightly larger particles and a few doublets. Cationic (NH3þ) particles displayed the same scattering characteristics as anionic (COO–) particles.
(B) Microscopic images of PYR- (2nd column) and PI- (3rd column) labeled cationic (1st row) and anionic (2nd row) particles. Dye concentration equal to 16.7 nM.
doi:10.1371/journal.pbio.0060167.g001
medium, the rather high ionic strength (’200 mM versus 150 mM,e.g., for PBS) medium used in this study both for growth of the bacteria and the adhesion assay (see below), indicative of strong and irreversible association, which demonstrated that the chosen pairs of dyes were flexible surface-charge reporters in the heterogeneous context of a bacterial suspension.
FCM Monitoring of Isolated and Aggregated Bacteria in Suspension
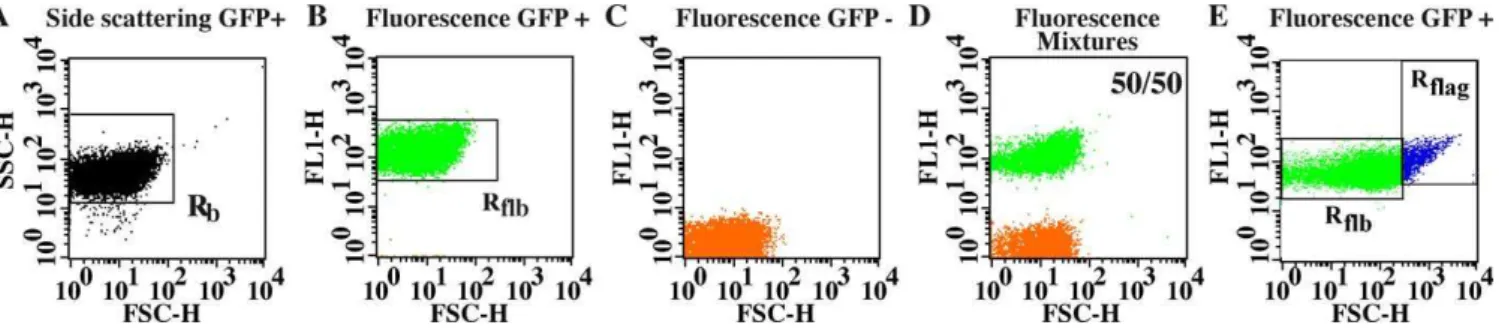
To determine optimal recording conditions for bacterial adhesion in the colloidal system, we analyzed samples composed of planktonic cultures of fluorescent and non-fluorescent E. coli K-12 strains MG1655 and MG1655gfp, respectively, mixed at various proportions. Due to their smaller size, bacteria had to be analyzed with higher scattering photomultiplier gains than colloidal particles and appeared in a distinct acquisition window. We isolated a bacterial signal in scattering region Rb containing at least
98% of the recorded events (Figure 2A). Depending on sample composition, fluorescence plots FL1/forward scatter-ing (FSC) stemmscatter-ing from Rb events displayed one or two
subsets, each with a characteristic mean fluorescence FL1 value conserved in the whole sample series(Figure 2B–2D). The ratio of the number of cells counted in high and low fluorescence subsets accurately matched values expected from the mixtures (Figure S2), indicating that the recorded signals originated from single cells. Indeed, if more than one cell was detected in a single event, then higher number of subsets depending on the number of detected cells would have appeared with intermediate fluorescence intensities. This enabled us to determine a cell unitary fluorescence value flifrom the mean FL1 fluorescence of an Rflbgate (bacteria
region) containing the fluorescent bacteria (Figure 2B). When green fluorescent protein (GFP)-labeled cells were allowed to rest at room temperature for 2 h, we observed the formation of cell aggregates that produced higher scattering and a fluorescence signal defining a new gate, Rflag (bacterial
aggregates fluorescence (channel 1) region in bacteria records) (Figure 2E). The aggregate scattering parameters were sufficiently different from those of colloidal particles to avoid any confusion between the two types of objects even when aggregate sizes increased. Therefore, the Rflagnumber
of events (N(Rflag)), mean fluorescence (FL1(Rflag)), and mean
forward scattering (FSC(Rflag)) enabled us to report the
dispersion state of the cell suspension.
Quantitative and Qualitative Multiparametric Monitoring of Cell Adhesion Events in a Colloidal Suspension
To study bacterial adhesion onto colloidal substrates, GFP-labeledE. coli cells were brought into contact with cationic particles under gentle stirring, producing mild shear stress on the order of a few tens of piconewtons per contact. While this stirring abolished gravity effects, it also screened cell motility. Therefore, although bacterial motility has been shown to play a role in surface colonization under static conditions [9], its effect is here masked by velocity gradients due to stirring-induced hydrodynamic shear. The question of the role of bacterial self-propulsion through flagellar motility is thus not addressed here. The FCM signal was recorded on aliquots taken at different times from the cell-particle sample using a sample flow speed of 1ll/s and an acquisition time equal to 5 s. Direct microscopic observation showed that bacteria adhered to colloidal particles, leading to the emergence of a new cluster of higher fluorescence on particle FL1/FSC cytograms, corresponding to particles carrying at least one bacterial cell (Figure 3A and B). Bare (R2) and colonized particles (R3) were thus easily discriminated on the basis of their fluorescence intensity and described by the two particle subsets stemming from the R1 gate (Figure 3B). As shown in an experiment performed using a 200-fold excess of colloidal particles over bacteria (Figure S3)—which ensured that only rare but single cell adhesion events would statistically appear—bacterial fluorescence was not affected by adhesion to particles. Therefore, the mean number of particle-bound bacteria (nF) could be obtained simply by dividing mean
particle fluorescence (FL1(R1)) by bacterial unitary fluores-cence (fli¼FL1(Rflb)).
Adhesion in the colloidal system could be regarded as the sum of discrete efficient collisions occurring between one particle and one cell, and could then be adequately described by Poisson’s law as follows:
PðkÞ ¼n
ken
k!
whereP(k) was the probability of finding a particle bearingk bacteria when the mean of the distribution wasn. For a given acquisition, the experimental value of n was nF. fc, the
colonized particle fraction, was experimentally given byfc¼
N(R3)/[N(R2)þN(R3)] and was linked toP(0), the probability of finding a particle free of bacteria byfc¼(1– P(0)), which
gavefc¼1en.
Figure 2.Bacterial FCM
Scattering (A) and fluorescence dot plots of all GFP-labeled (B), all non GFP-labeled cells (C) and a mixture (50/50) of both (D). Aliquots of exponentially growing cultures were diluted in PBS to obtain a 53106cells/ml suspension.
For any value offc, we could thus calculate the mean of the
corresponding statistical distribution nP¼–ln (1 – fc). This
provided a direct means of characterizing adhesion distribu-tion and detecting eventual cooperative effects by comparing nP to experimental valuenF calculated from mean
fluores-cence. This also enabled the definition of a cooperative index k, given by the rationF/nP.
To achieve a complete description of the cell particle suspension, 5ll of a 106M PI solution were added to each aliquot taken from the incubation sample. Labeling per-formed just before the FCM analysis and after the cell– particle interaction allowed us to characterize the particle surface charge. It did not, however, affect cell–particle association, as checked by parallel recordings of unlabeled and labeled samples (unpublished data).
The complete analysis enabled us to determine, for each sample test, the free-floating cell aggregation state, the cell particle surface association degree, as well as the particle surface charge state. It also reported the potential coopera-tive character of cell to particle surface binding.
The colloidal system approach therefore enabled full quantification of the early bacterial adhesion process. More-over, the sensitivity of signal recording enabled us to determine adhesion kinetics taking place within the range of few seconds after cell–particle contact.
Curli Expression Alters the Kinetics of Initial Attachment of Bacteria to an Abiotic Surface
Curli are thin aggregative fimbriae assembled at the cell surface of most Enterobacteriaceae, in which they have been shown to promote adhesion to abiotic surfaces [10]. They form 6–12-nm-diameter structures whose length varies between 0.5 and 1lm [11]. To explore the contribution of curli to early steps in bacterial adhesion, we used fluorescentE. colieither overexpressing curli due to a mutation inompR, the positive regulator of curli expression (MG1655gfpompR234) [10], or deprived of curli (MG1655gfpDcsgA). We compared the adhesion profiles of mid-exponential phase growth cultures on aminated particles using a cell-to-particle ratio close to 200. FCM analyses of 10ll aliquots taken from both cultures at;30 s intervals revealed that the presence of curli strongly modified early initial attachment of bacteria to an abiotic surface. The adhesion kinetics of the strain constitutively
expressing curli displayed two distinct binding phases (Figure 4A). After 20 min of adhesion, the extent of particle surface colonization, as reported by the mean number of bound bacteria per particle nF, was more than a hundred times
higher than that of the curli-deficient mutant strain (Figure S4 and Figure 4A and 4B). In contrast, strain MG1655gfpDcsgA exhibited single-phase kinetics characterized by a steady state corresponding to a low level of binding reached within the first seconds after particle contact (Figure 4B).
To quantitatively analyze these cell surface adhesion profiles, we considered the first adhesion phase ranging from 10 s to 10 min after particle/bacteria initial contact. Dynamics of early surface binding,nF(t) was adjusted to the first-order–
like kinetics equationnF(t)¼Nmax(1 –exp(-kat)) for both types
of bacterial cells, withNmaxthe maximum mean colonization
level displayed at plateau andkathe apparent time constant
of the adhesive process. The colonization plateau was obtained in both cases in the presence of a large fraction of free-floating cells.
For MG1655gfpDcsgA,the steady state was characterized by anNmaxvalue equal to 0.2560.3 bacteria per particle (bact
part1), which corresponded to the attachment of one cell for every four particles. This very restricted binding occurred rapidly after cell–particle contact, with an initial colonization rate reported byNmaxkaequal to 1.3 bact part1min1. The
rapid establishing of this low-level steady state (t1/2¼0.13 min)
indicated that cell and particle surfaces were essentially repulsive to each other under the conditions of the experi-ment, contrary to what could have been expected from opposite charge (negative cells and positive particles) surfaces. This point is further investigated below.
The curli producer strain MG1655gfpompR234displayed, in phase I, a ten times higher colonization level than the curli-defective strain (Nmax¼3.260.5 bact part1) and exhibited a
longer characteristic time (t1/2¼2.8 min and an initial binding
rate of 0.8 bact part1 min1) (Figure 4A and 4B). This indicated that, in the presence of curli, cell and particle surfaces did not experience the repulsive potential observed between curli-defective cells and particle surfaces. Never-theless, in this phase I, MG1655gfpompR234cells exhibited a colonization plateau in between three and four attached cells per particle, which represented a rather sparse surface occupation. This could be due to particle surface
hetero-Figure 3.Bacterial Adhesion in Colloidal Suspension
(A) Microscope images of MG1655gfp E. colicells and particles brought into contact with particles in M63B1 medium for 20 min. Bright-field and bright-field fluorescence combined images are shown. Adhesive events can be observed on the combined image; examples are indicated by white arrows. (B) Corresponding fluorescence dot plots are shown for particles alone (left) and cells and particles brought into contact for 20 min (right). Gate R2 corresponds to bare particles, whereas gate R3 corresponds to colonized particles.
geneity—of molecular nature or concentration—resulting in a low density of adhesive sites for bacteria in this first adhesive phase. Fresh particles added at the plateau to the cell–particle suspension displayed the same colonization kinetics as those initially present at t ¼ 0 (Figure 4C), demonstrating that remaining floating bacteria still had the capacity to adhere to freshly added particles. On the other hand, no additional colonization occurred (stable nF) when additional bacteria
were added at the colonization plateau (unpublished data). These results suggest establishment, on the particle surface, of a repulsive potential that limits MG1655gfpDcsgAadhesion but is partially overcome by the presence of curli adhesion to the surface of MG1655gfpompR234.
Contact with the Cell Suspension Induces Rapid Surface Conversion That Modifies Initial Surface Properties and Colonization Rates
To investigate the possible origin of the repulsive potential, we monitored particle surface charge during colonization using the cationic dye PI labeling procedure (see above). As shown above (Figure S1), aminated particles suspended in PBS or M63B1 fresh medium did not adsorb the dye. Their FL3 intensity remained at the level of the background, corresponding to particles in the absence of dye. In contrast, when PI was added to the analysis test tubes taken from the incubation sample in the presence of exponentially grown bacteria, we measured a rapid increase in the PI labeling signal both with curli producer and nonproducer bacteria (Figure 4D). This indicated that the particle surface—initially positively charged—had turned into a negative surface potential, which enabled PI adsorption. This PI labeling affected both cell-free and colonized particles in the suspension (Figure S5A), suggesting that soluble species
present in the bacterial supernatant were responsible for this effect. Consistently, aminated particles resuspended in filter-sterilized culture supernatants were labeled with PI, confirming production by bacterial cultures of anionic molecules. Furthermore, labeling intensity increased when supernatant stemmed from a longer overnight culture (unpublished data). No significant bacterial cell death was observed within the culture before or after incubation, as indicated by the absence of noticeable number of red-labeled bacteria on fluorescence microscopy images.
Indeed, in case of cell death, the dye contained in our samples would cross cell membrane and accumulate inside the cell through DNA association. Thus, only a small, naturally occurring bacterial lysis, which releases bacterial products in the medium, is expected to take place in our experiments, suggesting that this phenomenon could con-tribute only marginally to the surface properties changes observed. When COO–particles were tested, we observed that PI labeling, initially high with such anionic surface function-alization, slightly decreased, suggesting that these surfaces were also modified by cell supernatant, which finally set the exposed surfaces to similar potentials (Figure S5B). Zeta potential measurements were performed on particles first incubated in bacterial culture media coming from cultures of the F plasmid-bearing strain and then suspended at 10% v/v in water for measurements. Value shifted for cationic particles from þ36 mV in unspent medium (þ45 in pure water) to32 mV after 15 min incubation in 12-h culture spent medium. Anionic particles displayed slightly reduced negative charge, shifting from65mV in unspent medium to 42 mV after medium conditioning, completely corroborat-ing the behavior reported by dyes labelcorroborat-ing. Very similar results were obtained with supernatant from MG1655 strain
Figure 4.Effect of Curli Production on Early Surface Adhesion
Adhesion kinetic curves of MG1655gfpompR234(A) and MG1655gfpDcsgA(B). Particles and cells were brought into contact at timet¼0. Cell to particle ratio was around 200 and particle concentration equal to 63106/ml.
(C) Colonized particle fraction kinetics are shown for two sequential additions of fresh NH3þparticles to MG1655gfpompR234cells. 50ll of stock particles were added to a cell/particle sample after 9 min incubation once the first colonization phase leveled off.
(D) Charge inversion of NH3þ particle during surface colonization. FL3 intensity in time due to PI adsorption (2 3 108 M) is shown for MG1655gfpompR234(m) and MG1655gfpDcsgA(
).(unpublished data). This surface charge conversion to a negative potential was thus likely to explain the repulsive potential observed against bacteria.
To further investigate this, MG1655gfpompR234 or MG1655gfpDcsgA bacteria were placed in contact with both positively (NH3þ) and negatively (COO–) charged particles,
simultaneously and in the same sample. PI labeling enabled us to differentiate both types of particles within the sample (Figure S5C). For both strains, COO– particle colonization was only slightly reduced compared to colonization on NH3þparticles, as
if cells sensed very similar surfaces (unpublished data). These results indicate that negative surface charge con-version induced by bacterial supernatants determines the surface potential of the interaction with cells independently of the initial surface state. In the absence of curli, this negative and thus repulsive potential dominates the inter-action. Expression of curli at the cell surface obviously enabled overcoming this repulsion either by superimposing a much stronger binding force or by allowing the interaction to occur at a longer surface separation distance where the electrostatic potential had dropped. Indeed, in this high ionic strength medium, the Debye length is short and the electro-static interactions quickly vanish with distance.
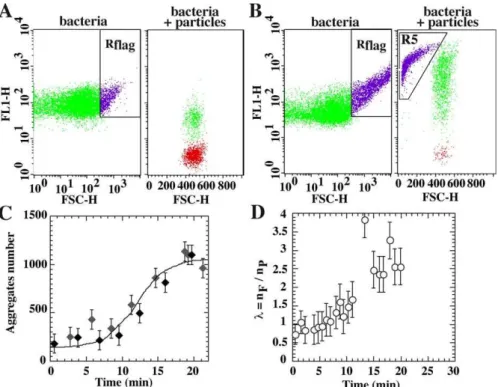
A Second Colonization Phase Observed with Curli-Expressing Bacteria Was Correlated with an Increase in Free-Floating and Surface-Associated Bacterial
Aggregates
After the initial binding phase, the MG1655gfpompR234 colonization kinetics profile systematically displayed a sudden increase about 10–12 min after cell–particle contact (Figure
4A and 4E). Concomitantly, we observed a drastic increase in the population contained in the gate characteristic of bacterial aggregates (Rflag), along with the appearance in the
colloid plot of a new population collected in gate R5 (bacterial aggregates fluorescence (channel 1) region in particles records), corresponding to larger size particle-free bacterial aggregates (Figure 5A–5C). The kinetics curve showed that MG1655gfpompR234—but not MG1655gfpDcsgA—aggregation started after a 10-min lag, suggesting that aggregation could result from a biological shift in curli production. Indeed, when cells were incubated 15 min in the presence of 100lg/ml of the translation inhibitor chloramphenicol before adhesion test, the second adhesive phase was abolished as well as the drastic cell-cell aggregation increase (unpublished data). During this second phase, we also observed a rapid exponential increase in the cooperative index (Figure 5D), which indicated that already occupied particles were prefer-entially but not exclusively colonized. In addition, a synchronized increase in PI labeling of colonized particles (Figure 4D), but no change in cell-free particle labeling (unpublished data), showed that this second phase coloniza-tion induced an increase in the negative potential of the colonized surfaces.
Cell-cell aggregation also occurred when the experiment was conducted in the absence of particles, therefore ruling out the hypothesis of a surface-induced process (Figure 5C).
Kinetics of Particle Colonization Is Dependent on the Nature of Adhesion Factors Expressed by Bacteria
To evaluate the specificity of our observations with curli-expressing bacteria, we tested the adhesive properties of E.
Figure 5.Self-Association of Free-Floating Cells and Cooperative Effects in Curli-Producing Bacteria
Bacteria (left) and colloid (right) dot plots of MG1655gfpompR234brought into contact with NH3þparticles before (A) and after (B) second colonization phase onset. (C) Number of events comprised in the Rflaggate in the presence (black diamond) or absence (gray diamond) of particles. Cells were taken from a culture (DO¼0.5) and resuspended by pipetting in an adequate volume of buffer at timet¼0. (D) Time dependence of cooperative index,k, during MG1655gfpompR234colonization.
coli strains expressing other well-characterized adhesion factors. We first analyzed the adhesion profile of anE. coli strain that constitutively produces the autotransported adhesin Ag43, a short, 10-nm, surface-exposed adhesin known to promote cell-cell interactions and biofilm formation [12– 14]. Ag43-mediated cell-to-cell association was confirmed by the presence of a significant number of events in aggregate-characteristic gates (Figure 6A). However, interestingly, the adhesion profile of Ag43þcells (MG1655gfpPcLflu) was very
close to that of the Ag43-depleted strain (MG1655gfpDflu) (Figure 6B).This shows that, by contrast with curli expression, the strong cell-to-cell aggregation induced upon Ag43 expression did not correlate with surface attachment. This is probably due to lack of efficient initial bacterial adhesion enabling further anchoring of bacterial aggregates.
Next we examined the adhesive behavior of anE. colistrain expressing the F-conjugative pilus, which promotes both
initial adhesion and biofilm maturation [15]. We compared colonization of the F-free strain (MG1655gfp) with an F-carrying strain (MG1655gfpF). We observed that F expression supported a significant one-phase surface attachment the kinetics of which could be approximated to a first-order-like process (Figure 6C). The plateau was obtained at Nmax¼2.7
bact part1with a time constantka¼0.16 min1, indicating an
initial adhesion rate ofNmaxka¼0.45 bact min1part1, close
to that of curli-expressing strain MG1655gfpompR234in phase I (see Figure 4C). Meanwhile, the F pilus-expressing cells did not exhibit significant self-association properties under these conditions (Figure 6D), indicating that this appendage did not support strong cell-to-cell interactions as curli or Ag43 did. Moreover, no second adhesive phase was observed and the cooperative index of F-carrying strains displayed no significant deviation from the unit (Figure 6E), which is consistent with the idea of a second adhesive phase correlated
Figure 6.Aggregation and Surface Colonization Kinetics of Cells Expressing Different Cell Surface Adhesins
and produces increasing information on molecular factors that promote biofilm, the precise mechanism by which bacteria adhere to inert surfaces is not well understood [16,17].
We analyzed initial steps in bacterial attachment to abiotic surfaces by developing a new methodological approach that combined the use of a colloidal micrometric bead suspension as adhesion substrate and FCM. This strategy enabled the design of a real-time, multiparametric analysis to simulta-neously monitor surface attachment, free-floating bacteria, and the surface physico-chemical state in the same sample, with the precision of a single cell and a time resolution of a few tens of seconds, without any separation step. Previous original attempts to assess initial binding kinetics used quartz microbalance equipment [18]. Although quartz resonance microbalance provides online monitoring of the physical state of the adsorbed cell layer reported by frequency shifts, it cannot be directly related to the numbers of attached cells. In contrast, FCM using colloids as adhesion substrates enabled us to directly monitor adhesion kinetics, providing initial binding rates that are unequivocal parameters of cell-surface association. These parameters are unaffected by bacterial features that are not part of initial adhesion, such as the division rate or resistance to shear or gene-dependent transition leading to biofilm. Moreover, the multi-parametric nature of FCM offered the opportunity of correlating initial adhesion with surface property changes and free-floating cell aggregation shifts, two phenomena involved in surface colonization. FCM kinetics are obtained on large cell populations with high statistical weight even for small subsets (.1%). However, unlike microscope imaging, this technique does not allow monitoring the fate of a single bacterial cell over time [19,20].
We showed that expression of several well-defined adhesion factors induced significant differences in early adhesion profiles recorded after cell surface exposure. We first demonstrated the direct implication of curli and F-conjuga-tive pilus in cell surface attachment within the first minutes of contact. In contrast, the strain constitutively expressing short surface adhesin Ag43 displayed no significant rapid initial surface binding. Yet this appendage was implicated in abiotic surface colonization in various models [9,21]. This suggests that the Ag43 adhesin does not contribute to early steps in interactions between bacteria and the surface; rather, it may participate in subsequent steps of biofilm maturation not investigated in our short–time scale approach.
Kinetic characteristics of this initial surface binding support the hypothesis of the formation of a finite number of links between cell and particle surfaces rather than a physicochemical surface interaction, which would saturate either at cell population exhaustion or at surface over-crowding. Binding could occur either from the formation of a molecular complex between bacterial appendages and
bind-origin has been frequently addressed [2,22,23]. However, bacteria themselves produce macromolecules with sufficient surface activity to play a role in bacterial adhesion. This surface conversion induced by anionic surface-active mole-cules contained in the bacterial suspension could be one of the main reason why no clear relationship between initial surface physicochemical properties and bacterial adhesion has been established up to now [24], and that it might also partially explain why the DLVO theory has been generally unsuccessful in describing bacterial colonization.
We have no information as yet on the nature of the anionic biomacromolecule involved in the observed fast surface conversion, although bacterial surface polysaccharides such as released capsule fragment or LPS might be good anionic macromolecular candidates [25,26]. This surface conditioning accounts for the repulsive potential observed between MG1655gfpDcsgAand the particle surface. This phenomenon is of particular interest in elucidating bacterial adhesion mechanisms, since it might constitute a mechanism by which nature selects the adhesive organisms, by first setting a repulsive surface potential.
In addition to initial surface contact, curli-expressing bacteria exhibited a second kinetic phase that correlated with the onset of significant bacterial self-aggregation. This second colonization phase could be due to the accumulation of curli subunits at the surface of the bacteria and developed cooperatively. Suppression of this second phase by chlor-amphenicol treatment known to stop translation suggests that de novo synthesis of curli during the adhesion process is responsible for curli accumulation (unpublished data). Con-sistently, when curli genes were placed under the control of an anhydrotetracyclin inducible promoter, ptetO [27], both aggregation and adhesion increased with increasing concen-tration of the inducer (unpublished data). Interestingly, although the strain constitutively expressing adhesin Ag43 displayed a strong aggregation phenotype, as expected from previous reports, it did not display secondary surface colonization [13,27,28]. Consistently, no second colonization phase was observed withE. coliexpressing the F-pilus, which exhibited no rapid free-floating self-association in our experimental conditions using dispersed exponentially grown bacteria. Altogether, this demonstrates that early surface-bound cells could serve as anchors initiating cell associations, in good agreement with the role played by curli in biofilm maturation [10,29,30] and suggests that extensive cell-cell aggregation can amplify surface colonization, provided sufficient initial surface binding has occurred.
transi-tion actually describes differential resistance to shear due to contact maturation in an out-of-equilibrium process. In experiments presented here, we monitored only irreversible adhesion in the thermodynamic sense; indeed no sponta-neous binding shift upon dilution of suspension was observed. We show here that these irreversible interactions could take place during the first seconds of the contact independently of a prior reversible step. It is very likely that in our experiments, reversible events such as those described by Agladze et al. are instantaneously discarded by exposure to hydrodynamic flow (stirring and FCM shear flow) [32].
In conclusion, we have introduced a new short–time resolution tool for quantitative and statistical analysis of surface adhesion. It enables determination of initial cell-surface binding kinetics and analysis of initial adhesive behaviors conferred by different bacterial cell surface structures. Beyond initial adhesion, we show that cell–cell aggregation properties held by several surface appendages amplify surface colonization once initial adhesion is estab-lished. This suggests a biofilm development scenario in which various adhesion factors contribute to different but comple-mentary tasks to colonize the abiotic surface. During this process, micrometric structures such as curli and F-pilus support the formation of initial contact with the surface, the properties of which are strongly influenced by surface-active biomacromolecules. Further elucidation of molecular inter-actions behind initial steps in bacterial adhesion might help to elaborate original approaches to limiting biofilm develop-ment.
Finally, we believe that quantitative and kinetic dissection of early adhesion events could also represent a powerful way to investigate other aspects of biofilm development, including evaluation of potential antiadhesive compounds, gene ex-pression upon surface contact or strain competition and cooperation during surface colonization.
Materials and Methods
Bacterial strains and growth conditions. Constitutive curli
pro-ducers (MG1655gfpompR234) were obtained by transducing, intogfp
-tagged MG1655 (MG1655gfp), theompR234mutation that specifies a
gain of function allele ofompR, a gene encoding an activator of the
curli operon [10]. MG1655gfpF carries a derivative of the
F-conjugative plasmid. Non-curli producers (MG1655gfpDcsgA),
non-Ag43 producers (MG1655gfpDflu), as well as constitutive Ag43
(MG1655gfpPcLflu) producers were constructed by a three-step PCR
procedure as described in [33,34]. The latter strains were constructed
by introducing, in front of theflugene, thekmPcL cassette, which
enables constitutive expression of chromosomal target genes [27]. Primers used to perform, verify, and sequence the different constructions are listed in Table S1. All strains were grown in lysogeny broth (LB) medium or, for adhesion experiments, in defined
M63B1 medium with 0.4% glucose (M63B1Glu) at 308C for curli
experiments or 378C for other experiments. Antibiotics were added
when required: kanamycin (Km, 50lg/ml), chloramphenicol (Cm, 25
lg/ml), ampicillin (Amp, 100lg/ml), spectinomycin (Spec, 50lg/ml),
and tetracycline (Tet, 7.5lg/ml).
Colloidal surfaces. 10-lm-diameter polystyrene latex particles
functionalized with carboxyl groups (COO–) were purchased from
Polysciences. Particles were used either with their initial carboxyl functionalization after extensive washing and re-suspension in M63B1 minimal medium, or after surface treatment with polyethy-lenimine permethobromide a cationic, 6,300 molecular weight, branched polymer according to the principle initially introduced by Decher [35]. Briefly, particles were washed in pure water by
filtration over 0.60lm of diameter filter, adjusted to a concentration
close to 106/ml and gently stirred for 5 min in the presence of 3
3103
M polyethylenimine (monomer concentration), which corresponds to an excess of positive charges compared to the negative charges of the
colloidal particles. The permethylated amine polymer adsorbed rapidly onto the negatively charged particle, producing a net charge
inversion and providing a cationic amino-functionalization (NH3þ
particles). Particles were then washed four times before being concentrated five times in the experiment buffer, usually PBS or M63B1. The quality and stability of the deposit were checked by measuring the zeta potential in water using a Malvern zetasizer nano
ZS Malverninstrument:55 mV andþ45 mV for COO– and NH
3þ
particles, respectively. The deposit remained stable for several weeks, therefore confirming the robust adsorption already mentioned by other authors [36]. The colloid particles used in this study did not
display any bactericidal activity againstE. colicells.
FCM. FCM analyses of bacteria and colloid suspensions were
performed using a Becton-Dickinson flow cytometer (Facscalibur). GFP and green dye PYR emissions were recorded in fluorescence channel FL1 (band pass centered on 530 nm). The PI signal was
collected in channel FL3 (.650 nm). Two different acquisitions were
performed on each sample to collect either the bacterial signal or the colloid signal (lower FSC and SSC (side scattering) amplifications were used for colloids, but the same fluorescence gain settings were used for both objects). At least 1,500 events were recorded in colloid acquisition and 15,000 in that of bacteria. Data were analyzed using CellQuest (BDIS) and FlowJo (Tree Star) multivariate analysis software.
Adhesion assay.Cells and particles were brought into contact in a
round-bottom tube. An adequate volume of exponentially growing
bacterial suspension—DO590¼ 0.5–0.6 in M63B1Glu—was usually
injected at time t¼0 into a particle suspension adjusted to the
appropriate concentration in M63B1 and stirred at room
temper-ature on a soft vortex (1,000 rpm min1). Total volume of this
incubator was usually equal to 500ll. Aliquots of 5–20ll were taken
at given incubation times for immediate analysis in FCM in 300ll
PBS supplemented with 5 picomoles PI or microscope imaging.
Supporting Information
Figure S1. Surface Charge Detection by FCM
FCM dot plots of PYR- (2nd column) and PI- (3rd column) labeled cationic (1st row) and anionic (2nd row) particles. Five picomoles of the appropriate dye were introduced in each particle sample. Found at doi:10.1371/journal.pbio.0060167.sg001 (491 KB PDF).
Figure S2. GFPþand GFP–E. coliMixture in FCM Analysis
Fluorescence dot plots of GFPþand GFPcell mixtures 50/50, 10/90,
and 1/99 from left to right. Aliquots of exponentially growing cultures
were diluted in PBS to obtain a 53106cells/ml suspension. Numbers
of cells in each population very closely matched proportions expected from the mixtures.
Found at doi:10.1371/journal.pbio.0060167.sg002 (451 KB PDF).
Figure S3. Fluorescence Signal Calibration
FCM signal of particles alone (A) or cell-particle contact using 100-fold excess of particles over bacteria (B), ensuring that only rare but single cell adhesion events would statistically appear compared with
the signal of free-floating bacteria, fli, recorded in parallel on the
same sample (C). Mean fluorescence (FL1) intensity of single cell– carrying particles, calculated on ten independent recordings (72
single cell–carrying particles detected), was found equal to 4265,
whereas free-floating bacteria displayed a mean fluorescence of 416
3, calculated for 98% of the population around the distribution mode (FL1). An example of data is shown here. Gate R2 corresponds to bare particles, whereas gate R3 corresponds to colonized particles. Found at doi:10.1371/journal.pbio.0060167.sg003 (462 KB PDF).
Figure S4. MG1655gfpompR234and MG1655gfpDcsgASurface
Colo-nization
FCM dot plots and kinetic curves of MG1655gfpompR234 (A) and
MG1655gfpDcsgA(B). Particles and cells were brought into contact at
timet¼0. Plots show net segregation between cell-bearing particles
and free particles. Cell to particle ratio was around 200 and particle
concentration equal to 63106/ml.
Found at doi:10.1371/journal.pbio.0060167.sg004 (500 KB PDF).
Figure S5. Surface Charge Inversion Effects
(A) FL1 and FL3 dot plots showing red labeling of both colonized and cell-free particles before (2 left panels) and from 1 min after (3 right
Found at doi:10.1371/journal.pbio.0060167.sg005 (640 KB PDF).
Table S1. Primers Used in This Study
Found at doi:10.1371/journal.pbio.0060167.st001 (38 KB DOC).
Genomics (LSHB-CT-2005–512061), and the Fondation BNP PAR-IBAS.
Competing interests.The authors have declared that no competing
interests exist.
References
1. Hall-Stoodley L, Costerton JW, Stoodley P (2004) Bacterial biofilms: from the natural environment to infectious diseases. Nat Rev Microbiol 2: 95– 108.
2. Donlan RM (2002) Biofilms: microbial life on surfaces. Emerg Infect Dis 8: 881–890.
3. Katsikogianni M, Missirlis YF (2004) Concise review of mechanisms of bacterial adhesion to biomaterials and of techniques used in estimating bacteria-material interactions. Eur Cell Mater 8: 37–57.
4. Bos R, van der Mei HC, Busscher HJ (1999) Physico-chemistry of initial microbial adhesive interactions–its mechanisms and methods for study. FEMS Microbiol Rev 23: 179–230.
5. de Kerchove AJ, Elimelech M (2005) Relevance of electrokinetic theory for
‘‘soft’’ particles to bacterial cells: implications for bacterial adhesion. Langmuir 21: 6462–6472.
6. Steen HB (2000) Flow cytometry of bacteria: glimpses from the past with a view to the future. J Microbiol Methods 42: 65–74.
7. Sethman CR, Doyle RJ, Cowan MM (2002) Flow cytometric evaluation of adhesion of Streptococcus pyogenes to epithelial cells. J Microbiol Methods 51: 35–42.
8. Pathirana RD, O’Brien-Simpson NM, Visvanathan K, Hamilton JA, Reynolds EC (2007) Flow cytometric analysis of adherence of Porphyr-omonas gingivalis to oral epithelial cells. Infect Immun 75: 2484–2492. 9. Pratt LA, Kolter R (1998) Genetic analysis of Escherichia coli biofilm
formation: roles of flagella, motility, chemotaxis and type I pili. Mol Microbiol 30: 285–293.
10. Vidal O, Longin R, Prigent-Combaret C, Dorel C, Hooreman M, et al. (1998) Isolation of anEscherichia coliK-12 mutant strain able to form biofilms on inert surfaces: involvement of a new ompR allele that increases curli expression. J Bacteriol 180: 2442–2449.
11. Barnhart MM, Chapman MR (2006) Curli biogenesis and function. Annu Rev Microbiol 60: 131–147.
12. Owen P, Meehan M, de Loughry-Doherty H, Henderson I (1996) Phase-variable outer membrane proteins inEscherichia coli. FEMS Immunol Med Microbiol 16: 63–76.
13. Henderson IR, Meehan M, Owen P (1997) Antigen 43, a phase-variable bipartite outer membrane protein, determines colony morphology and autoaggregation inEscherichia coliK-12. FEMS Microbiol Lett 149: 115–120. 14. Schembri MA, Kjaergaard K, Klemm P (2003) Global gene expression in
Escherichia colibiofilms. Mol Microbiol 48: 253–267.
15. Ghigo JM (2001) Natural conjugative plasmids induce bacterial biofilm development. Nature 412: 442–445.
16. Palmer J, Flint S, Brooks J (2007) Bacterial cell attachment, the beginning of a biofilm. J Ind Microbiol Biotechnol 34: 577–588.
17. Van Houdt R, Michiels CW (2005) Role of bacterial cell surface structures in Escherichia coli biofilm formation. Res Microbiol 156: 626–633. 18. Otto K, Elwing H, Hermansson M (1999) Effect of ionic strength on initial
interactions of Escherichia coli with surfaces, studied on-line by a novel quartz crystal microbalance technique. J Bacteriol 181: 5210–5218. 19. Vigeant MA, Ford RM, Wagner M, Tamm LK (2002) Reversible and
irreversible adhesion of motile Escherichia coli cells analyzed by total internal reflection aqueous fluorescence microscopy. Appl Environ Micro-biol 68: 2794–2801.
20. Caiazza NC, O’Toole GA (2004) SadB is required for the transition from
reversible to irreversible attachment during biofilm formation by Pseudomonas aeruginosa PA14. J Bacteriol 186: 4476–4485.
21. Cookson AL, Cooley WA, Woodward MJ (2002) The role of type 1 and curli fimbriae of Shiga toxin-producingEscherichia coliin adherence to abiotic surfaces. Int J Med Microbiol 292: 195–205.
22. Dunne WM Jr. (2002) Bacterial adhesion: seen any good biofilms lately? Clin Microbiol Rev 15: 155–166.
23. Bakker DP, Klijnstra JW, Busscher HJ, van der Mei HC (2003) The effect of dissolved organic carbon on bacterial adhesion to conditioning films adsorbed on glass from natural seawater collected during different seasons. Biofouling 19: 391–397.
24. Bos R, van der Mei HC, Gold J, Busscher HJ (2000) Retention of bacteria on a substratum surface with micro-patterned hydrophobicity. FEMS Micro-biol Lett 189: 311–315.
25. Valle J, Da Re S, Henry N, Fontaine T, Balestrino D, et al. (2006) Broad-spectrum biofilm inhibition by a secreted bacterial polysaccharide. Proc Natl Acad Sci U S A 103: 12558–12563.
26. Hanna A, Berg M, Stout V, Razatos A (2003) Role of capsular colanic acid in adhesion of uropathogenic Escherichia coli. Appl Environ Microbiol 69: 4474–4481.
27. Da Re S, Le Quere B, Ghigo JM, Beloin C (2007) Tight modulation of Escherichia coli bacterial biofilm formation through controlled expression of adhesion factors. Appl Environ Microbiol 73: 3391–3403.
28. Kjaergaard K, Schembri MA, Hasman H, Klemm P (2000) Antigen 43 from Escherichia coliinduces inter- and intraspecies cell aggregation and changes in colony morphology ofPseudomonas fluorescens. J Bacteriol 182: 4789–4796. 29. Prigent-Combaret C, Brombacher E, Vidal O, Ambert A, Lejeune P, et al. (2001) Complex regulatory network controls initial adhesion and biofilm formation inEscherichia colivia regulation of thecsgDgene. J Bacteriol 183: 7213–7223.
30. Kikuchi T, Mizunoe Y, Takade A, Naito S, Yoshida S (2005) Curli fibers are required for development of biofilm architecture in Escherichia coli K-12 and enhance bacterial adherence to human uroepithelial cells. Microbiol Immunol 49: 875–884.
31. Agladze K, Jackson D, Romeo T (2003) Periodicity of cell attachment patterns duringEscherichia colibiofilm development. J Bacteriol 185: 5632– 5638.
32. Agladze K, Wang X, Romeo T (2005) Spatial periodicity of Escherichia coli K-12 biofilm microstructure initiates during a reversible, polar attachment phase of development and requires the polysaccharide adhesin PGA. J Bacteriol 187: 8237–8246.
33. Lesic B, Bach S, Ghigo JM, Dobrindt U, Hacker J, et al. (2004) Excision of the high-pathogenicity island of Yersinia pseudotuberculosis requires the combined actions of its cognate integrase and Hef, a new recombination directionality factor. Mol Microbiol 52: 1337–1348.
34. Chaveroche MK, Ghigo JM, d’Enfert C (2000) A rapid method for efficient gene replacement in the filamentous fungus Aspergillus nidulans. Nucleic Acids Res 28: E97.
35. Decher G (1997) Fuzzy Nanoassemblies: Toward Layered Polymeric Multicomposites. Science 277: 1232–1237.