www.nat-hazards-earth-syst-sci.net/8/1349/2008/ © Author(s) 2008. This work is distributed under the Creative Commons Attribution 3.0 License.
and Earth
System Sciences
Runoff generation dynamics within a humid river basin
S. Manfreda
Dipartimento di Ingegneria e Fisica dell’Ambiente (DIFA), Universit`a degli Studi della Basilicata, via dell’Ateneo Lucano, 10, Potenza, 85100, Italy
Received: 25 April 2008 – Revised: 1 October 2008 – Accepted: 27 October 2008 – Published: 8 December 2008
Abstract. The present paper introduces an analytical ap-proach for the description of the soil water balance and runoff production within a schematic river basin. The model is based on a stochastic differential equation where the rain-fall is interpreted as an additive noise in the soil water bal-ance and is assumed uniform over the basin, the basin het-erogeneity is characterized by a parabolic distribution of the soil water storage capacity and the runoff production occurs for saturation excess. The model allowed to derive the prob-ability density function of the produced surface runoff high-lighting the role played by climate and physical characteris-tics of a basin on runoff dynamics. Finally, the model have been tested over a humid basin of Southern Italy proposing also a strategy for the parameters estimation.
1 Introduction
Runoff production mechanisms are influenced by several fac-tor such as: the condition of the soil surface and its vegetative cover, the soil texture, and the antecedent soil moisture con-tent. The role of each of those factors may change according to the specific climatic conditions. In particular, Hortonian runoff production mechanism (Horton, 1933) for describing storm runoff is more suitable for arid region, where infil-tration capacity is generally lower. In most humid regions, permeability of the soil is high because the vegetation cover protects the soil from rain packing and creates an open soil structure. Under such conditions, rainfall intensities gener-ally do not exceed infiltration capacities and consequently Hortonian overland flow does not occur. In humid environ-ment, the variable source area concept, first introduced by Hewlett and Hibbert (1967), is widely accepted to explain
Correspondence to:S. Manfreda ([email protected])
storm runoff production through return flow and direct pre-cipitation. The variable source area represent the saturated portion of the basin that vary dynamically according to the soil moisture state of the basin.
Recently, Manfreda and Fiorentino (2008) developed a new model aimed at the definition of the probability dis-tribution of the relative saturation of a basin characterized by a parabolic distribution of the soil water storage capac-ity. The model stems from previous works carried out, using a stochastic differential equation, to describe the soil mois-ture dynamics at the point scale (e.g., Rodr´ıguez-Iturbe et al., 1999; Laio et al., 2001; Porporato et al., 2004). The proposed scheme includes a number of approximations, but it leads to an interesting framework for the derivation of the main statis-tics of basin scale variables. Among others, our interest fo-cused on the behavior of saturated areas over a basin that may be responsible of the dynamics of runoff generation.
The theory is based on the conceptual model Xinanjiang that describes watershed heterogeneity using a parabolic curve for the distribution of the water storage capacity (Zhao et al., 1980). The Xinanjiang model is a well-known lumped watershed model widely used in China. Furthermore, the proposed relationship between the extent of saturated areas and the volume of water stored in the catchment has driven the evolution of a number of more recent models such as the Probability Distributed Model (Moore and Clarke, 1981; Moore, 1985, 1999), the VIC model (Wood et al., 1992, 1997; Liang et al., 1994) and the ARNO model (Todini, 1996).
The normalized version of the density function of rainfall depths can be described as
fH(Y )=γ e−γ Y (1)
whereγ=wmax/α andwmax is the maximum value of the
water storage capacity in the basin.
The spatial heterogeneity of rainfall is neglected assuming uniform distribution of rainfall occurring at random in time over the entire basin. Such an assumption may be more or less reliable depending on climatic characteristics of the area and the basin size. In general, this hypothesis becomes more realistic for river basins of medium/small sizes and in humid regions.
2.2 The variability of the soil water storage capacity over the basin
The soil thickness is assumed to vary over the basin accord-ing to a given distribution. In fact, the heterogeneity in the soil water storage capacity was observed to be a controlling factor in the temporal dynamics of soil moisture (Manfreda and Rodr´ıguez-Iturbe, 2006). For sake of simplicity, the re-maining sources of heterogeneity like pattern of vegetation and soil texture variability have been neglected assuming that the soil texture as well as the vegetation are uniform over the watershed.
The watershed heterogeneity is described using a parabolic curve for the water storage capacity of the soil (Zhao et al., 1980)
f F =1−
1− W
wmax
b
(2) wheref/F represents the fraction of the basin with water storage capacity≤W,wmaxrepresents the maximum value
of the water storage capacity in the basin andb is a shape parameter that according to Zhao (1992) assumes values be-tween 0.1–0.4 increasing with the characteristic dimension of the basin. The parameterb controls the spatial variabil-ity ofW that increases with larger values ofband becomes uniform whenb=0.
tive saturated areas,a, are described by the same relationship given in Eq. (2) whereacorrespond to the ratiof/F.
The watershed-average soil moisture storage at timet, is the integral of 1−f/F between zero and the actual value of the water level in the basin scheme,wmt,
Wt =W M
1−1− wmt
wmax
1+b
. (4)
Under the described schematization, the relative saturation of the basin, s, expressed as the ratio between watershed-average soil moisture storage and the total available volume can be defined as
s= Wt
W M =
1−1− wmt
wmax
1+b
. (5)
2.3 The soil water losses
The function describing the soil water losses represents the deterministic part of the stochastic equation describing the soil water balance. It depends on the local value of the soil water content and the maximum rate of soil water losses. The main contributions to soil losses are given by: the actual evapotranspiration and the soil leakage. A possible approxi-mation for the sum of this two terms is given by a linear func-tion where the soil loss is assumed to be proporfunc-tional to the soil water content (see e.g. Entekhabi and Rodr´ıguez-Iturbe, 1994; Pan et al., 2003; Isham et al., 2005)
L(ζ )=V ζ (t, x), (6)
whereL(ζ )is the soil water loss relative to the soil saturation
ζ (t, x)at timet in the pointx in space, andV is the water loss coefficient.
The described linear equation was used in several an-alytical and experimental studies. Among others, Pan et al. (2003) defined an expression to estimate the values ofV
as a function of the soil permeability,Ks, and Leaf Area
In-dex (LAI). They obtained two different expressions in the two considered study cases
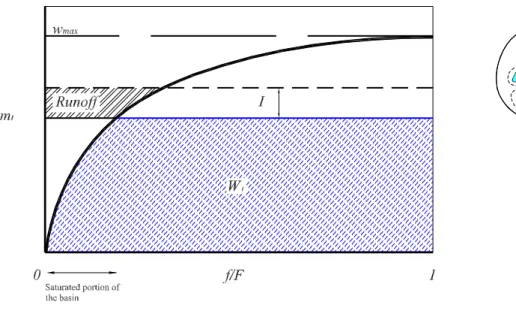
Fig. 1.Schematization of the basin structure and soil water content distribution. The black line represents the distribution of the soil water storage capacity,W, that ranges from 0 towmax; the blue line depicts the water distribution over the schematic basin whose level iswmt;
the dashed line depicts the increase inwmt after a rainfall event producing an infiltrationIover the unsaturated portion of the basin, while
the saturated and the becoming saturated portion of the basin will produce a runoff represented by the dashed area of the graph.
whereV is expressed in mm/day and Ks in cm/h. Among the two, the one derived from the Washita ’92 data set was successfully tested by Manfreda and Fiorentino (2008) in a Mediterranean basin.
Since the adopted soil loss function is a linear one, it can be generalized at the basin scale using the product between the relative basin saturation,s, and the water loss coefficient. The soil water loss function at the basin scale becomes
Lb(wmt)=V s=V 1−
1− wmt
wmax
1+b!
. (8)
For analytical purposes, the soil water losses can be ex-pressed as a function of the ratioR=wmt
wmax using an
approxi-mated expression in exponential form. In this case, the soil water losses are expressed as
Lb
R= wmt wmax
∼ =V
e−kR
−1
e−k−1
(9) wherek is a coefficient that has been used to fit the above with Eq. (8). This yieldsk∼=b/b7−13.
2.4 The water balance equation
The water balance equation can be written at the basin scale working with the water level in the parabolic reservoir that leads to the following stochastic differential equation inwmt
dwmt
dt =I−V s, (10)
whereI represents an additive term of infiltration and water losses are assumed to be proportional to the relative satura-tion of the basins. The advantage to solve the water balance equation inwmtis that the infiltration rate can be summed as
an additive term in the stochastic differential equation. After a rainfall event of depthY, the water levelwmt in the basin
schematization increases ofY as long as the rainfall depth plus the actual wmt does not exceed the maximum water
storage capacity of the basin wmax. Consequently, the
in-filtrationI is equal to the rainfall depth ifY≤(wmax−wmt)
other wise becomes equal to(wmax−wmt). The
schemati-zation, in fact, accounts for the upper bound imposed by the soil saturation.
In the present scheme, the runoff generation occurs when rainfall falls over a saturated portion of the basin. This behav-ior is comparable with a Dunne mechanism where the direct precipitation on saturated areas (saturated overland flow) is a dominant runoff generation mechanism (e.g., Hewlett and Hibbert, 1967; Dunne and Black, 1970).
The water balance equation can be solved using the stan-dardized variable
R= wmt wmax
(11)
whereR∈ [0,1].
The water balance equation becomes
dR dt =
Y wmax−
Cek(R−1)−Rγ ek−1 ekR−1 kβ
β ,
whereC is a constant of integration that may be computed simply imposing the normalizing condition,R1
0 p(R)dR=1.
Thus,Cassumes the following value
C=1/
Z 1
0
ek(−1+R)−Rγ ek−1
ekR−1−1+λ−ekβ−k λ
β dR (15)
C= β
Ŵ[1−γk]Ŵ
λ−e−k λ kβ
kek Ŵ
kβ−βγ+λ−e−k λ kβ
+ F1
" 1−γk,1+
(e−k−1)λ kβ ,2−
γ k,ek
#
eγ (γ−k)
·
1
(−1)
λ−e−k λ kβ (ek−1)
(16)
whereŴ[.]is the complete Gamma Function andF1[., ., ., .]
is the Hypergeometric Function (Abramowitz and Stegun, 1964).
The analytical expression of the probability density func-tion of the standardized variableR(Eq. 14) can be used to de-rive the probability distributions of the relative saturation and of the saturated areas of the basin. This is a straightforward operation when the functional relationships between these variables are determined. Manfreda and Fiorentino (2008) provide the analytical probability distribution for these two variables also describing the role played by the model pa-rameters on the dynamics of saturated areas as well as rela-tive saturation of the basin.
3 Cumulative probability distribution of runoff
In the present section, the cumulative probability distribu-tion of runoff is derived within the context of the analytical framework traced in the previous paragraphs.
The runoff production mechanisms at the catchment scale are mostly controlled by the temporal variability and also by the spatial variability of rainfall processes (this last is ne-glected in the present study), and by the spatial distribution of soil moisture. In the proposed schematization, the runoff
The above expressions can be inverted as a function ofY
using in the first case a Taylor expansion of the second or-der around zero, while the second expression can be inverted without any approximation. It follows that
Y =
wmax (1−R)b−1+ r
2bq(1−R)b−1 wmax +((1−R)
b−1)2
!
b(1−R)b−1 ;Y≤(1−R)wmax
q+wmax 1+b(1−R)
1+b
; Y≥(1−R)wmax
(18)
In order to derive the probability distribution of runoff, one should integrate the join probability distribution of rainfall,
Y, andR over the proper region of the 2-D space inR and
Y where the runoff is lower than an assigned q (e.g., Ben-jamin and Cornell, 1970). The CDF of the runoff assumes the following expression
PQ(q)=
Z R1
0
Z
wmax (1−R)b−1+
r
2bq(1−R)b−1
wmax +((1−R)b−1) 2
!
b(1−R)b−1
0
p(R)g(Y )dY dR
+
Z 1
R1
Z q+wmax(1−R)
1+b
1+b
0
p(R)g(Y )dY dR
(19)
where
R1≃
1
6 1−b+
p
b(5+b)2wmax−12(1+b)(2+b)
√
bwmax
!
(20)
q[mm/day]
R
Y[mm]
< (1- )
Y R wmax
> (1- )
Y R wmax wmax
R’
Partial contributing area mechanism
Total contributing area mechanism
Fig. 2.Description of runoff as a function of the rainfall depth,Y, and the state of the basin described by the ratioR=wmt
wmax.
10 20 30 40 50 60
mm/day 0.05
0.10 0.15 0.20
( )
p q
Rainfall wmax wmax wmax
wmax
10 20 30 40 50 60
mm/day 0.05
0.10 0.15 0.20
( )
p q
b
b b b
10 20 30 40 50 60
mm/day 0.05
0.10 0.15 0.20
( )
p q
mm/day
mm/day mm/day mm/day V
V V V
10 20 30 40 50 60
mm/day 0.05
0.10 0.15 0.20
( )
p q
event/day event/day event/day event/day
l
l l l
Fig. 3.Probability density functions of runoff and rainfall obtained varying the parameters: wmax(top-left),b(top-right),V (bottom-left)
19610 1962 1963 1964 1965 1966 1967 1968 1969 1970 1971 1972 10
20 30
Time [years]
Runoff [mm/day]
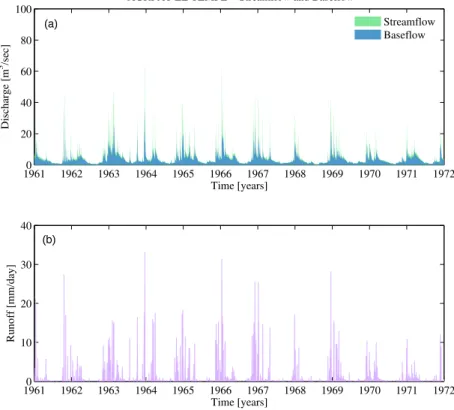
Fig. 4.Time series of the recorded streamflow over the period 1961–1971 at the station of “Le Tempe” of the Agri basin, a humid catchment of 174 km2located in Southern Italy: (a)the graph describes the two components of the streamflow: the baseflow (colored in light blue) computed using the physically based filter proposed by Furey and Gupta (2001) and the second relative to the surface runoff (colored in green);(b)runoff production over the considered temporal window obtained as the difference between the recorded streamflow and the computed baseflow.
10 20 30 40 50 60
mm/day 0.05
0.10 0.15 0.20 0.25 0.30
p(q)
Fig. 5.Probability density functions of the runoff (red full circles) and the rainfall (green full circles) measured over the Agri basin at “Le Tempe” (Southern Italy) during the period 1961–1971. The continuous and the dashed lines represents the theoretical distribu-tion of rainfall depths and runoff computed with the following pa-rameters: λ=0.43 event/day,α=10.1 mm,V=6.24 mm/day,b=0.39 and finallywmaxis assumed equal to 198 mm.
4 Results and discussion
The probability density functions (PDFs) of runoff, obtained by derivation inqof Eq. (19), are plotted in Fig. 3 using dif-ferent set of parameters. In particular, PDFs are obtained adopting a given set of climatic and physical parameters changing the characteristics of the soil water storage capac-ity through the parameters maximum water storage capaccapac-ity,
wmax, and exponentbin the first and second graph of Fig. 3 (top-left and top-right). The third and fourth graphs describe the effects due to the soil water loss coefficient,V, and the rainfall rate, λ, on the runoff dynamics. In each of those graphs, the PDF of rainfall amount is also plotted in order to better understand the rainfall/runoff dynamics within the described scheme.
Among others, the parameter that seems to play a major role in the dynamics of runoff production is the coefficient of soil water loss that depends on evapotranspiration and leak-age losses of the basin (Fig. 3 bottom-left). Finally, the pa-rameterλalso affects the runoff production being a control-ling factor for the characteristic climate of the basin (Fig. 3 bottom-right).
4.1 Model application to a real case
The proposed probability distribution of runoff production may be used and applied to a real case to predict the dy-namics of a hydrological system given the climatic forcing and the physical characteristics of the basin. In particular, parametersαandλcan be easily defined from rainfall data at the daily scale, while the remaining parameters requires information on the soil permeability, vegetation cover, and topography.
In the present section, an application to a study basin of Southern Italy is presented in order to describe a possible es-timation strategy for the model parameters. The challenge is to define those parameters starting from the available phys-ical information of the basin avoiding to fit the theoretphys-ical distribution on the observed probability distribution of sur-face runoff.
The basin studied is the Agri basin closed at Le Tempe where a time series of 11 years of streamflow is available (see Fig. 4a). This record is necessary to test the model con-sistency in the description of runoff pruduction. It necessary to remark that the probability density functions refer to the surface runoff produced by the river basin and for this reason it is necessary to separate the baseflow component from the time series of streamflow. One possible strategy is to apply a mathematical filter to remove the baseflow component from the time series. The surface runoff data was estimated ap-plying the physically-based mathematical filter proposed by Furey and Gupta (2001) to streamflow data considering the the overland flow coefficient,c1, and the recharge coefficient, c3, of the model variable from month to month following to
the work of Manfreda et al. (2003). The results of the math-ematical filter are displayed in Fig. 4 where the computed baseflow is displayed in light blue. The runoff time series are obtained as the difference between the streamflow and the baseflow during the days where a rainfall event occurred (see Fig. 4b).
Parameters of the theoretical distribution have been com-puted exploiting the available information on the Agri River basin. Rainfall parameters have been estimated from rain-fall records during the wet season (October–March), the pa-rameterV is estimated from the equation obtained by Pan et al. (2003) for the Washita’92 dataset (Eq. 7) using the mean permeability (Ks=2.40 cm/h) of the basin and the mean Leaf
Area Index (LAI=1.56) computed over the wet season. The parameter b was fitted using the method proposed by Chen et al. (2007) exploiting the TOPMODEL
topo-graphic index,WI, computed from a digital elevation model
(DEM) at 240 m of resolution. The procedure is based on the hypothesis that the cumulative frequency distri-bution of the so called index of runoff generation diffi-culty (IRDG=(max[WI]−WI)/(max[WI]−min[WI])) can
be used in place of the parabolic curve of soil water stor-age capacity of the Xinanjiang model. Under this hypoth-esis one can estimate the shape parameter b fitting Eq. 2 with the cumulative frequency distribution of IRDG obtain-ing an estimate ofb=0.39. Finally considering the small in-fluenced played by the parameterwmax, this last parameter was defined taking an average value in the range of variabil-ity (166 mm–222 mm) defined by Zhao (1984) and Zhao and Wang (1988).
The obtained probability distribution of surface runoff pro-vides a realistic interpretation of the dynamics of a real river basin as one can appreciate comparing the theoretical func-tion of rainfall and runoff to the ones obtained from data mea-sured over the Agri River Basin at the station of Le Tempe (Fig. 5). This example is given not with the aim to fit the ob-tained probability distribution to the measured one, but only to demonstrate the consistency of the model outcomes when compared with a real case.
5 Conclusions
In the present paper, a new approach is introduced to describe analytically the relative soil saturation of a river basin and the runoff generation dynamics. The method provides a simpli-fied description of river basin characteristics, but includes the effect of spatial variability of water storage capacity adopt-ing the same schematization used by Zhao et al. (1980) for the Xinanjiang model.
The probability distribution of runoff describes in a feasi-ble way the real dynamics of the system highlighting the role played by the different parameters controlling the soil water losses of a basin, the rate of rainfall and the characteristics of the soil water storage within a river basin. It was observed that the runoff production may be strongly controlled by the climate of the basin, while the spatial distribution of the soil water storage capacity plays a secondary role that apparently is more affected by the heterogeneity of soils that depends on the exponentbof Eq. (2) rather than the maximum water storage capacity,wmax.
wmt water level in the parabolic reservoir [cm]. Wt total water content [cm].
V water loss coefficient [cm d−1].
β=V /(wmax) is the normalized soil water loss coefficient [dimensionless].
γ=wmax/α is the normalized mean rainfall depth [dimensionless].
α mean depth of rainfall events [cm]. λ rainfall rate per unit time [d−1]. ρ(R) simplified water loss function.
Acknowledgements. Salvatore Manfreda gratefully acknowledge the support of MIUR (Italian Ministry of Instruction, University and Research) under the grant PRIN CoFin2007 entitled “Spatial-temporal patterns in hydrological and ecological processes” and of the CARICAL foundation for his research activities.
Edited by: G. Roth
Reviewed by: two anonymous referees
References
Abramowitz, M. and Stegun, I. A.: Handbook of Mathematical Functions with Formulas, Graphs, and Mathematical Tables, New York, Dover, 1046 pp., 1964.
Arnold, L.: Stochastic Differential Equations: Theory and Applica-tions, John Wiley & Sons, New York, 228 pp., 1974.
Benjamin, J. R. and Cornell, C. A.: Probability, Statistics and De-cisions for Civil Engineers, McGraw Hill, New York, 640 pp., 1970.
Chen, X., Chen, Y. D., and Xu, C.-Y.: A distributed monthly hydrological model for integrating spatial variations of basin topography and rainfall, Hydrol. Process., 21(2), 242–252, doi:10.1002/hyp.6187, 2007.
Dunne, T. and Black, R.: An Experimental Investigation of Runoff Production in Permeable Soils, Water Resour. Res., 6(2), 478– 490, 1970.
Entekhabi, D. and Rodr´ıguez-Iturbe, I.: An analytic framework for the characterization of the space-time variability of soil moisture, Adv. Water Resour., 17, 25–45, 1994.
Furey, P. R. and Gupta, V. K.: A physically based filter for separat-ing base flow from streamflow time series, Water Resour. Res., 37(11), 2709–2722, 2001.
Hewlett, J. D. and Hibbert, A. R.: Factors affecting the response of small watersheds to precipitation in humid areas, in: Forest Hydrology, edited by: Sopper, W. E. and Lull, H. W., Pergamon Press, 275-290, 1967.
Horton, R. E.: The role of infiltration in the hydrologic cycle, Trans. Am. Geophys. Union, 14, 446–460, 1933.
Isham, V., Cox, D. R., Rodr´ıguez-Iturbe, I., Porporato, A., and Man-freda, S.: Mathematical characterization of the space-time vari-ability of soil moisture, P. Roy. Soc. A.-Math. Phy., 461(2064), 4035–4055, 2005.
Laio, F., Porporato, A., Fernandez-Illescas, C. P., and Rodr´ıguez-Iturbe, I.: Plants in water-controlled ecosystems: Active role in hydrologic processes and response to water stress, IV: Discus-sion of real cases, Adv. Water Resour., 24, 745–762, 2001. Liang, X., Lettenmaier, D. P., Wood, E. F., and Burges, S. J.: A
simple hydrologically based model of land surface water and en-ergy fluxes for GCMs, J. Geophys. Res., 99(D7), 14 415-14 428, 1994.
Manfreda, S. and Fiorentino, M.: A stochastic approach for the de-scription of the water balance dynamics in a river basin, Hydrol. Earth Syst. Sci., 12, 1189–1200, 2008,
http://www.hydrol-earth-syst-sci.net/12/1189/2008/.
Manfreda, S., Giordano, C., Iacobellis, V.: Stima dei Deflussi di Base mediante un Filtro Fisicamente Basato, Proocidings of “Giornata di Studio: Metodi Statistici e Matematici per l’Analisi delle Serie Idrologiche” edited by: Piccolo, D. and Ubertini, L., ISBN: 88-88885-00-5, 247-258, 2003 (in Italian).
Manfreda, S. and Rodr´ıguez-Iturbe, I.: On the Spatial and Tempo-ral Sampling of Soil Moisture Fields, Water Resour. Res., 42, W05409, doi:10.1029/2005WR004548, 2006.
Moore, R. J. and Clarke, R. T.: A distribution function approach to rainfall runoff modelling, Water Resour. Res., 17, 1367–1382, 1981.
pro-duction at point and basin scales, Hydrol. Sci., 30, 273–297, 1985.
Moore, R. J.:Real-time flood forecasting system: perspectives and prospects, in: Flood and landslides: Integrated risk assessment, edited by: Casal, R. and Margottini C., Springer, 147–189, 1999. Pan, F., Peters-Lidard, C. D., and Sale, M. J.: An analytical method for predicting surface soil moisture from rainfall observations, Water Resour. Res., 39(11), 1314, doi:10.1029/2003WR002142, 2003.
Porporato, A., Daly, E., and Rodr´ıguez-Iturbe, I.: Soil water balance and ecosystem response to climate change, Am. Nat., 164(5), 625–633, 2004.
Rodr´ıguez-Iturbe, I., Porporato, A., Ridolfi, L., Isham, V., and Cox, D. R.: Probabilistic modelling of water balance at a point: The role of climate, soil and vegetation, P. Roy. Soc. A.-Math. Phy., 455, 3789–3805, 1999.
Todini, E.: The ARNO rainfall-runoff model, J. Hydrol., 175,
339-382, 1996.
Wood, E. F., Lettenmaier, D. P., Liang, X., Nijssen, B., and Wetzel, S. W.: Hydrological modeling of continental-scale basins, Annu. Rev. Earth Pl. Sc., 25, 279-300, 1997.
Wood, E. F., Lettenmaier, D. P., and Zartarian, V. G.: A land-surface hydrology parametrization with subgrid varibility for general cir-culation models, J. Geophys. Res., 97, 2717–2728, 1992. Zhao, R. J. and Wang, P. L.: Parameter determination of Xinanjiang
model, Hydrology, 6, 2–9, 1988 (in Chinese).
Zhao, R.-J., Zhang, Y. L., and Fang, L. R.: The Xinanjiang model, Hydrological Forecasting Proceedings Oxford Sympo-sium, IAHS Pub. 129, 351–356, 1980.
Zhao, R.-J.: The Xinanjiang model applied in China, J. Hydrol., 135, 371–381, 1992.