Injection of CO2is a method that may increase the recovery
of oil from Danish chalk reservoirs in the North Sea. The method is used elsewhere, particularly in North America, but has so far not been used in the North Sea and has nowhere been used for chalk reservoirs, and the performance of the method when used for North Sea chalk is therefore uncer-tain. A laboratory flooding experiment was conducted at the Geological Survey of Denmark and Greenland on a sample from the Nana-1X well of the Halfdan oil field in the Danish North Sea in order to test the efficiency of CO2-enriched
water to produce additional oil from chalk. The sample is a low-permeability chalk from the Ekofisk Formation and rep-resents rocks that are marginal to the Halfdan reservoir in an economical sense.
Outline of the experiment
For the flooding experiment, four 1.5 inch core plug samples were assembled to form a composite sample with a total length of 28 cm and a pore volume of 92 ml. The flooding experiment was conducted at a fluid pressure of 282 bars, a hydrostatic confining pressure of 429 bars, and a temperature of 85°C. These are conditions similar to those of the Halfdan
reservoir. First the oil content, So, of the sample was adjusted
to 77.7% of the pore volume (PV), the remaining pore fluid being simulated formation water. The sample was then brought to reservoir conditions, aged for three weeks to restore the wettability to reservoir conditions and then flood -ed with simulat-ed formation water until oil production from the sample had ceased. After changing the flooding fluid to CO2-enriched water, flooding was resumed and sustained
until oil production had declined to a negligible level. Flood -ing was then stopped, the rig was cooled and depressurised, and the sample was dismounted. Both flooding operations were conducted with the sample in a vertical position from the bottom towards the top. A thorough description of the experiment is given in Olsen (2007).
Experimental set-up
The experiment was conducted in a rig that simulates reser-voir conditions. The rig consists of a Hassler-type core holder, a number of pressure cylinders for the experimental fluids, an acoustic separator for quantifying the fluid produc-tion, a differential pressure transducer for permeability mea-surement, and a high-pressure pump system for generating confining pressure, flow and pore fluid pressure. The core holder, pressure cylinders, separator, and differential pressure transducer are all situated inside a thermostatically controlled oven (Fig. 1).
Temperature and fluid pressure conditions were based on data from the adjacent Dan field reservoir, and corrected for the 250 m depth difference between the two reservoirs, Half -dan being the deeper. The temperature was corrected using a temperature gradient of 0.04°C/m. Assuming pressure corre-spondence between the two reservoirs, the Halfdan fluid pressure was estimated by extrapolation from the Dan field using a pressure gradient of 0.075 bar/m. Temperature, pres-sure and gradient values are from Jørgensen (1992). The oil used in the experiment was degassed crude oil from the Dan field. The water composition was similar to that of formation water from the Halfdan field. Fluid densities were measured at GEUS, while the water viscosity at reservoir conditions was estimated from data on the viscosity of similar brines. During the experiment differential pressure across the sam-ple, pore fluid pressure, hydrostatic confining pressure, flow
Increased oil recovery from Halfdan chalk by flooding
with CO
2
-enriched water: a laboratory experiment
Dan Olsen
© GEUS, 2009. Geological Survey of Denmark and Greenland Bulletin 17, 17–20. Available at: www.geus.dk/publications/bull 17
rate, cumulative injected fluid volume, produced oil volume and temperature were continuously logged. Before and after the flooding experiment the sample was characterised by measuring a number of parameters (Table 1).
Water flooding
The water flooding took place with a constant flooding rate of 0.62 ml/h and lasted 33 days with a total water injection of 490 ml or 5.35 times the pore volume. Results of the water flooding are presented in Fig. 2. Water breakthrough oc -curred after 77 hours when the water throughput was 0.458 times the pore volume. Before breakthrough, oil was pro-duced from the sample at the same rate as the water was being injected. After breakthrough, the rate of oil production drop -ped sharply and continuously. A low oil production rate was sustained for a considerable time, but stopped completely before the flooding was terminated. A total oil volume of 0.053 times the pore volume was produced after break-through. Total oil production during the water flooding was
0.496 times the pore volume or 63.8% of the oil originally present in the sample.
A model was developed that fits the oil production (Fig. 2). Before breakthrough, the oil production shows a linear relationship with the injected water volume. After break-through, the oil production shows an exponentially decreas-ing relationship. Both relationships show a nearly perfect fit to the actual oil production.
Measurements of differential pressure across the sample were used to calculate the water permeability during the water flooding (Fig. 2). At the end of the water flooding the differential pressure had stabilised, indicating that fluid movement within the sample had stopped. Both the oil pro-duction and permeability curves show typical water-flooding development.
Flooding with CO
2-enriched water
The flooding with CO2-enriched water was carried out at the
same rate as the water flooding, i.e. at 0.62 ml/h. It lasted 64 days, and the total throughput of CO2-enriched water was
949 ml or 10.4 times the pore volume. The CO2-enriched
water had a CO2-content of 26.6 standard m3CO2/standard
m3 water corresponding to a CO
2-saturation of 100% at
85°C and 282 bars fluid pressure (Chang et al. 1998).
Diffusion of CO2between oil, CO2-enriched water and
water without CO2may cause the oil within the separator to
either swell or shrink as CO2 diffuses between the fluid
phases. Such volume changes are troublesome as they cannot be distinguished from oil being produced from the sample. In an attempt to establish equilibrium between separator oil and CO2-enriched water, an amount of CO2was added to the
separator before starting the CO2-enriched flooding and
allowed to equilibrate with the separator fluids for nine days. Using the data of Chang et al. (1998) the amount of CO
2was
adjusted so as to create the same CO2-saturation in the water
of the separator as in the brine used for flooding.
Figure 3 presents a plot of oil produced during the CO2
-enriched flooding versus time. The oil production curve has
18
Table 1. Flooding experiment to enhance oil recovery: sample characterisation
Initial Final Change Percent
characterisation characterisation change
Dry weight (g) 613.37 609.05 –4.32 –0.70
Diameter (cm) 3.77 3.77 0.00 0.07
Length (cm) 28.32 28.24 –0.07 –0.26
Bulk volume (ml) 318.56 316.92 –1.64 –0.52
Porosity (% bulk volume) 28.77 29.09 0.32 1.10
Pore volume (ml) 91.64 92.18 0.53 0.58
Gas permeability (mD) 0.62 0.76 0.14 23
Produced oil Model of produced oil Permeability to water
Prod
u
ced oil (fra
ctio
n
o
f pore vol
um
e)
0 0.10 0.20 0.30 0.40 0.50
0 1 2 3 4 5
Injected water volume (fraction of pore volume)
0.000 0.010 0.020 0.030 0.040 0.050
Per
m
ea
bility
to
wa
ter (
m
illidarcy)
a peculiar shape with an initial negative slope, indicating that the volume of oil in the separator was reduced. As oil cannot flow from the separator, the negative slope indicates that the oil in the separator shrank in volume during the first part of the CO2-enriched flooding. After the section with negative
slope, the slope of the oil production curve changes to posi-tive and obtains the appearance of an ordinary oil production curve with oil apparently being produced at a low rate right until the end of flooding. After cessation of the flooding the rig was left undisturbed for 10.8 days, with the conditions of the rig being the same as during the CO2-enriched flooding,
except that the fluid delivery pump was stopped. During this time the separator continued to register an increase in oil vol-ume, at a rate that was indistinguishable from the rate during the final part of the CO2-enriched flooding (Fig. 3). As the
construction of the rig prevents oil from flowing to the sepa-rator when the delivery pump is stopped, the apparent oil production after flow-stop is considered to represent swelling of the oil within the separator. The situation appears similar to that at the beginning of the CO2-enriched flooding, only
that swelling takes place instead of shrinkage.
During flooding with CO2-enriched water it is expected
that no oil is produced from the sample before oil affected by the CO2has moved to the outlet end of the sample. It is
therefore reasonable to assume that the initial section of the oil production curve with negative slope represents the time before breakthrough of the CO2-enriched water and the first
produced oil. The section with negative slope then represents a period without oil production and should be horizontal. The section of the oil production curve after flow-stop should also be horizontal as no oil can be produced without flow. Using these arguments a swelling correction curve has
been constructed (Fig. 3). As oil shrinkage in the separator changed to oil swelling during the experiment, a section with neither shrinkage nor swelling is present in the middle part of the correction curve. This part of the curve indicates equilib-rium in the separator. The correction curve of Fig. 3 therefore consists of three linear segments indicating shrinkage, equi-librium and swelling. A true correction curve probably would have a gradually changing slope, but in the absence of more information, linear line segments have been used.
The data are interpreted as follows: At the start of flood-ing with CO2-enriched water, the pore space of the sample
contained 66 ml of CO2-free water while the fluids of the
separator were CO2-saturated. During the first week of the
flooding, the CO2-free water of the sample flowed to the
sep-arator and caused the oil of the sepsep-arator to shrink as CO2
diffused from oil to water. After breakthrough of CO2
-enriched water, the CO2content of the water in the
separa-tor gradually increased. After some time the direction of CO2
diffusion changed, causing the oil of the separator to swell, a condition that continued after the end of the flooding.
Figure 4 presents oil production curves for flooding with CO2enriched water with and without correction for swel l
-ing. Compared to the water flooding, the amount of oil pro-duced during flooding with CO2-enriched water was small.
Total oil production was 0.047 times the pore volume equiv-alent to 6.1% of the oil originally present in the sample, if swelling correction is applied, and 0.032 times the pore vol-ume or 4.2% of the oil originally present in the sample, if swelling correction is omitted. The swelling correction is con-sidered valid, and hence the corrected values are preferred.
19 0.1
0.2 0.4
0.3 0.5 0.6 0.7 0.8
10 20 30 40 50 60 70
0
Prod
u
ced oil (
m
l)
Flow rate
(
m
l/h
)
0
Time (days) 4
5
2 3
1
–1
–2
–3 0
Produced oil before swelling correction Swelling correction curve
Produced oil after swelling correction Flow rate
–0.01 0.01 0.02 0.03 0.04 0.05
0
Prod
u
ced oil (fractio
n
of pore vol
um
e)
–0.03 –0.02
0 1 2 3 4 5 6 7 8 9 10
0 0.01
Per
m
eability to water (
m
illidarcy)
0.02 0.03 0.04 0.05 0.06
Injected water volume (fraction of pore volume)
–0.02 –0.01 Produced oil before swelling correction Produced oil after swelling correction Model of produced oil
Permeability from inlet rate
Fig. 4. Produced oil volume (Np) versus injected fluid volume (Vinj) dur-ing flooddur-ing with CO2-enriched water compared to production curves with and without correction for swelling. Model before breakthrough: Np = 0. Model after breakthrough: Np= 0.05 – 0.08 × exp(–Vinjj/3.8). Fluid saturation (fraction of pore volume): water saturation before CO2flood = 0.719. Withswelling correction: water saturation after CO2flood = 0.767, oil production during CO2flood = 0.047. Withoutswelling cor-rection: water saturation after CO2flood = 0.752, oil production during CO2flood = 0.032.
A model has been developed that approximates the oil production profile (Fig. 4). The fit is reasonable, although inferior to the fit obtained for the water flooding (Fig. 2). The inferior fit is at least partly caused by the smaller volume changes compared to the water flooding, causing a greater relative experimental uncertainty.
Dissolution effects
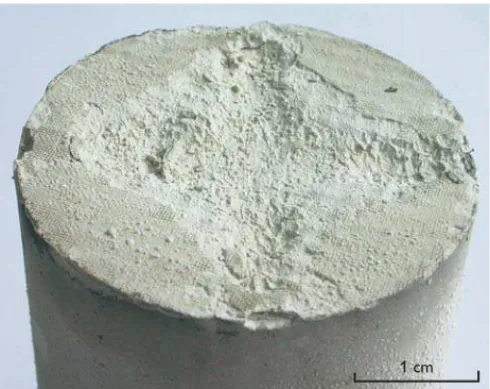
The bulk volume of the sample was reduced by 1.64 ml dur-ing the experiment (Table 1), equivalent to a grain volume loss of 1.17 ml. This is attributed to a distinct dissolution structure that was found at the inlet end face after the exper-iment (Fig. 5). The structure was due to dissolution of the chalk by the CO2-enriched water. Dissolution structures were
not visible on the other surfaces of the sample. Porosity of the sample increased by 0.32% of the bulk volume during the experiment (Table 1), which indicates that 1.01 ml of grain material were dissolved from the interior of the sample dur-ing the experiment. Combindur-ing the bulk volume loss and the porosity increase indicates a total dissolution of 2.18 ml of grain material, which is equivalent to the loss of 5.91 g of cal-cite. The measured weight loss was 4.32 g, which is consid-ered to agree within the experimental uncertainty (Table 1).
The gas permeability increased by 23% during the exper-iment (Table 1), which is remarkable compared to the mod-est increase in porosity. The increase in both porosity and
permeability was evenly distributed among the four subsam-ples, indicating a certain amount of dissolution throughout the sample (Olsen 2007). The evidence shows that dissolu-tion took place both close to where the CO2-enriched water
entered the sample and within the sample. A small length reduction (Table 1) occurred due to the formation of the dis-solution structure.
Conclusions
Water flooding of a low-permeable Ekofisk chalk sample from the Nana-1X well in the Danish North Sea resulted in an oil saturation of 28.0% of the pore volume with an oil recovery of 63.8% of the oil originally present in the sample. Flooding with CO2-enriched water corresponding to 10.4
times the pore volume increased the oil recovery by 6.1% of the oil originally present in the sample, resulting in a final oil saturation of 23.3% of the pore volume. Compared to the water flooding, the flooding with CO2-enriched water
increased the final oil recovery by 9.6%. A correction proce-dure was applied to correct for diffusion processes within the separator of the rig. At the inlet end of the sample a dissolu-tion structure was created by the CO2-enriched water. The
rest of the sample was visually unaffected by the flooding, but the injection resulted in a 1.1% increase in porosity and a 23% increase in gas permeability, which shows that some dis-solution took place within the pore space of the sample.
Acknowledgements
Financial support was received from the Ministry of Science, Technology and Innovation, and from the European Network of Excellence on Geological Storage of CO2that is co-funded by the European Com -mission within the 6th Framework Programme.
References
Chang, Y., Coats, B.K. & Nolen, J.S. 1998: A compositional model for CO2 floods including CO2solubility in water. SPE Reservoir Evaluation & Engineering 1, 155–160.
Jørgensen, L.N. 1992: Dan Field – Denmark, Central Graben, Danish North Sea. In: Foster, N.H. & Beaumont, E.A. (eds): Atlas of oil and gas fields. Structural traps VI, 199–218. Tulsa: American Association of Petroleum Geologists.
Olsen, D. 2007: Increased oil recovery from the Danish North Sea chalk fields. Flooding experiment OCD1. Danmarks og Grønlands Geolo -giske Undersøgelse Rapport 2007/30, 20 pp.
.
20
Author’s address
Geological Survey of Denmark and Greenland (GEUS), Øster Voldgade 10, DK-1350 Copenhagen K, Denmark. E-mail:[email protected]
1 cm