LUCAS DE CARVALHO GOMES
SOIL CO2 EFFLUX IN AGROFORESTRY AND FULL-SUN COFFEE SYSTEMS
Dissertação apresentada à Universidade Federal de Viçosa, como parte das exigências do Programa de Pós-Graduação em Solos e Nutrição de Plantas, para obtenção do título de
Magister Scientiae.
VIÇOSA
ii
Dedico esta dissertação aos meus pais JOÃO CARVALHO e
AGRADECIMENTOS
À Deus pela vida e por ter iluminado o meu caminho.
À Universidade Federal de Viçosa e ao Departamento de Solos, pela oportunidade de realizar este estudo.
À Coordenação de Aperfeiçoamento de Pessoal de Nível Superior (CAPES) pela concessão da bolsa de estudos e à Embrapa Café pelo apoio financeiro a parte do projeto. À professora Irene Maria Cardoso pela confiança e orientação desde o início da minha graduação até a conclusão deste estudo.
Aos professores Teógenes Senna de Oliveira, Eduardo de Sá Mendonça, Raphel Bragança Alves Fernandes e Anôr Fiorini de Carvalho pelas valiosas sugestões ao trabalho.
Aos agricultores (as) familiares em Araponga (Paulinho e Fia; Romualdo e Avanir) e em Divino (Gilberto e Luciana) pela oportunidade de realizar o estudo em suas propriedades, pelo apoio durante a coleta dos dados e pela troca de experiências.
Aos meus familiares e especialmente aos meus pais João e Taelma e as minhas irmãs Andréia, Alessandra e Luciane que sempre me incentivaram a estudar e seguir em frente. À minha esposa Olesia pelo amor e paciência durante esta caminhada.
Aos amigos do departamento de solos: Aridiano Lima, Renato Taques, Léo e Camila, Vanessa, Caio pela amizade e troca de saberes.
Aos meus caros amigos da República 1611 e da República na Cidade pelos bons momentos de convivência e de descontração.
Meus sinceros agradecimentos a todos que de algum modo contribuíram para a realização deste trabalho.
Muito Obrigado!
SUMÁRIO
RESUMO ... vi
ABSTRACT ... viii
GENERAL INTRODUCTION ... 1
CHAPTER 1. THE MAIN FACTORS THAT CONTROL SOIL CO2 EFFLUX ... 3
1. INTRODUCTION ... 3
2. SOIL BIOLOGY ... 5
3. SOIL PHYSICAL ... 8
4. SOIL TEMPERATURE AND MOISTURE ... 9
5. VEGETATION ... 10
6. CONSIDERATIONS ... 11
7. REFERENCES ... 11
CHAPTER 2. TREES MODIFY THE DYNAMICS OF SOIL CO2 EFFLUX IN COFFEE AGROFORESTRY SYSTEMS ... 14
1. INTRODUCTION ... 15
2. MATERIAL AND METHODS ... 17
2.1. Study areas ... 17
2.2. Study design ... 18
2.3. Soil sampling and analysis ... 19
2.4. Canopy cover ... 20
2.5. Air and soil microclimate ... 21
2.6. Soil CO2 efflux and soil temperature sensitivity ... 21
2.7. Statistical analysis ... 22
3. RESULTS ... 23
3.1. Chemical and physical soil characteristics... 23
3.2. Canopy cover ... 25
3.3. Air and soil temperature and humidity ... 26
3.4. Soil CO2 efflux ... 28
3.5. Soil temperature sensitivity and R25 ... 28
3.6. Canopy cover versus climatic conditions and soil CO2 efflux ... 30
3.7. Multivariate analysis of soil CO2 efflux ... 33
4.1. Influence of canopy’s trees on soil and air variables ... 35
4.2. Soil CO2 efflux ... 37
4.3. Soil temperature sensitivity and R25 ... 39
4.4. Multivariate analysis of Soil CO2 efflux ... 40
4.5. Trees and the carbon cycle ... 41
5. CONCLUSIONS ... 42
6. REFERENCES ... 43
RESUMO
GOMES, Lucas de Carvalho, M.Sc., Universidade Federal de Viçosa, outubro de 2014.
Efluxo de CO2 do solo em áreas cultivadas com café sob manejo agroflorestal e a
pleno sol. Orientadora: Irene Maria Cardoso. Coorientadores: Eduardo de Sá Mendonça e Raphael Bragança Alves Fernandes.
de CO2 do solo entre os sistemas agroflorestais e a pleno sol, mas contribuiu para que a dinâmica das emissões diárias fosse diferente entre os sistemas. No sistema agroflorestal o efluxo de CO2 do solo foi mais estável durante o dia com menor variação entre o período de 08:00-10:00h e 12:00-14:00h e maior variação espacial do que no sistema a pleno sol. No sistema agroflorestal o efluxo de CO2 foi explicado principalmente por variações na quantidade de nitrogênio total e carbono lábil e no sistema a pleno solo pela temperatura do solo, especialmente a 10 cm de profundidade. A análise de componetes principais mostrou que em geral o efluxo de CO2 do solo correlacionou positivamente com a temperatura do solo a 5 e 10 cm de profundidade e negativamente com a umidade do solo. Em conclusão, as árvores em sistemas agroflorestais de café trouxeram maior estabilidade para o microclima e para o efluxo de CO2 do solo comparado com sistemas a pleno sol.
ABSTRACT
GOMES, Lucas de Carvalho, M.Sc., Universidade Federal de Viçosa, October, 2014. Soil
CO2 Efflux in Agroforestry and Full-Sun Coffee Systems. Adviser: Irene Maria
Cardoso. Co-Advisers: Eduardo de Sá Mendonça and Raphael Bragança Alves Fernandes.
GENERAL INTRODUCTION
The greenhouse gases emissions by human activities, especially carbon
dioxide (CO2), has been identified as the cause of global climate change (Field et al., 2014). These emissions increased considerably during the past four decades, as a
result mainly from burning of fossil fuels and the conversion of tropical forests for use in
agricultural production (Rogner et al., 2007). The burning of fossil fuels is the main
source of CO2 emission in the developed countries, whereas, in Brazil, more than half of the total CO2 emission is derived from agricultural practices and deforestation (BRASIL, 2013). Most of CO2 emission due to agricultural activities is derived from soil.
Nonetheless, our understanding about the release of CO2 from soil is very limited, because many factors can differently influence this process in each ecosystem. In soil
the production and diffusion of CO2 result of a combination of abiotic and biotic soil processes such as, gas diffusion, roots and organisms respiration (Berisso et al., 2013;
Hanson et al., 2000) and soil characteristics such as, temperature, moisture, texture and
aggregation (Blagodatsky and Smith, 2012; Lloyd and Taylor, 1994; Wu et al.,
2010). Therefore, it is necessary to adopt crop management, such as agroforestry systems,
that increases carbon in the soil, the largest carbon reservoir in terrestrial biosphere
(2500 GtC), and contribute to reduce the concentration of CO2 in atmosphere. Agroforestry systems sequester carbon in plant biomass and increase the residue of
organic matter in the soil (Duarte, 2007) which is responsible to improve the physical and
chemical quality of soils. Moreover, the canopy cover from trees protect soil against
directly solar radiation (Carvalho, 2011), which can significantly influence the soil CO2 efflux to atmosphere.
The objective of this study aimed to understand how the canopy of the trees in
process. In Chapter 1, we reviewed how the main biotic and abiotic factors control soil
CO2 efflux and the importance of vegetation on this process. In Chapter 2 our specific objectives were to (i) evaluate how trees influence air and soil microclimate (soil
CHAPTER 1. THE MAIN FACTORS THAT CONTROL SOIL CO2 EFFLUX
1. INTRODUCTION
From 2012 to 2013, the atmospheric Carbon Dioxide (CO2) increased 2.9 ppm, the biggest increase since 1984 (WMO, 2014). The increase in the CO2 emission was due
to human activities and primarily from fossil fuel and land use change. These two source
of emissions have been identified as the cause of global climate change (Field et al.,
2014). To mitigate the problem of climate change, there is a global effort to reduce CO2
emissions and develop technologies to remove part of this gas from the atmosphere.
To reduce CO2 emissions worldwide it is necessary to reduce deforestation, to use
biofuels instead fossil fuels, etc. Commercial technologies are available to remove CO2 from atmosphere (Schuiling and de Boer, 2013), but the most simple and natural way to
remove CO2 from atmosphere is carried out by plants through photosynthesis. This process removes carbon from atmosphere creating vegetal biomass, which later will be
deposited in the soil.
Soil is the biggest reservoir of carbon (2500 GtC; 1 GtC = 1 billion metric tons of
carbon) in the terrestrial biosphere. The carbon in the soil is the result of the balance
between the input of vegetal biomass and the output of carbon, especially as CO2. Therefore, the soil, in the Global Carbon Cycle, acts either as source or as a sink of carbon
from the atmosphere. The source of CO2 released from soil (also called soil CO2 efflux)
is mainly from roots and microbial respiration, which has been estimated at 75 GtC year -1, much higher than the amount of 6 GtC year-1 by burning fossil fuels (Schlesinger and
Andrews, 2000). Soil temperature and moisture conditions, the main drivers of soil CO2 efflux (Lloyd and Taylor, 1994; Wu et al., 2010) affect the production of CO2, because they have great influence on roots respiration and microbial activity. The vegetation type,
it affects soil temperature and moisture. Nonetheless, our understanding about the soil
respiration is very limited, because many factors can differently influence this process in
each ecosystem.
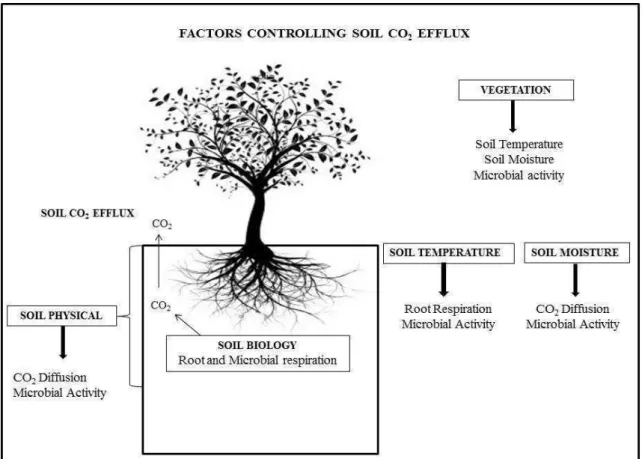
The soil CO2 efflux is the result of combination between production (mainly respiration) and diffusion of this gas to soil surface. Thus, soil characteristics that
influence these process, will also affect the rates of soil CO2 efflux (Figure 1). The
diffusion of CO2 to soil surface is affect by soil physical characteristics, such as aggregation and porosity, that influence the gas diffusivity and also by soil moisture that
fill the soil pore space.
Therefore, it is not enough to know just the C that particular plant species can
deposit in the soil, but also how the vegetation influences the soil CO2 efflux. The balance
of C in the soil, result of deposition of plant biomass and the soil CO2 efflux, depends on the land use management. For instance, agroforestry coffee systems, when compared to
the full-sun coffee cultivation, enhances the deposition of plant biomass, due to the trees
intercropped with coffee, and the C content stored in the soil (Duarte, 2007; Hergoualc’h
et al., 2012). The agroforestry also protects the soil against solar radiation, what may
modify the soil biological and microclimates characteristics, especially temperature and
Figure 1: Vegetation, soil physical and environmental variables affecting the production
(by Soil Biology) and the diffusion of CO2 to soil surface.
2. SOIL BIOLOGY
Soil respiration is the largest source of CO2 from terrestrial ecosystems to the atmosphere (Metcalfe et al., 2011) and almost 10% of the atmosphere’s CO2 passes through soils each year (Raich and Potter, 1995). The CO2 produced in soils is derived
from respiration by roots (autotrophic respiration) and by soil organisms (heterotrophic
respiration).
The autotrophic respiration is a combination of root activity and the activity of
microorganism in the rhizosphere. Studies demonstrated that autotrophic respiration
account for 45.8% in forest and 60% in non-forest vegetation from the total soil
respiration (Hanson et al., 2000). In general, the root contribution to soil respiration
ranges from 33-89% in forests, 17-40% in grasslands, 12-38% in croplands and 50-93%
The heterotrophic respiration is result from soil faunal activity (Edwards et al.,
1970). Fungi are the most active decomposers of plant residues in soils while bacteria
are the secondary despite their high number (Struwe and Kjøller, 1994). The direct
contribution of soil macrofauna to total soil respiration account for < 3% of total CO2 respired (Holt et al., 1990), but the macro and mesofauna can greatly increase soil
CO2 production (Ke et al., 2005; Lubbers et al., 2013) stimulating microbial activity,
probably through fragmentation of plant residues.
The distinguishing between autotrophic and heterotrophic respiration is important
to identify the source of CO2 and predict how the climatic variables will influence each component leading us to better understand the carbon cycle in soil. Wang et al. (2014)
carried out a meta-analysis from 202 soil respiration datasets from 50 different
ecosystems warming experiments and identified that a warming of 2 °C affect differently
the two components of soil respiration. The autotrophic respiration did not change
significantly, but the heterotrophic respiration increases 21% in average.
To identify the contribution of autotrophic and heterotrophic respiration to the
total soil respiration is not easy, because of the complexity of soil environment, but there
are some available methods. Hanson et al. (2000) reviewed the main methods to separate
the total soil respiration: (1) root exclusion, (2) integration of respiratory components
(e.g. litter and roots) and (3) isotope methods.
The root exclusion method estimates root contribution for total soil CO2 by measuring soil respiration with and without the presence of roots. The roots exclusion
techniques can be categorized into three areas: (1) root removal – the soil is removed and
the roots presents are collect, then the soil is placed back in reverse order of removal.
Further barriers are installed to prevent root growth. (2) Trenching – presents roots are
prevent future root growth, and (3) gap analysis – the vegetation above ground is removed
from relatively large areas (e.g. opening gaps in forests) and the soil CO2 efflux measurements in the gap are compared to CO2 data for a forested area (Hanson et al.,
2000).
The integration of respiratory components is done by separating from soil the
components that contribute to soil CO2 efflux (i.e. roots, sieved soil, and litter) followed
by measurements of the specific rates of CO2 efflux from each component. Then, rates of CO2 efflux from all component parts are multiplied by their respective masses and
summed to obtain an integrated total soil CO2 rate. The potential limitation of this approach is that root specific respiration rates are measured in vitro (Hanson et al., 2000).
The isotope methods allow partitioning total soil CO2 efflux between root
respiration and soil organic matter decomposition in situ, which is an advantage to root
exclusion and integration of respiratory components methods. The disadvantage of
isotope methods is the complexity of experimental setup and cost of analytical
measurements for radioactive or stable C isotopes. Isotopes methods can be broadly
classified as: (1) pulse labelling, (2) repeated pulse labelling, and (3) continuous labelling.
Pulse labelling is the addition of 14C- or 13C-labelled CO2 to small plants in closed laboratory chambers, for the purpose of quantifies the distribution of labelled C within a
plant and the amount of labelled carbon respired above and belowground plant parts
during a determined period of time. Repeated pulse labelling is a variant of pulse labelling
where isotopically labelled CO2 is added to plants at different times during the growing
season. Continuous labelling is carried out by the assimilation of uniquely labelled carbon
by plants under laboratory (chamber) or field conditions over periods that are comparable
3. SOIL PHYSICAL
Soil physical characteristics, especially soil density, aggregation and porosity,
strongly influence soil CO2 efflux in well-drained soils, such as Oxisols, the most
common soil in Brazil. These characteristics influence the physical conditions for roots
and microorganisms activity and also for diffusion of CO2 to soil surface and can be considered passive in the process of soil CO2 efflux because they not vary in short space
of time.
The increase in soil bulk density due to soil compaction reduces air permeability,
effective pore diameter, gas diffusivity, number of effective pores per unit area, and
increase tortuosity in vertical and horizontal directions. All these consequences reduce
the soils capacity to conduct gases (Berisso et al., 2013). An increase in soil bulk density
also decreases microbial activity (Torbert and Wood, 1992).
The soil texture establishes the conditions of aeration that affect the diffusion of
CO2 to soil surface, because the gas diffusivity depends on the soil particle size. Soil texture also affects the concentration of oxygen influencing the soil microbial activity. C
mineralization was higher in silt loam soils compared with clay loam soils. The clay
particle may protect the soil organic matter (Harrison-Kirk et al., 2013). However, in
Oxisols, the structure is more important than texture for soil aeration. Structure depends
on the soil aggregation, which affects strongly the gas transport in soils (Horn and
Smucker, 2005).
The soil aggregation, product of combination of soil particles, plant and microbial
residue, humic materials or polysaccharide polymers, is important for the accessibility of
soil organic matter by microorganisms. The soil aggregation influences the
decomposition rate of organic matter in the soil (Jastrow et al., 2007), consequently the
against decomposition more than do macroaggregates (> 250 mm diameter) (Denef et al.,
2001). Soil CO2 efflux was significantly affected by increasing the concentration of C and nitrogen (N) within macroaggregates, but was not influenced by the concentration of
C and N in the microaggregates (Lenka and Lal, 2013). Soil with aggregates of 0–2 mm
diameter in the subsurface showed lower emission of CO2 than soil with aggregates > 2 mm (Kimura et al., 2012), probably because of less access of organic matter by
microorganism.
4. SOIL TEMPERATURE AND MOISTURE
Soil temperature and moisture are active drivers of soil CO2 efflux in different ecosystems (Fenn et al., 2010; Guntiñas et al., 2013; Kim et al., 2010; Lloyd and Taylor,
1994; Wu et al., 2010), because they influence directly soil biology activity and the
diffusion of gases in soils.
Soil temperature affects the production of CO2 in soils influencing the rates of
roots respiration and microbial activity. The rapidly increasing in soil temperature
increases roots respiration (Atkin et al., 2000) and microorganism metabolic activity,
which reduces carbon use efficiency (Schindlbacher et al., 2011).
Soil moisture affects the production and also the diffusion of CO2 to soil surface. Soil moisture influences the production of CO2 in soil because it is the main driver of
microbial activity in many ecosystems(Liu et al., 2009), ensuring adequate water supply
for microbes. Excessive soil moisture affect the gas exchange in soil because fill the pore
space, lowering the oxygen available for development of aerobic microorganisms
5. VEGETATION
The vegetation type and agricultural practices may be the main factors that control
the rates of soil respiration, since they control the abiotic and biotic factors that are
important for the production and diffusion of CO2 to soil surface. They influence the soil microclimate (soil temperature and moisture), the soil physical characteristics and the
quantity and quality of biomass deposited on the soil.
The effects of vegetation on the important factors to soil CO2 efflux will differ according to the vegetation types. Soil respiration rates were approximately 20% higher
in grassland than in forest growing under similar conditions, suggesting that forest
conversion to grassland would stimulate soil CO2 emission to the atmosphere (Raich and Tufekcioglu, 2000). In grassland the soil temperature was higher than in soil under forest,
since the grass does not intercept the solar radiation as the trees.
The management practices of the vegetation in agroecosystems interfere in soil
characteristics and may have great impact on soil CO2 efflux. The agroforestry coffee systems are widely used in Central and South America (Bacon, 2005), except in Brazil.
However, to overcome problems of land degradation, in the Zona da Mata of Minas
Gerais state, Brazil, a group of coffee growers implanted in 1993 experiments with
agroforestry coffee systems in cooperation with local Non-Governmental Organizations
and researches (Cardoso et al., 2001). Later, the results indicated improvement of soil
quality (Souza et al., 2010). The canopy of the trees decreased 5.4 °C the mean daily
maximum temperature in the agroforestry systems (Souza et al., 2012) and reduced the
rates of moisture loss from soil surface (Carvalho, 2011) compared to full-sun coffee
systems. Therefore, it is expected that agroforestry systems may change the dynamics of
soil CO2 efflux compared with management of full-sun coffee.
6. CONSIDERATIONS
The soil CO2 efflux is a complex process that depends on the soil biological and physical characteristics and especially on the soil temperature and moisture conditions.
However, the land use and vegetation type may be the main components to control the
soil CO2 efflux in agroecosystems, since they influence the soil biological and physical characteristics and control the soil temperature and moisture.
7. REFERENCES
Atkin, O.K., Edwards, E.J. and Loveys, B.R., 2000. Response of root respiration to changes in temperature and its relevance to global warming. New Phytologist, 147(1): 141-154.
Bacon, C., 2005. Confronting the Coffee Crisis: Can Fair Trade, Organic, and Specialty Coffees Reduce Small-Scale Farmer Vulnerability in Northern Nicaragua? World Development, 33(3): 497-511.
Berisso, F.E. et al., 2013. Gas transport and subsoil pore characteristics: Anisotropy and long-term effects of compaction. Geoderma, 195-196: 184-191.
Blagodatsky, S. and Smith, P., 2012. Soil physics meets soil biology: Towards better mechanistic prediction of greenhouse gas emissions from soil. Soil Biology and Biochemistry, 47(0): 78-92.
BRASIL, 2013. Estimativas anuais de emissões de gases de efeito estufa no Brasil, Ministério da Ciência, Tecnologia e Inovação – MCTI, Brasília.
Cardoso, I.M., Guijt, I., Franco, F.S., Carvalho, A.F. and Ferreira Neto, P.S., 2001. Continual learning for agroforestry system design: university, NGO and farmer partnership in Minas Gerais, Brazil. Agricultural Systems, 69(3): 235-257. Carvalho, A.F., 2011. Água e radiação em sistemas agroflorestais com café, no território
da Serra do Brigadeiro - MG, Departamento de Solos e Nutrição de Plantas. Universidade Federal de Viçosa, 116 pp.
Denef, K., Six, J., Paustian, K. and Merckx, R., 2001. Importance of macroaggregate dynamics in controlling soil carbon stabilization: short-term effects of physical disturbance induced by dry–wet cycles. Soil Biology and Biochemistry, 33(15): 2145-2153.
Duarte, E.M.G., 2007. Ciclagem de nutrientes por árvores em sistemas agroflorestais na Mata Atântica, Departamento de Solos e Nutrição de Plantas. Universidade Federal de Viçosa, Viçosa-Minas Gerais, 115 pp.
Edwards, C.A., Reichle, D.E. and Crossley, D.A., Jr., 1970. The Role of Soil Invertebrates in Turnover of Organic Matter and Nutrients. In: D. Reichle (Editor), Analysis of Temperate Forest Ecosystems. Ecological Studies. Springer Berlin Heidelberg, pp. 147-172.
Fenn, K.M., Malhi, Y. and Morecroft, M.D., 2010. Soil CO2 efflux in a temperate deciduous forest: Environmental drivers and component contributions. Soil Biology and Biochemistry, 42(10): 1685-1693.
of the Intergovernmental Panel on Climate Change., Cambridge, United Kingdom and New York, NY, USA.
Guntiñas, M.E., Gil-Sotres, F., Leirós, M.C. and Trasar-Cepeda, C., 2013. Sensitivity of soil respiration to moisture and temperature. Journal of Soil Science and Plant Nutrition, 13(2): 445-461.
Hanson, P.J., Edwards, N.T., Garten, C.T. and Andrews, J.A., 2000. Separating root and soil microbial contributions to soil respiration: A review of methods and observations. Biogeochemistry, 48(1): 115-146.
Harrison-Kirk, T., Beare, M.H., Meenken, E.D. and Condron, L.M., 2013. Soil organic matter and texture affect responses to dry/wet cycles: Effects on carbon dioxide and nitrous oxide emissions. Soil Biology and Biochemistry, 57: 43-55.
Hergoualc’h, K., Blanchart, E., Skiba, U., Hénault, C. and Harmand, J.-M., 2012. Changes in carbon stock and greenhouse gas balance in a coffee (Coffea arabica) monoculture versus an agroforestry system with Inga densiflora, in Costa Rica. Agriculture, Ecosystems & Environment, 148: 102-110.
Holt, J., Hodgen, M. and Lamb, D., 1990. Soil respiration in the seasonally dry tropics near Townsville, North-Queensland. Soil Research, 28(5): 737-745.
Horn, R. and Smucker, A., 2005. Structure formation and its consequences for gas and water transport in unsaturated arable and forest soils. Soil and Tillage Research, 82(1): 5-14.
Jastrow, J.D., Amonette, J.E. and Bailey, V.L., 2007. Mechanisms controlling soil carbon turnover and their potential application for enhancing carbon sequestration. Climatic Change, 80(1-2): 5-23.
Ke, X., Winter, K. and Filser, J., 2005. Effects of soil mesofauna and farming management on decomposition of clover litter: a microcosm experiment. Soil Biology and Biochemistry, 37(4): 731-738.
Kim, D.-G., Mu, S., Kang, S. and Lee, D., 2010. Factors controlling soil CO2 effluxes and the effects of rewetting on effluxes in adjacent deciduous, coniferous, and mixed forests in Korea. Soil Biology and Biochemistry, 42(4): 576-585.
Kimura, S.D., Melling, L. and Goh, K.J., 2012. Influence of soil aggregate size on greenhouse gas emission and uptake rate from tropical peat soil in forest and different oil palm development years. Geoderma, 185-186: 1-5.
Lenka, N.K. and Lal, R., 2013. Soil aggregation and greenhouse gas flux after 15 years of wheat straw and fertilizer management in a no-till system. Soil and Tillage Research, 126: 78-89.
Liu, W., Zhang, Z.H.E. and Wan, S., 2009. Predominant role of water in regulating soil and microbial respiration and their responses to climate change in a semiarid grassland. Global Change Biology, 15(1): 184-195.
Lloyd, J. and Taylor, J., 1994. On the temperature dependence of soil respiration. Functional ecology: 315-323.
Lubbers, I.M. et al., 2013. Greenhouse-gas emissions from soils increased by earthworms. Nature Clim. Change, 3(3): 187-194.
Melling, L., Hatano, R. and Goh, K.J., 2005. Soil CO2 flux from three ecosystems in tropical peatland of Sarawak, Malaysia. Tellus B, 57(1): 1-11.
Melling, L., Tan, C.S.Y., Goh, K.J. and Hatano, R., 2013. Soil microbial and root respirations from three ecosystems in tropical peatland of sarawak, Malasia. Journal of Oil Palm Research, 25(1): 44-57.
Raich, J. and Tufekcioglu, A., 2000. Vegetation and soil respiration: Correlations and controls. Biogeochemistry, 48(1): 71-90.
Raich, J.W. and Potter, C.S., 1995. Global patterns of carbon dioxide emission from soils Global Biogeochemical Cycles, 9(1): 23-36.
Rogner, H., Zhou, D., Bradley, R., Crabbé, P., Edenhofer, O., Hare, B., Kuijpers, L and Yamaguchi, M. 2007. Introduction: in climate change 2007. Mitigation: Contribution of Working Group III to the Fourth Assessment Report of the Intergovernmental Panel on Climate Change [B. Metz, O.R. Davidson, P.R. Bosch, R. Dave, L.A. Meyer (eds)], Cambridge University Press, Cambridge, United Kingdom and New York, NY, USA.
Schindlbacher, A. et al., 2011. Experimental warming effects on the microbial community of a temperate mountain forest soil. Soil Biol Biochem, 43(7): 1417-1425. Schlesinger, W. and Andrews, J., 2000. Soil respiration and the global carbon cycle.
Biogeochemistry, 48(1): 7-20.
Schuiling, R.D. and de Boer, P.L., 2013. Six commercially viable ways to remove CO2 from the atmosphere and or reduce CO2 emissions, Environmental Sciences Europe, pp. 25:35.
Souza, H. et al., 2010. Selection of native trees for intercropping with coffee in the Atlantic Rainforest biome. Agroforestry Systems, 80(1): 1-16.
Souza, H.N.d. et al., 2012. Protective shade, tree diversity and soil properties in coffee agroforestry systems in the Atlantic Rainforest biome. Agriculture, Ecosystems & Environment, 146(1): 179-196.
Struwe, S. and Kjøller, A., 1994. Potential for N2O production from beech (Fagus silvaticus) forest soils with varying pH. Soil Biology and Biochemistry, 26(8): 1003-1009.
Torbert, H. and Wood, C., 1992. Effects of soil compaction and water‐filled pore space on soil microbial activity and N losses. Communications in Soil Science & Plant Analysis, 23(11-12): 1321-1331.
Wang, X. et al., 2014. Soil respiration under climate warming: differential response of heterotrophic and autotrophic respiration. Global Change Biology, 20(10): 3229-3237.
WMO (World Metereological Organization), 2014. The State of Greenhouse Gases in the Atmosphere Based on Global Observations through 2013, Geneva, Switzerland. Wu, X. et al., 2010. Effects of soil moisture and temperature on CO2 and CH4 soil–
CHAPTER 2. TREES MODIFY THE DYNAMICS OF SOIL CO2 EFFLUX IN
COFFEE AGROFORESTRY SYSTEMS
Highlights
Soil CO2 efflux dynamics were analysed in two coffee cultivation management systems
Tree canopy in the Agroforestry System (AF) reduced soil temperature and increased soil moisture
Daytime soil CO2 efflux was more stable in AF system than in Full-Sun (FS) system
Soil temperature is the main factor regulating soil CO2 efflux in the FS system
ABSTRACT
Agroforestry systems (AF) can help significantly reduce atmospheric carbon levels over
the next years through photosynthesis and regulation of soil CO2 efflux. The objective was to characterise the soil CO2 efflux dynamics of coffee plants cultivated under AF and
Full-Sun (FS) systems and identify the factors that regulate this process. The study was
carried out in AF and FS systems, in three family farms (identified as RO, PA, and GI),
Minas Gerais, the Atlantic Forest Biome, Brazil. Twenty 1-m2 sampling points (ten in AF and 10 in FS), each separated by a distance of 5 × 5 m, located between coffee plant rows
on each farm were selected.Soil physical and chemical attributes, soil temperature, air
temperature and soil moisture, the percentage of canopy cover, and soil CO2 efflux were measured at each sampling point under the two systems. Tree canopy in the AF systems
reduced air and soil temperature and increase soil moisture. The average daily soil CO2 efflux values did not differ in the two systems, but different daily emission dynamics were
observed. Daytime soil CO2 efflux was more stable (i.e. from morning to midday) in the
AF system (increasing in average 15%) compared to the FS system (increasing 49.1%).
by soil temperature variation at 10 cm depth in the FS system. In general, the principal
components analysis shows that soil CO2 efflux was positively correlated with soil temperature at 5 and 10 cm depths and negatively correlated with soil moisture. In
conclusion, AF systems promoted stability to microclimate and soil CO2 efflux and enhances the capture of CO2 through photosynthesis compared to FS systems.
Keywords: soil carbon, soil respiration, tree canopy, field experiment, Atlantic
Rainforest Biome
1. INTRODUCTION
Greenhouse gas emissions resulting from human activities, especially carbon
dioxide (CO2), have been identified as the cause of global climate change (Field et al., 2014). Over the last four decades, greenhouse gas emissions into the atmosphere have
increased considerably, primarily due to the burning of fossil fuels, cement production,
and the conversion of tropical forests into agricultural land (Rogner et al., 2007). From
2002 to 2011, on average, the global CO2 emissions from the burning of fossil fuels and
cement production was 8.3 GtC year-1 and due to changes in land use management was 0.9 GtC year-1 (Stocker et al., 2013). The land use management (agricultural practices
and deforestation) in Brazil, from 1990 to 2010, was the main source of CO2, which account for about 57% of CO2 emissions (716.389 GgCO2/year) (BRASIL, 2013).
Most CO2 emissions due to agricultural activity originates from the soil, which is
the largest C reservoir (2500 GtC) in the terrestrial biosphere. The production and
diffusion of CO2 in the soil originate from several biotic soil processes such as, roots and
organisms respiration (Berisso et al., 2013; Hanson et al., 2000) that are related to soil
characteristics such as, temperature, moisture, texture and aggregation (Blagodatsky and
Soil temperature and soil moisture are the main factors involved in the regulation
of soil CO2 efflux (Wu et al., 2010). An increase in soil temperature causes an increase in soil CO2 efflux because of changes in roots respiration and the decomposition rates of
organic matter (Peng et al., 2009). Soil moisture is the main driver of soil microbiotic
activity (Liu et al., 2009) and interferes with gas diffusion in the soil because water
replaces the air in the soil pore space (Melling et al., 2005). Texture and aggregation
interferes in the production process of CO2 and in its transport to soil surface (Harrison-Kirk et al., 2013; Lenka and Lal, 2013). Soil texture and aggregation affect soil porosity
and interferes in the process of gas diffusion and the accessibility of soil organic matter
to microbial decomposition (Jastrow et al., 2007).
Soil characteristics are influenced by soil management. For instance, the trees in
agroforestry (AF) systems sequester C in plant biomass and increase the amount of
organic matter residue present in the soil (Montagnini and Nair, 2004), which is important
for improving the physical and chemical quality of soils. The canopy cover of trees also
protects the soil against direct solar radiation (Breshears and Ludwig, 2010). Therefore,
AF systems may positively influence soil CO2 efflux to the atmosphere.
Understanding this efflux would provide support for the adoption of AF systems,
by quantifying the extent to which they help reduce CO2 levels in the atmosphere. At several locations worldwide, carbon stock analyses have shown that significant quantities
of carbon (1.1–2.2 PgC) could be removed from the atmosphere over the next 50 years,
if AF systems were globally implemented (Albrecht and Kandji, 2003). AF coffee
systems are widely used in Central and South America (Bacon, 2005).
However, Brazilian coffee plants are adapted to full-sun cultivation conditions. Full-sun
(FS) systems lose the benefits provided by trees, resulting in high soil temperatures and
Although the benefits of AFs are recognised worldwide, there are not so many in
situ investigation of soil CO2 efflux dynamics in AF coffee systems. To understand these dynamics, it is necessary to quantify soil CO2 efflux and identify the biotic and abiotic
factors that regulate this variation. By identifying the responsible factors, appropriate
strategies can be adopted to control and decrease atmospheric CO2 levels.
This study aimed to understand how the tree canopy affects the soil CO2 efflux in
AF coffee systems versus FS coffee systems and to identify which factors control this
process in each system. Our specific objectives were to (i) evaluate how trees influence
soil microclimate (soil temperature and moisture), (ii) quantify soil CO2 efflux, and (iii) identify the main abiotic factors that control soil CO2 efflux in AF and FS coffee systems.
2. MATERIAL AND METHODS
2.1. Study areas
This study was carried out in Zona da Mata of Minas Gerais State, Brazil, located
in the Atlantic Rainforest Brazilian biome, which is one of the five biodiversity hotspots in
the world (Myers et al., 2000). Three family farms were selected (referred to as RO, PA,
and GI), which were cultivate with coffee (Coffea arabica) under AF and FS systems. All
three farms used similar agroecological management practices, e.g. skimming of weeds,
no use of pesticides, cultivating maize among coffee rows leaving the straw in the field,
which contributes to keep the soil covered and to add organic matter to the soil. In PSPA the famer even chose a maize variety that produce more straw in order to have more
organic matter added to the soil. The soils in this region are generally acidic and present
low natural fertility, with organic matter input and nutrient cycling being required for
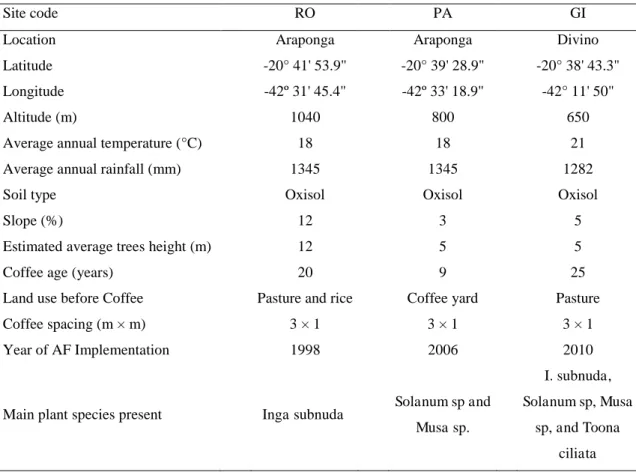
natural quality maintenance. Table 1 provides more information about the location,
Table 1: Location, environmental characteristics and historic of Agroforestry (AF) and
Full-sun (FS) coffee systems studied in three farms (RO, PA, GI), Minas Gerais, Brazil.
Site code RO PA GI
Location Araponga Araponga Divino
Latitude -20° 41' 53.9" -20° 39' 28.9" -20° 38' 43.3"
Longitude -42º 31' 45.4" -42º 33' 18.9" -42° 11' 50"
Altitude (m) 1040 800 650
Average annual temperature (°C) 18 18 21
Average annual rainfall (mm) 1345 1345 1282
Soil type Oxisol Oxisol Oxisol
Slope (%) 12 3 5
Estimated average trees height (m) 12 5 5
Coffee age (years) 20 9 25
Land use before Coffee Pasture and rice Coffee yard Pasture
Coffee spacing (m × m) 3 × 1 3 × 1 3 × 1
Year of AF Implementation 1998 2006 2010
Main plant species present Inga subnuda Solanum sp and Musa sp.
I. subnuda,
Solanum sp, Musa
sp, and Toona
ciliata
2.2. Study design
At each farm, we selected a coffee field of approximately 300 m2. In field, we selected 20 sampling points with 1-m2 each, which were located between the rows of
coffee plant. Among the 20 points, 10 points were located in the AF system and 10 points
in the FS system. The distance between sampling points was about 5 × 5 m. AF and FS
systems were considered treatments, whereas the 10 points in each treatment were
considered replicates. In total, 60 points were sampled across the three farms. For soil
CO2 efflux analyses, we placed a Poly Vinyl Chloride (PVC) ring (10 cm diameter and 7
cm height) on the soil at the centre of each sampling point. The rings were inserted 3 cm
deep into the soil, leaving 4 cm above the soil surface to avoid changes in soil
temperature, moisture, and radiation balance that affect the soil surface inside the ring.
installation. The rings were installed 24 hours before the evaluation of soil CO2 efflux,
which is the time required to recover soil CO2 equilibrium after the soil disturbance due to ring insertion (Heinemeyer et al., 2011).
2.3. Soil sampling and analysis
After three days of evaluation of soil CO2 efflux, disturbed soil samples from inside the PVC rings were collected from 0–10 cm soil depth at each sampling point.
Outside each PVC ring, three undisturbed soil samples were collected, using volumetric
rings that were approximately 5.3 cm in height and 4.8 cm in diameter. In total, we
collected 60 disturbed and 180 undisturbed soil samples from the three farms.
We analysed the total organic carbon (TOC) of the disturbed samples by the wet
oxidation of organic matter, using a potassium dichromate solution in acidic medium and
an external heat source (Yeomans and Bremner, 1988). Labile carbon (LC) was quantified
by oxidation with KMnO4 (33 mmol.L-1), as proposed by Blair et al. (1995) and modified
by Shang and Tiessen (1997). Total nitrogen (TN) was quantified by sulphuric acid
digestion (Bremner, 1996).
Soil bulk density (BD) was analysed by the volumetric ring method (EMBRAPA,
2011) using the undisturbed soil samples. Soil particle density (PD) was analysed by the
balloon volumetric method with ethanol as the liquid penetrant (EMBRAPA, 2011). Total
porosity (TP) was calculated from the relationship between BD and the particle
density (PD), according to equation 1.
TP = − BD
PD (Eq. 1) Microporosity (PMi) was calculated as the amount of water retained in
undisturbed soil samples subjected to pressure -0.0006 Mpa (60 cm H2O). Macroporosity
(PMa) was calculated as the difference between TP and PMi. All of these physical
analysed according to EMBRAPA (2011) and adjusted based on Ruiz (2005a, 2005b).
We used equation 2 to calculate the Water Filled Pore Space (WFPS) from the BD, TP
and gravimetric moisture results of each point:
�� � = �∗���∗ (Eq.2)
where SM is gravimetric soil moisture in (%), BD is soil bulk density (g cm-3), and TP is total porosity (%).
2.4. Canopy cover
To estimate the canopy cover level (%) Hemispheric Photographs (HPs) were
taken of each sampling point (Figure 1), with a Canon T2i 18 megapixel camera and a
fisheye lens. The camera was attached to a tripod with a spirit level. The tripod with
camera was set at 80 cm high above the soil surface in the centre of all sampling plots,
aiming to ensure real brightness of the soil surface. The camera was pointed to the
magnetic North. Light intensity is important for image quality; thus, images were taken
at sunrise, preventing the direct entry of sunlight into the lens and avoiding excess light
in the images. We used a lens aperture of F 6.3 for all images (Pueschel et al., 2012),
which were saved as 16-bit. Five images were taken at each sampling point, and the best
image was analysed by the program GLA (Gap Light Analyzer) in the blue band, seeking
to achieve the optimum brightness value (thresholding) of the sky (Leblanc et al., 2005).
The images were obtained with a Zenithal angle of 0–90º resulting in a view of
180º from the soil surface; however, pixels become mixed when the Zenithal angle has
high values (Jonckheere et al., 2004; Leblanc et al., 2005). To avoid this problem, a mask
that limited Zenithal angle values of 0–70º (Macfarlane et al., 2007) and 9
segments azimuth was created before analysis in the GLA program; thus, the analysed
images represented a view of 140º from 80 cm high above the soil surface. In total, 60
2.5. Air and soil microclimate
When measuring soil CO2 efflux, we also measured air temperature, humidity and soil temperature, in addition to collecting soil samples to analyse moisture content. Air
temperature and humidity were measured at 80 cm height using a Thermohygrometer
(Incoterm, model 7666.02.0.00). Soil temperature was evaluated using a soil thermometer
type dipstick placed at 5 cm and 10 cm soil depths, 3 cm from the outside of the ring. To
evaluate gravimetric soil moisture, soil samples were collected at 0–5 cm depth and stored
in aluminium cans, which were capped and sealed with plastic tape after collection to
prevent any moisture loss. In the laboratory, the soil samples were weighed and dried in
an oven at 105 ºC for 48 h, after which moisture was measured.
2.6. Soil CO2 efflux and soil temperature sensitivity
To evaluate soil CO2, we used the IRGA LI-8100 with a bell of 10 cm in diameter (model 8100-102). Soil CO2 efflux was evaluated for 90 s in each ring. We tried to
complete the evaluation of all 20 rings in the 20 sampling points at each farm as quickly
as possible to minimise variation in soil temperature and moisture between the sampling
points (Scala et al., 2005). The data were collected in the morning (8:00 to 10:00 h) and at midday (12:00 to 14:00 h) over 3 consecutive days at each farm during spring 2013
(October and November). In total, we carried out 360 evaluations of soil CO2 efflux at the three farms.
To compare the temperature sensitivity of the soil in the AF and FS systems of
each farm, the proportional change in soil respiration when soil temperature increased by
10 °C (Q10) was calculated, based on the relationship between soil temperature at 5 cm
CO2ef= α.e (β1.T) (Eq. 3)
where CO2ef is the soil CO2 efflux (μmolm-2 s-1), T is the soil temperature, α is the intercept of soil CO2 efflux when the temperature is zero and β1 is the regression
coefficient obtained from the natural logarithm of the CO2 efflux and soil temperature at 5 cm depth.
Q10 = e10⋅β1 (Eq. 4) To calculate the Q10 of the two systems in each farm, the data for the two daytime
measurements (morning and midday) were grouped for each system.
The three farms are located in different altitudes (Table 1). Moreover, soil CO2
efflux was measured on different dates, and each site had different soil temperatures at 5
cm depth. Therefore, to compare soil CO2 efflux between the three farms, the efflux at each system was normalised to a temperature of 25 ºC, generating new soil CO2
efflux (R25) values at each sampling point. The R25 was calculated according to the following equation (Acosta et al., 2013):
R25 = CO2ef *
25−�
25 (Eq. 5)
where CO2ef is the soil CO2efflux (μmolm-2 s-1) measured at each point, and T is the soil temperature at 5 cm depth, measured at the time of soil CO2 efflux evaluation.
2.7. Statistical analysis
The relationship between canopy cover and the environmental characteristics (air
temperature and humidity, soil temperature, and moisture) of each farm was analysed by
Pearson's correlation, with 5% significance. Soil CO2 efflux and soil physical and chemical properties were first analysed by descriptive statistics. The spatial variability of
soil CO2 efflux was characterised for each measurement by calculating the coefficient of variation (CV; i.e. the ratio between the standard deviation and the mean value), using
of soil CO2 efflux normalized to 25 °C between farms was carried out by analysis of
variance (ANOVA) and applied the Tukey test at 5% probability.
Multiple stepwise analyses were used to model and identify the environmental
variables and physical and chemical soil characteristics that most influenced soil
CO2 efflux in the two systems at each farm. In the multivariate regression analysis, soil CO2 efflux was the dependent variable and the soil physical, chemical, and environmental
characteristics were the independent variables. The relative importance of each parameter
from equations was measured and then applied diagnostics tests for heteroscedasticity,
normality, and influential observations. Principal Components Analysis (PCA) was also
used to reduce the complex dataset to a lower dimensionality, to reveal simplified
structures that explain the complex dataset. PCA analysis was performed with all
variables from the three farms combined to assess how the variables were correlated. The
program R was used to perform the statistical analysis.
3. RESULTS
3.1. Chemical and physical soil characteristics
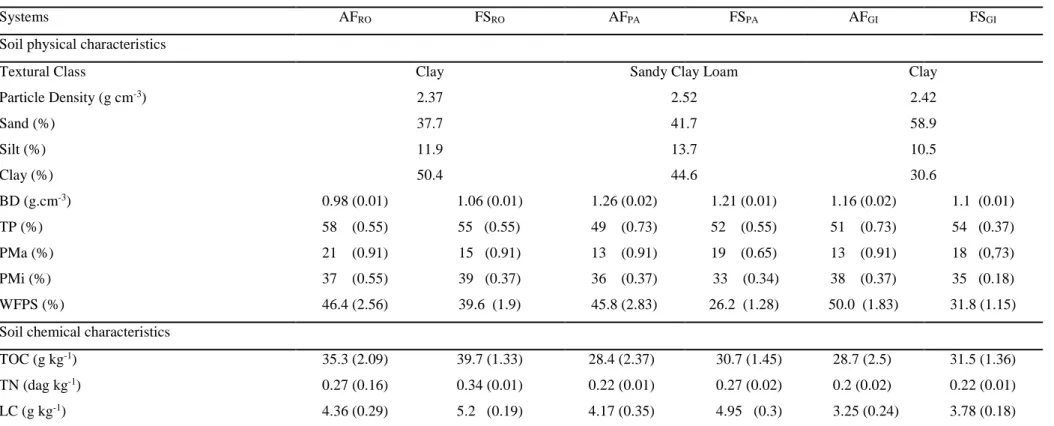
Table 2 presents the average of the physical and chemical characteristics from
soils. The soils were classified as clay (RO and GI) and sand clay loam (PA), with both
coffee systems presenting the same soil texture at each farm. Mean soil BD was similar
in the two systems at each farm, with the highest values being obtained at PA, followed
by GI and RO. Mean TP was lowest in AFPA (49%) and highest in AFRO (58%), while mean PMa was lowest in AFGI (13%) and highest in AFRO (21%). Mean PMi was lowest
in FSPA (33%) and highest in FSRO (39%). Mean WFPS was lowest in FSPA (26.3%) and highest in AFGI (50%). Mean TOC was lowest in AFPA (28.4 g kg-1) and highest in FSRO
Table 2: Average of the soil physical (n = 30 per system) and chemical (n = 10 per system) characteristics from agroforestry (AF) and full-sun
(FS) coffee systems at the three farms (RO, PA, GI) at 0-10 cm soil depth in Minas Gerais, Brazil.
Systems AFRO FSRO AFPA FSPA AFGI FSGI
Soil physical characteristics
Textural Class Clay Sandy Clay Loam Clay
Particle Density (g cm-3) 2.37 2.52 2.42
Sand (%) 37.7 41.7 58.9
Silt (%) 11.9 13.7 10.5
Clay (%) 50.4 44.6 30.6
BD (g.cm-3) 0.98 (0.01) 1.06 (0.01) 1.26 (0.02) 1.21 (0.01) 1.16 (0.02) 1.1 (0.01)
TP (%) 58 (0.55) 55 (0.55) 49 (0.73) 52 (0.55) 51 (0.73) 54 (0.37)
PMa (%) 21 (0.91) 15 (0.91) 13 (0.91) 19 (0.65) 13 (0.91) 18 (0,73)
PMi (%) 37 (0.55) 39 (0.37) 36 (0.37) 33 (0.34) 38 (0.37) 35 (0.18)
WFPS (%) 46.4 (2.56) 39.6 (1.9) 45.8 (2.83) 26.2 (1.28) 50.0 (1.83) 31.8 (1.15)
Soil chemical characteristics
TOC (g kg-1) 35.3 (2.09) 39.7 (1.33) 28.4 (2.37) 30.7 (1.45) 28.7 (2.5) 31.5 (1.36)
TN (dag kg-1) 0.27 (0.16) 0.34 (0.01) 0.22 (0.01) 0.27 (0.02) 0.2 (0.02) 0.22 (0.01)
LC (g kg-1) 4.36 (0.29) 5.2 (0.19) 4.17 (0.35) 4.95 (0.3) 3.25 (0.24) 3.78 (0.18)
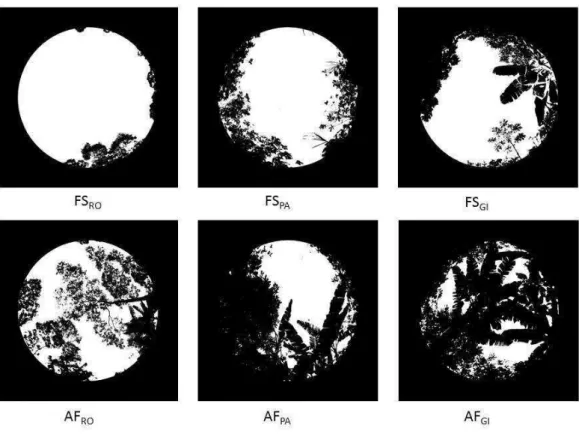
3.2. Canopy cover
Canopy cover was higher in all AF systems compared to the FS systems (Figures
1 and 2). Comparing the percentage of covering, canopy cover level was, on average,
31% higher in AFRO than FSRO, 38% higher in AFPA than FSPA and 35% higher in AFGI than FSGI. Among the AF systems, AFGI had the highest level of canopy cover, whereas AFRO had the lowest (Figure 2).
Figure 1: Representative images from Hemispherical Photographs (140º angle of view)
RO PA GI
C
a
n
o
p
y
c
o
v
e
r
(%
)
0 20 40 60 80
100 AF
FS
Figure 2: Mean (n = 10) canopy cover (%) in the agroforestry (AF) and full-sun (FS)
coffee systems studied in the three farms (RO, PA, GI), Minas Gerais, Brazil. Bars represent mean ± standard error.
3.3. Air and soil temperature and humidity
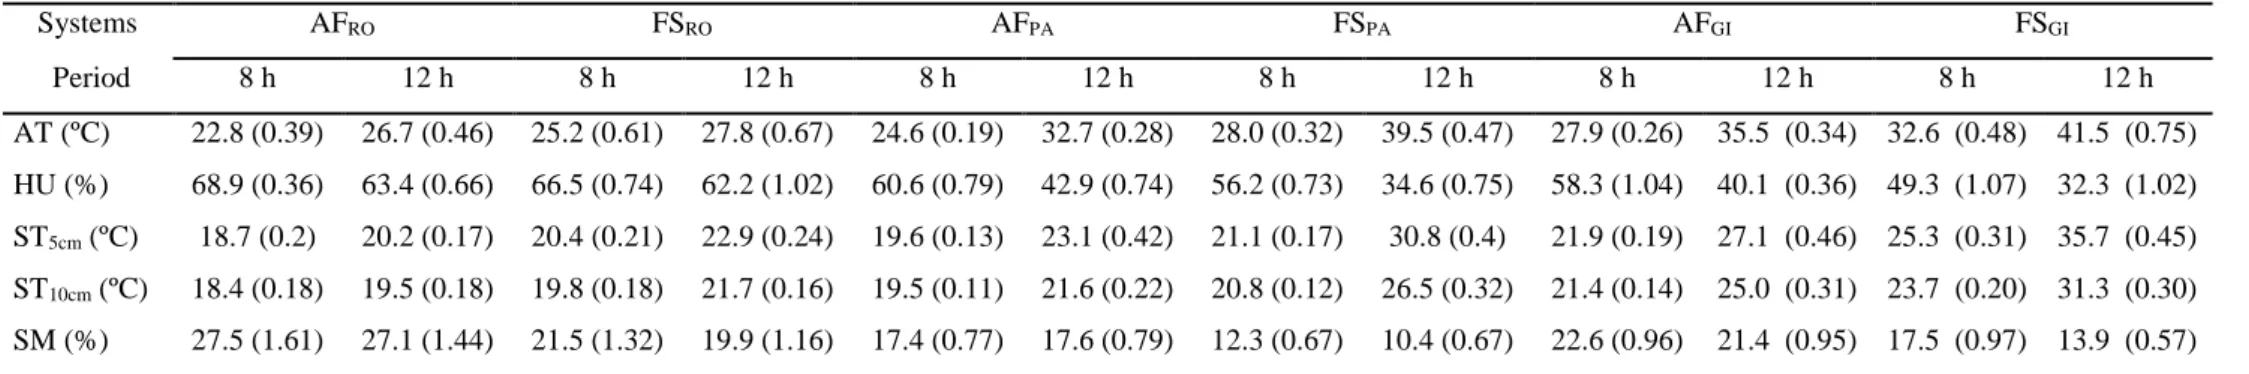
Table 3 presents the air temperature and humidity, soil temperature at 5 and 10
cm depth and soil moisture at 0–5 cm depth
.
On average,
air temperature was 4.1 oC lessin the AF than in the FS systems; air humidity was 5.1% more in the AF than in the FS
systems; soil temperature at 5 cm was 4.3 oC and at 10 cm 3.1 oC less in the AF than in
Table 3: Average (n = 30) air temperature (AT) and Humidity (HU), soil temperature (ST) at 5 and 10 cm depths and soil moisture content (SM) in the
agroforestry (AF) and full-sun (FS) coffee systems studied in the three farms (RO, PA, GI), Minas Gerais, Brazil.
Systems AFRO FSRO AFPA FSPA AFGI FSGI
Period 8 h 12 h 8 h 12 h 8 h 12 h 8 h 12 h 8 h 12 h 8 h 12 h
AT (ºC) 22.8 (0.39) 26.7 (0.46) 25.2 (0.61) 27.8 (0.67) 24.6 (0.19) 32.7 (0.28) 28.0 (0.32) 39.5 (0.47) 27.9 (0.26) 35.5 (0.34) 32.6 (0.48) 41.5 (0.75)
HU (%) 68.9 (0.36) 63.4 (0.66) 66.5 (0.74) 62.2 (1.02) 60.6 (0.79) 42.9 (0.74) 56.2 (0.73) 34.6 (0.75) 58.3 (1.04) 40.1 (0.36) 49.3 (1.07) 32.3 (1.02)
ST5cm (ºC) 18.7 (0.2) 20.2 (0.17) 20.4 (0.21) 22.9 (0.24) 19.6 (0.13) 23.1 (0.42) 21.1 (0.17) 30.8 (0.4) 21.9 (0.19) 27.1 (0.46) 25.3 (0.31) 35.7 (0.45)
ST10cm (ºC) 18.4 (0.18) 19.5 (0.18) 19.8 (0.18) 21.7 (0.16) 19.5 (0.11) 21.6 (0.22) 20.8 (0.12) 26.5 (0.32) 21.4 (0.14) 25.0 (0.31) 23.7 (0.20) 31.3 (0.30)
SM (%) 27.5 (1.61) 27.1 (1.44) 21.5 (1.32) 19.9 (1.16) 17.4 (0.77) 17.6 (0.79) 12.3 (0.67) 10.4 (0.67) 22.6 (0.96) 21.4 (0.95) 17.5 (0.97) 13.9 (0.57)
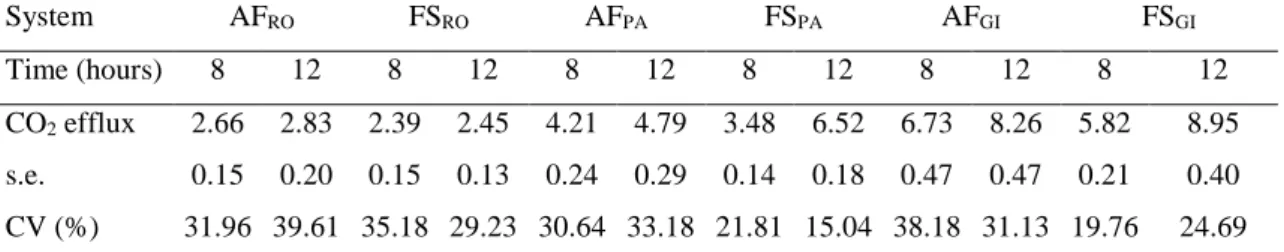
3.4. Soil CO2 efflux
Average soil CO2 efflux was lowest in the AFRO (2.66 μmolm-2s-1) and FSRO systems (2.39 μmolm-2s-1) and highest in the AFGI (8.26μmolm-2s-1) and FSGI systems
(8.95 μmolm-2s-1) of the three farms (Table 4). Spatial variation in soil CO2 efflux (expressed as coefficient of variation (CV) in Table 4) were higher in the AF (average
34.1%) than in the FS (average 24.2%) coffee systems.
Table 4: Average (n=30), standard error (s.e.) and coefficient of variation (CV) of soil
CO2 efflux (μmol m-2s-1) in agroforestry (AF) and full-sun (FS) coffee systems in the farms (RO, PA, and GI), Minas Gerais, Brazil.
System AFRO FSRO AFPA FSPA AFGI FSGI
Time (hours) 8 12 8 12 8 12 8 12 8 12 8 12
CO2 efflux 2.66 2.83 2.39 2.45 4.21 4.79 3.48 6.52 6.73 8.26 5.82 8.95
s.e. 0.15 0.20 0.15 0.13 0.24 0.29 0.14 0.18 0.47 0.47 0.21 0.40
CV (%) 31.96 39.61 35.18 29.23 30.64 33.18 21.81 15.04 38.18 31.13 19.76 24.69
s.e = standard error; CV = Coefficient of Variation (%).
3.5. Soil temperature sensitivity and R25
Of all three farms, the Q10 was highest in both the AF (2.41) and FS (1.90) systems of RO, whereas it was lowest in the AF (1.26) system of PA. Only FSPA (1.84) and FSGI
(1.41) had Q10 values with significant determination coefficients, since soil CO2 efflux and soil temperature at 5 cm depth exhibited higher variation in FS versus AF systems
during the day (Table 5). The highest soil temperature variation from morning to midday
was observed in FSPA (+ 9.74 °C) and FSGI (+ 10.45 ºC). The highest soil CO2 efflux variation was observed in FSPA (+ 89.7%). Interestingly, both AF and FS systems
Table 5: Q10 values and coefficients of determination (R2) for the mean (n = 60 evaluations of soil CO2 efflux) and variation in soil temperature (Δ T5 cm) and soil CO2 efflux (Δ CO2ef) at each sampling point from the morning to midday periods in agroforestry (AF) and full-sun (FS) coffee systems at the farms (RO, PA and GI), Minas Gerais, Brazil.
System AFRO FSRO AFPA FSPA AFGI FSGI
Q10 2.41 1.9 1.26 1.84 1.49 1.41
R² 0.09 0.11 0.02 0.73 0.14 0.45
Δ T5 cm (ºC) + 1.48 + 2.45 + 3.46 + 9.74 + 5.18 + 10.45
Δ CO2ef(μmolm2s-1) + 0.16 + 0.05 + 0.58 + 3.03 + 1.51 + 3.13
Δ CO2ef (%) + 5.17 + 4.21 + 14.46 + 89.73 + 26.61 + 53.36
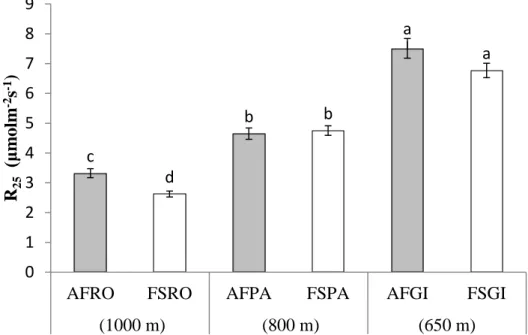
When normalised to 25 °C, soil CO2 efflux in the systems were similar (p > 0.05)
at farms PA and GI, but not at RO. Soil CO2 efflux increased (p < 0.05) when the altitude decreased. Thus, soil CO2 efflux: RO (1000 m altitude) < PA (800 m altitude) < GI (650 m altitude; Figure 3).
Figure 3: Mean (n = 60 evaluations of soil CO2 in each system) soil CO2 efflux (R25)
normalised at 25 °C soil temperature in the agroforestry (AF) and full-sun (FS) coffee systems at the three farms (RO, PA, and GI), Minas Gerais, Brazil, which were located at different altitudes (expressed as meters in parentheses). Bars with the same letters are not significantly different (p < 0.05) among all systems. Bar represent the mean ± the standard error. c d b b a a 0 1 2 3 4 5 6 7 8 9
AFRO FSRO AFPA FSPA AFGI FSGI
(1000 m) (800 m) (650 m)
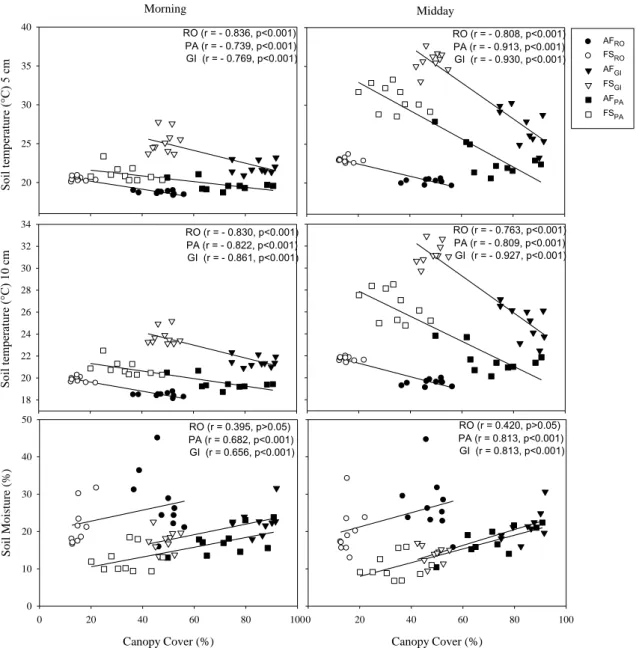
3.6. Canopy cover versus climatic conditions and soil CO2 efflux
The air temperature were negatively correlated (p < 0.001) and air humidity were
positively correlated (p < 0.001) with canopy cover (%) (Figure 4) at all farms. Soil
temperature (at both 5 cm and 10 cm depths) were negatively correlated (p < 0.001) at all
farms and soil moisture content (%) was positively correlated (p < 0.001) with canopy
cover (%) at two of the farms (PA and GI), but showed no correlation at the third farm
(RO) (Figure 5).
Morning A ir t em pe ra tur e (° C ) 20 25 30 35 40 45
Canopy Cover (%)
0 20 40 60 80 100
Ai r humi di ty (% ) 20 30 40 50 60 70 80
Canopy Cover (%)
0 20 40 60 80 100
Midday
RO (r = - 0.739, p<0.001) PA (r = - 0.853, p<0.001) GI (r = - 0.871, p<0.001) RO (r = - 0.816, p<0.001)
PA (r = - 0.787, p<0.001) GI (r = - 0.766, p<0.001)
RO (r = 0.618, p<0.01) PA (r = 0.746, p<0.001) GI (r = 0.684, p<0.001)
RO (r = 0.697, p<0.001) PA (r = 0.835, p<0.001) GI (r = 0.858, p<0.001)
AFRO FSRO AFGI FSGI AFPA FSPA
Figure 4: Person’s correlations between canopy cover (%) and air temperature and
Soi l t em pe ra tur e (° C
) 5 c
m 20 25 30 35 40 Soi l t em pe ra tur e (° C ) 10 c m 18 20 22 24 26 28 30 32 34
Canopy Cover (%)
0 20 40 60 80 100
Soi l Mois tur e (% ) 0 10 20 30 40 50
Canopy Cover (%)
0 20 40 60 80 100
RO (r = - 0.836, p<0.001) PA (r = - 0.739, p<0.001) GI (r = - 0.769, p<0.001)
RO (r = - 0.808, p<0.001) PA (r = - 0.913, p<0.001) GI (r = - 0.930, p<0.001)
RO (r = - 0.830, p<0.001) PA (r = - 0.822, p<0.001) GI (r = - 0.861, p<0.001)
RO (r = - 0.763, p<0.001) PA (r = - 0.809, p<0.001) GI (r = - 0.927, p<0.001)
RO (r = 0.395, p>0.05) PA (r = 0.682, p<0.001) GI (r = 0.656, p<0.001)
RO (r = 0.420, p>0.05) PA (r = 0.813, p<0.001) GI (r = 0.813, p<0.001)
Morning Midday AFRO FSRO AFGI FSGI AFPA FSPA
Figure 5: Person’s correlations between canopy cover (%) and soil temperature at 5 and
10 cm depth and soil moisture in the morning (08:00–10:00 h) and midday (12:00–14:00 h) in the agroforestry (AF) and full-sun (FS) coffee systems at three farms (RO, PA, and GI), Minas Gerais, Brazil.
Figure 6 shows that decreasing soil CO2 efflux variation from morning to midday is related to increasing canopy cover. Daytime soil CO2 efflux variation (%) was negatively correlated with canopy cover (%) in PA (r = 0.787, p < 0.0001) and GI (r =
Figure 6: Pearson’s correlations between canopy cover (%) and soil CO2 efflux variation (%) from the morning (08:00–10:00) to midday (12:00–14:00) at each sampling point in the agroforestry (AF) and full- sun (FS) coffee systems at three farms (RO, PA, and GI), Minas Gerais, Brazil.
Gilberto
Canopy cover (%)
0 20 40 60 80 100
-20 0 20 40 60 80 RO -20 -10 0 10 20 30 40 50 60
p > 0.1
PA So il CO 2 e ff lu x v ar iati o
n (
%) -20 0 20 40 60 80 100 120 140
r = - 0.710 r = - 0.02
p < 0.0001
r = - 0.787 p < 0.0001
GI
3.7. Multivariate analysis of soil CO2 efflux
The multivariate equations (Table 6) showed that different factors control soil CO2 efflux in the AF and FS coffee systems. Soil CO2 efflux was more correlated with
variation in LC and TN in the AF systems, whereas it was primarily correlated with soil
temperature (especially at 10 cm depth) in the FS systems. Soil CO2 efflux variation was primarily explained by TN (47%) and LC (24 %) in AFRO, whereas it was explained by
TN (30%), LC (60%), and soil temperature at 10 cm depth (9%) in FSRO. Soil CO2 efflux variation was primarily explained by soil BD (36%), LC (21%), and TN (18%) in AFPA,
whereas it was explained by soil temperature at 10 cm depth (97%) in FSPA. Soil CO2 efflux variation was primarily explained by soil temperature at 10 cm depth (28%), TN
(27%), and total soil moisture (23%) in AFGI, whereas it was explained by soil
Table 6: Regression equations of soil CO2 efflux in relation to soil microclimatic, chemical and physical characteristics from the agroforestry (AF) and full-sun (FS) coffee systems at the three farms (RO, PA and GI), Minas Gerais, Brazil.
System Parameters Regression Equation FD F R2 p
AFRO
TN (47%), LC (29%),
PMi (24%)
Y = -3,49 + 2.25TN** -0,96LC*
+11,35PMi 16 5.75 0.52 0.007
FSRO
TN (30%), LC (60%),
ST10cm (9%), SM (1%)
Y= -1,41 + 0.018 ST10cm
+ 0.85LC**
-0.02SM -0.20TN
15 13.1 0.77 < 0.0001
AFPA
TN (18%), LC (21%),
ST10cm (7%),SM (9%),
BD(36%), PMi (9%)
Y= 2.57 + 0.20 ST10cm + 2.50TN
-1.15LC - 9.32BD + 20.83PMi +
0.09SM
13 0.95 0.30 0.495
FSPA
ST10cm (97%),
LC (1%) TOC (1%),
BD (1%)
Y = - 9.78 + 0.51 ST10cm ***+
0.22TOC + 0.28BD + 0.36LC
15 17.2 0.82 < 0.0001
AFGI
TN (27%),ST10cm
(28%),SM(23%),BD
(10%), PMi (12%)
Y = 35.1 + 0.689 ST10cm** -5,58
TN** -6,01 BD - 92.50PMi* +
0.38 SM*
14 5.42 0.66 0,005
FSGI
ST10cm (55%),
TN (23%), SM (22%)
Y = 11.17 + 0.36 ST10cm** +
4.31TN* - 0.06SM
16 11.4 0.68 < 0.0001
FD = Freedom degrees; TN = Nitrogen Total; LC = Labile Carbon; PMi = Microporosity; ST10cm = soil temperature at 10 cm depth; BD = soil Bulk Density; TOC = Total Organic Carbon and SM = Soil Moisture. The percentage between parentheses shows the relative importance of each parameter for the soil CO2 efflux.
(**) p < 0.001 and (*) p < 0.05.
The PCA analysis indicated which variables were responsible for total data
Figure 7: Principal Component Analysis of data from the agroforestry and full-sun coffee
systems at the three farms (RO, PA, GI), Minas Gerais, Brazil. The plot shows the soil characteristics and environmental factors that tend to influence soil CO2 efflux. ST5cm = soil temperature at 5 cm depth; ST10cm = soil temperature at 10 cm depth; PMa = Macroporosity; LC = Labile Carbon; TP = Total Porosity; TOC = Total Organic Carbon; TN = Total Nitrogen; SM = soil moisture; PMi = Microporosity; WFPS = Water Filled Pore Space; BD = Soil Bulk Density.
4. DISCUSSION
4.1. Influence of canopy’s trees on soil and air variables
The agroecological management of the two systems in the three farms improved
the soil quality, indicated specially by the TOC (average of 32.38 g kg-1 at 0-10 cm soil
depth, Table 2), whereas, in the same region, TOC (n = 41) in coffee fields was 21.7 g
kg-1 at 0-20 cm (Martinez et al., 2000) and in native forests (n=3) was 61.0 g kg-1 at 0-10 cm (Souza et al., 2012). Plants that grow spontaneously between coffee plant rows in AF
and FS coffee systems are controlled with agroecological practices and not completely
increases the carbon input also in FS systems. Therefore, this may explain similar amount
of total organic carbon found in the two systems investigated in the current study (Table
2).
In the studied AF, the coffee was intercropped with a diversity of different tree
species (Souza et al., 2010), resulting in different canopy dimensions, tree phenology and
leaf density. These differences led to different percentages of soil surface cover by the
canopy (Figure 1 and 2), affecting the amount of solar radiation that reached the soil
(Breman and Kessler, 1995). The main tree species in AFRO (Inga subnuda) were pruned
during the summer of 2012 (i.e. the year before the study was conducted), which may
explain why this location had lower canopy cover of the AF than FS systems.
The trees in the agroforestry systems provide stability to microclimate under the
canopy (Beer et al., 1997; Kiepe and Rao, 1994; Lin, 2007a; Nair, 1997), reducing, for
instance, air temperature (Akpo et al., 2005; Lin et al., 2008; Souza et al., 2012), as shown
in our study (Figure 4). The air temperature, despite different altitudes, different
vegetation species and ages of implementation of the studied systems (Table 1) correlated
with canopy cover (Figure 4).
The microclimate provided by tree canopy is important for C. arabica cultivation,
which requires temperature of 18–21 ºC for optimal growth (Alegre, 1959). It has been
predicted that a 2 °C increase in the average global temperature will occur by 2100
(Stocker et al., 2013). If this temperature rise occurs, many places such as the Zona da
Mata of Minas Gerais (Brazil) will no longer be suitable for growing C. arabica (Assad
et al., 2004). However, the ecophysiological limitations of coffee may be overcome if the
plants are shaded, as in AF systems (DaMatta, 2004). Therefore, in a scenery of climate
production in areas such as the Zona da Mata of Minas Gerais. In this region, AF systems
are already used, but remain small-scale at present (Edenhofer et al., 2014).
Moreover, the humidity in the agroecosystem is also important topic due to
predicted global climatic change. Increased canopy cover level increases soil moisture
(Lin et al., 2006; Liu et al., 2013), as observed in our study (Figure 5), due to a decrease
in soil evaporation (Lin, 2010). Coffee production is extremely vulnerable to water
availability, which is necessary for the development of coffee beans and consequently
determines the fruit size (Cannell, 1983). In the region, this is also important in January
and February (rainy season), when a short dry period can occur leading to bad formation
of the coffee beans. Thus, agroforestry coffee systems can provide better conditions to
maintain the water in the system (Liu et al., 2013) and enhances coffee beans sizes (Vaast
et al., 2006), therefore, decreasing the risk of coffee production losses.
4.2. Soil CO2 efflux
Existing publications state that soil CO2 efflux is one of the largest uncertainties when analysing the global carbon cycle, because it involves several processes, including
different sources and multiple and varied controllers (Moyes et al., 2010). Our findings
contributes towards improving our understanding about the dynamic of soil CO2 efflux. In our study, we found that the daily mean soil CO2 efflux was similar in both AF and FS coffee systems at all three farms (Table 4). However, the results indicated that the daily
dynamics in soil CO2 efflux differed between the two systems. We found that the soil CO2 efflux variation during the day decreases with increases in canopy cover levels
(Figure 6) and that the efflux was more stable in AF systems, presenting less temporal
variation from morning to midday than in FS systems (Table 5), except in in RO farm. In
RO, during the three days of the soil CO2 efflux evaluation, the air humidity was very