FRANCISCO ALISSON DA SILVA XAVIER
SOIL ORGANIC MATTER STOCK AND QUALITY IN AGROFORESTRY AND FULL SUN COFFEE SYSTEMS
Tese apresentada à Universidade Federal de Viçosa, como parte das exigências do Programa de Pós-Graduação em Solos e Nutrição de Plantas, para obtenção do título de
Doctor Scientiae.
VIÇOSA
FRANCISCO ALISSON DA SILVA XAVIER
SOIL ORGANIC MATTER STOCK AND QUALITY IN AGROFORESTRY AND FULL SUN COFFEE SYSTEMS
Tese apresentada à Universidade Federal de Viçosa, como parte das exigências do Programa de Pós-Graduação em Solos e Nutrição de Plantas, para obtenção do título de
Doctor Scientiae.
APROVADA: 26 de junho de 2009.
Profa. Irene Maria Cardoso (Co-orientadora)
Prof. Ivo Jucksch (Conselheiro)
Prof. Carlos Alberto Silva (Examinador)
Prof. Felipe Vaz Andrade (Examinador)
ii
D ed i co
À m i n h a a m a d a esp osa H él i d a Col a r es
p el o seu a m or , ca r i n h o e p a ci ên ci a
iii
Of er eço
A os m eu s p a i s, Ed i l son e L ú ci a , e i r m ã s,
A l i n e e A l i ce, qu e i n con d i ci on a l m en t e m e
iv AGRADECIMENTOS
À Deus pela vida e por todas as coisas que a mim foram concedidas. À Universidade Federal de Viçosa, por meio do Departamento de Solos, pela oportunidade da realização do curso de doutorado.
À Coordenação de Aperfeiçoamento de Pessoal de Nível Superior (CAPES), ao Conselho Nacional de Desenvolvimento Científico e Tecnológico (CNPq) e à Fundação de Amparo à Pesquisa do Estado de Minas Gerais (FAPEMIG) pela concessão das bolsas de estudo no país e no exterior e pela concessão do fomento utilizado no custeio das ações de pesquisa.
Ao professor Eduardo de Sá Mendonça pela orientação durante a condução deste estudo e, sobretudo, pela amizade e confiança construídas ao longo desses anos.
Aos professores Irene Maria Cardoso e Ivo Jucksch pelas preciosas e fundamentais contribuições para a melhoria deste estudo, pelo apoio e amizade a mim oferecidos sem restrições.
Aos conselheiros Ivo Ribeiro da Silva e Paulo César de Lima e examinadores Carlos Alberto Silva e Felipe Vaz Andrade pelas valiosas sugestões ao trabalho.
Ao Centro de Edafología y Biología Aplicada del Segura (CEBAS/CSIC-España) por meio dos pesquisadores Asunción Roig e Miguel Angel Sanchez-Monedero; e ao Instituto de Recursos Naturales y Agrobiología de Sevilla (IRNAS/CSIC-España) por meio dos pesquisadores Francisco Javier González Vila e José Antonio González-Pérez pela orientação e amizade durante o período de doutorado sanduíche na Espanha. À laboratorista Trinidad Verdejo (IRNAS) durante a condução das análises em Sevilla.
v Aos bolsistas de iniciação científica Everson Freitas de Almeida e Monique Regina Carvalho Freitas pelas duras horas de trabalho e pela amizade construída.
Aos amigos Helton Nonato e Edivânia Duarte pelo convívio com intensas trocas de saberes e pelo companheirismo constante.
Aos colegas do Laboratório de Matéria Orgânica do Solo: Juliana Vanir, Emanuelle Soares, Marino, Alysson Mafia, Rafael Polizel e Lucas Gomes pela amizade quer nas horas de trabalho, quer no lazer (churrascos, cafezinhos, etc) durante todos esses anos. Em especial, meus sinceros agradecimentos ao laboratorista Brás Júlio (UFV) pela constante ajuda e pela amizade já de longas datas.
Aos novos amigos feitos na Espanha: Nuria, Mari Luz, Keiji, Guita, Encarnación, Marcelo, Marlio (Balo), Neila, Emerson, Janaína, Carla, Fábio e Lacau que durante o doutorado sanduíche me deram apoio longe da família e dos amigos no Brasil.
Aos meus amigos de república: Antônio Marcos, Fernando Schettini, Augusto Lima e Michel Moreira pelas poucas más e muitas boas horas de convivência. À Dona Rita que cuidava de nós como mãe.
A todos os amigos da Igreja Presbiteriana de Viçosa cujos nomes não serão relacionados para evitar a injustiça do esquecimento. Porém, não poderia deixar de agradecer pelo apoio e amizade de: Samuel, Filipinho, Jony, Lênia, Zilbinho, Marô, Lis, Júlia, Marcinho, Fred, Jeanne, Paulinho, Maressa, André Campos, Laura, PG, Carla, Marlon, Michele, Mauro, Tereza, Lissânder, Kelen, Gustavo Veríssimo, Lilian, Mel e Artur
Ao povo brasileiro que, por meio dos impostos, financiam a educação pública no país.
vi SUMÁRIO
RESUMO vii
ABSTRACT xi
Capítulo 1
Introdução Geral. 1
Capítulo 2
Estoques de C, N e P do solo em áreas de cultivo de café sob sistemas agroflorestal e a pleno sol no bioma da Floresta Atlântica em Minas Gerais,
Brasil. 9
Capítulo 3
Dinâmica e distribuição de C e N em diferentes frações de agregados do solo em áreas de cultivo de café sob sistemas agroflorestal e a pleno sol. 45 Capítulo 4
Compartimentos de fósforo em solos cultivados com café sob sistemas agroflorestal e a pleno sol no bioma da Floresta Atlântica em Minas Gerais,
Brasil. 75
Capítulo 5
Características estruturais de substâncias húmicas isoladas de solos cultivados com café sob sistemas agroflorestal e a pleno sol no bioma da
Floresta Atlântica em Minas Gerais, Brasil. 100
Capítulo 6
Considerações finais.
134
vii RESUMO
XAVIER, Francisco Alisson da Silva, D.Sc., Universidade Federal de Viçosa, junho de 2009. Estoque e qualidade da matéria orgânica do solo em áreas cultivadas com café sob sistemas agroflorestal e a pleno sol. Orientador: Eduardo de Sá Mendonça. Co-orientadores: Irene Maria Cardoso, Ivo Ribeiro da Silva e Paulo César de Lima.
viii estudo foram: (i) quantificar os estoques de C orgânico, N e P do solo e em diferentes compartimentos da MOS em áreas com cultivo de café sob SAF e PSOL, e (ii) avaliar a influência da diversidade e qualidade dos resíduos orgânicos sobre as características químicas e estruturais das substâncias húmicas em ambos os sistemas. O estudo foi conduzido em três propriedades de agricultores familiares em sistemas de cultivo de café sob SAF e PSOL em áreas situadas nos municípios de Divino e Araponga na região da Zona da Mata de Minas Gerais. Áreas sob fragmentos de mata nativa (MN) foram também amostradas e utilizadas como referência da condição de equilíbrio do solo. Amostras de solo foram coletadas nas profundidades de 0-5, 5-10, 10-20 e 20-40 cm. O capítulo 1 apresenta a introdução geral enfatizando os principais problemas do estudo. No capítulo 2 avaliaram-se os estoques totais de C orgânico, N e P no solo e nas substâncias húmicas. Os estoques de C orgânico nas áreas cultivadas variaram de 1,36 a 3,92 kg m-2 entre os diferentes sítios de estudo. De modo geral, não houveram diferenças significativas nos estoques de C, N e P do solo entre os sistemas SAF e PSOL em todos as áreas avaliadas. Tal efeito parece estar relacionado com outras características físicas do solo. O cultivo do solo reduziu os estoques de C em relação à MN. Nos SAFs tal redução foi menor quando comparado aos sistemas PSOL. A adoção dos SAFs resultou no aumento do índice de manejo de C em todos os sítios avaliados, sugerindo a reabilitação dos níveis de SOM. O potencial dos SAFs para o aumento do estoque de C no solo depende das condições ambientais particulares de cada sítio de estudo. A dinâmica do C, N e P no solo foi diretamente influenciada pela qualidade dos resíduos orgânicos nos SAFs. O estudo da dinâmica do C e N em diferentes classes de agregados é apresentado no capítulo 3. O teor de C na fração 250–2000
µm representou a maior parte do C orgânico total do solo. Em Divino, o conteúdo
xi ABSTRACT
XAVIER, Francisco Alisson da Silva, D.Sc., Universidade Federal de Viçosa, June 2009. Soil organic matter stock and quality in agroforestry and full sun coffee systems. Advisor: Eduardo de Sá Mendonça. Co-advisors: Irene Maria Cardoso, Ivo Ribeiro da Silva and Paulo César de Lima.
xii agroforestry-coffee (AGF) and full sun coffee (FSC) systems situated at the municipalities of Divino and Araponga in the Atlantic Coastal Forest biome in the state of Minas Gerais, Brazil. In each selected site, areas under natural forest fragments (NF) were sampled and used to represent the native or steady state condition of soil. Soil samples were collected from 0-5, 5-10, 10-20 and 20-40 cm depth intervals. Chapter 1 presents a general introduction of the thesis, emphasizing the main study problems. In chapter 2, we evaluated the total organic C, N and P stocks in the soil and humic substances. Soil organic C stocks in the coffee-cultivated lands varied from 1.36 to 3.92 kg m-2 among all evaluated sites. In general, there were no significant differences in the soil C, N and P stocks between AGF and FSC systems in all evaluated sites. Other soil physical characteristics are likely related to this behavior. In comparison to a reference area, AGF systems presented lower C stock reductions than FSC systems. The adoption of AGF management resulted in the increase in the carbon management index in all sites, suggesting the rehabilitation or enhancement of SOM levels. The potential of agroforestry management to increase soil C storage depended on system-characteristics in each particular environmental condition. The dynamics of C, N and P in the soil has been strongly influenced by the quality of organic residues in the agroforestry systems. The study of C and N dynamics in aggregate-sized fractions is presented in Chapter 3. The C concentration in the 250–2000
xiii systems seems depend on the organic P pool. In Divino and Araponga(I), agroforestry increased the proportion of mineralizable Po (NaHCO3-Po + HClconc.-Po), which can favor biological processes of the soil P cycling. In Araponga (II), the agroforestry system increased moderately the labile Po pool (NaOH-Po), suggesting that P cycling occurs in a medium-term scale, since such pool has been considered as a source of P when most labile P fractions are depleted. The chemical and structural characterization of soil humic acids (HA) and fulvic acids (FA) was the focus of the study in Chapter 5. Soil HA and FA extracted from 0-5 and 5-10 cm layers were characterized comparatively by using chemical and spectroscopic techniques including: elemental analysis (C, H, N and O contents), analysis of functional groups, thermogravimetry (TG), Fourier transform infra-red (FTIR) and solid-state 13C nuclear magnetic resonance (13C CP-MAS/NMR). At soil surface, the HA from AGF presented higher H/C and lower O/C ratio than the FSC system in Divino, suggesting that AGF management favored the genesis of HAs with less oxidative character. The patterns of elemental composition were supported by the findings of the TG analysis. The FTIR spectra of the HAs and FAs were quite similar when comparing the AGF and FSC systems. In all sites 13C NMR assignment of HAs was dominated by the
O-alkyl C resonance in both soil layers followed by a resonance line assigned to
1 CHAPTER 1
GENERAL INTRODUCTION
The research area and description of the problems
The expansion of coffee (Coffea arabica L.) in the Atlantic Coastal Rainforest, one of most important biomes of the Brazilian vegetation, placed Brazil on the top of the production and exportation of this commodity in the world. Nevertheless, the exploitation of coffee in this region occurred at expense of a severe environmental damage, which brought about the decline of soil quality. It is estimated that the Brazilian Atlantic forest occupies only 7.5% of the original cover (Dean, 1998).
In the Zona da Mata, a region situated in the Atlantic Coastal Rainforest domain, the scenario of land degradation raised as a consequence of deforestation and further exploitation of coffee (Valverde, 1958). In this region, coffee is normally cultivated on hills which have steep slopes, ranging from 20 to 45%. In this case, the risk of degradation due to erosion is accentuated, especially if adequate practices of soil management are not adopted, as usually occurs in areas under intensive cultivation. As a result of the decreased soil quality, farmers usually occupy new and more fertile sites while the old coffee fields are normally converted into pasture. Most agro-ecosystems in the Zona da Mata show a decreasing productivity, even in areas with large use of chemical fertilizers, due to the loss of several soil functions as a consequence of its quality decline.
2 low soil fertility (e.g. Oxisols) in the region and the poor financial condition of smallholding farmers to buy large amounts of chemical fertilizers, there is an urgent need for a debate aiming at the proposition of new and more sustainable alternatives for soil conservation and food production in the Zona da Mata.
Looking for solutions
In 1995, a group of farmers and researchers, supported by the Centre for Alternative Technologies of the Zona da Mata (CTA-ZM), in partnership with the Universidade Federal de Viçosa, especially the Soil Department, started participatory agroforestry-coffee system experimentation. The survey pointed out that agroforestry reduced the soil erosion process, improved soil quality and nutrient cycling, and increased the diversification of production (Souza, 2006). The main goals with the implementation of agroforestry systems were: i) land regeneration and conservation; ii) diversification of production; iii) decrease of the need of input; iv) increase or maintenance of production, and v) improvement of productivity (Cardoso, 2002). Cardoso et al. (2001) stated that the Zona da Mata meets all the criteria postulated by Young (1997) for the adoption of agroforestry. According to this author, agroforestry is particularly well developed in densely populated and sloping regions in the humid and sub-humid tropics, on which soils have often been degraded by erosion and forest cover has been extensively cleared for timber, charcoal and agriculture.
3 systems it is necessary to study the interactions among the tree components, crop production and environmental resources, such as soil and water, which are included in the production.
Soil organic matter
A general soil–agroforestry hypothesis states that appropriate agroforestry systems have the potential to control soil erosion, maintain soil organic matter (SOM) and physical properties, and promote nutrient cycling and efficient nutrient use (Young, 1997). A more specific hypothesis among the twelve agroforestry hypotheses for soil management presented by Young (1997) consider that agroforestry systems can maintain SOM and biological activity at satisfactory levels for soil fertility. We studied more closely such hypothesis regarding the role of SOM in the different processes occurring in the soil.
The improvement of soil fertility as a result of trees in agroforestry is attributed to the maintenance of SOM through the supply of litter and root residues. SOM has been recognized as a major factor that controls the soil ability to deliver agricultural and environmental services and also to sustain human societies at both local (e.g. maintaining soil fertility) and global (e.g. increasing of C sequestration) scale (Manlay et al., 2007). Recent reviews discussing the potential of agroforestry for increasing C sequestration and promoting ecosystem services and environmental benefits are available in literature (Montagnini and Nair, 2004; Jose, 2009; Schoeneberger, 2009).
4 type of organic residues deposited on the soil surface is the senescent biomass. In agroforestry systems, besides the senescent material, inputs of fresh biomass derived from tree pruning also occur. Thus, the quality and the rates of litter and green leaf decomposition from the same plant may be quite different. This can differentiate agroforestry from natural ecosystems and conventional systems (Mafongoya et al., 1998).
The rate of SOM decomposition and mineralization depends on the balance of its labile and recalcitrant (non labile) components (Scholes et al., 1997). In general, the plant age influences the relative proportion of these components. Young plants or young tissues are richer in proteins, minerals and water soluble fractions. As plant age increases, the contents of cellulose, hemicellulose, lignin and polyphenols also increase (Scholes et al., 1997).
Decomposition is defined as the alteration of the original chemical structure of an organic compound or tissue, and in terms of SOM, is characterized by gradual changes in C functional groups that can be successfully assessed by specific spectroscopic techniques (Mathers et al., 2000). This process can be influenced by environmental factors such as temperature, nutritional status, and water content (Stevenson, 1994).
5 maintain soil structure and fertility (Ding et al., 2006). The SOM quality can be defined as its capacity to be used by soil biota as a source of energy, and/or as C skeleton on its own structure. The response to high SOM quality is an increase in the microbial activity promoting fast decomposition of residues and nutrient availability (Rovira and Vallejo, 2002). In tropical regions, especially in the areas with agroforestry systems, studies focused on the SOM quality are scarce. In studies performed in agroforestry experiments in the Zona da Mata, aspects of SOM quality were not investigated so far.
In Brazil, no-tillage has been broadly spread as a management alternative to increase SOM levels in different ecosystems (Machado and Silva, 2001; Bayer et al., 2000; D’Andrea et al., 2002; Leite et al., 2003; Sisti et al., 2004). However, little attention has been paid to other options of land use such as agroforestry systems in restoring SOM.
General hypotheses and objectives
6 organic residues on the chemical and structural characteristics of humic substances in both systems.
Outline of the Thesis
7 References
Bayer, C., Mielniczuk, J., Amado, T.J.C., Martin-Neto, L., Fernandes, S.V., 2000. Organic matter storage in a sandy clay loam Acrisol affected by tillage and cropping systems in southern Brazil. Soil and Tillage Research, 54: 101-109. Cardoso, I.M., 2002. Phosphorus in agroforestry systems: a contribution to sustainable agriculture in the Zona da Mata of Minas Gerais, Brazil. Wageningen University: Netherlands. 133 p. (PhD thesis).
Cardoso, I.M., Guijt, I., Franco, F.S., Carvalho, A.F., Ferreira Neto, P.S., 2001. Continual learning for agroforestry system design: university, NGO and farmer partnership in Minas Gerais, Brazil. Agricultural Systems, 69, 235-257.
D’Andréa, A.F., Silva, M.L.N., Curi, N., Siqueira, J.O., Carneiro, M.A.C., 2002. Biological indicator attributes of soil quality under management systems in the Cerrado region of the southern Goiás state, Brazil. Revista Brasileira de Ciência do Solo, 26: 913-923.
Dean, W., 1998. A ferro e fogo: a história e a devastação da Mata Atlântica
Brasileira. 2nd Ed. Companhia das Letras, São Paulo, BR.
Ding, G., Liu, X., Herbert, S., Novak, J., Amarasiriwardena, D., Xing, B., 2006. Effect of cover crop management on soil organic matter. Geoderma, 130: 229– 239.
Ferrari, E.A., 1996. Desenvolvimento da agricultura familiar: a experiência do CTA-ZM. In: Alvares, V.H., Fontes, L.E.F., Fontes, M.P.F. (Eds). O Solo nos
Grandes Domínios Morfoclimáticos do Brasil e o Desenvolvimento Sustentado,
JARD: Viçosa. p. 233-250.
Jose, S., 2009. Agroforestry for ecosystem services and environmental benefits: an overview. Agroforestry Systems, 76: 1-10.
Leite, L.F.C., Mendonça, E.S., Machado, P.L.O.A., Matos, E.S., 2003. Total C and N storage and organic C pools of a Red-Yellow Podzolic under conventional and no tillage at the Atlantic Forest Zone, south-eastern Brazil. Australian Journal
of Soil Research, 41: 717-730.
Machado, P.L.O.A., Silva, C.A., 2001. Soil management under no-tillage systems in the tropics with special reference to Brazil. Nutrient Cycling in
Agroecosystems, 61: 119-130.
Mafongoya, P.L.; Giller, K.E., Palm, C.A., 1998. Decomposition and nitrogen release patterns of tree prunings and litter. Agroforestry Systems, 38: 77-97.
Manlay, R.J., Feller, C., Swift, M.J., 2007. Historical evolution of soil organic matter concepts and their relationships with the fertility and sustainability of cropping systems. Agriculture, Ecosystems and Environment, 119, 217–233. Mathers, N.J.; Mao, X.A.; Xu, Z.H.; Saffigna, P.G.; Bernes-Price, S.J.; Perera, M.C.S., 2000. Recent advances in the application of 13C and 15N NMR spectroscopy to soil organic matter studies. Australian Journal of Soil Research, 38: 769-787.
8 Rovira, P., Vallejo, V.R., 2002. Labile and recalcitrant pools of carbon and nitrogen in organic matter decomposing at different depths in soil: an acid hydrolysis approach. Geoderma, 107: 109-141.
Schoeneberger, M.M., 2009. Agroforestry: working trees for sequestering carbon on agricultural lands. Agroforestry Systems, 75: 27-37.
Scholes, M.C., Powlson, D., Tian, G., 1997. Input control of organic matter dynamics. Geoderma, 79:25-47.
Sisti, C.P.J., Santos, H.P., Kohhann, R., Alves, B.J.R., Urquiaga, S., Boddey, R.M., 2004. Change in carbon and nitrogen stocks in soil under 13 years of conventional or zero tillage in southern Brazil. Soil and Tillage Research, 76: 39-58.
Souza, H. N., 2006. Sistematização da experiência participativa com Sistemas Agroflorestais: rumo à sustentabilidade da agricultura familiar na Zona da Mata mineira. Viçosa: Universidade Federal de Viçosa, 157 p. (Dissertação de Mestrado).
Stevenson, F.J., 1994. Humus chemistry: genesis, composition, reactions. 2 ed. New York, John Wiley & Sons, 496p.
Swift, R.S., 1996. Organic matter characterization. In: Sparks, D.L., Page, A.L., Helmke, P.A., Loeppert, R.H., Soltanpour, P.N., Tabatabai, M.A., Johnston, C.T., Summer, M.E. (Eds). Methods of soil analysis. Madison: Soil Science Society of America/American Society of Agronomy. Part 3. Chemical methods. p.1011-1020 (Soil Science Society of America Book, series 5).
Valverde, O., 1958. Estudo regional da Zona da Mata, de Minas Gerais. Revista
Brasileira de Geografia, 20, 3-82.
Young, A., 1997. Agroforestry, soil management and sustainability. In: Young, A.
Agroforestry for soil management (Eds.). 2nd ed. CAB international, ICRAF:
9 CHAPTER 2
Soil organic C, N and P storage in areas under agroforestry- and full sun coffee systems at the Atlantic Coastal Rainforest, southeastern Brazil
Abstract – Although agroforestry can be considered a potential alternative for sequestering C on a global scale, quantitative data on specific systems in a field scale in Brazilian soils are still scarce. This study aimed i) to measure the stocks of organic C, N and P in bulk soil and different pools of soil organic matter (SOM) in areas under agroforestry-coffee and full-sun coffee systems, and ii) to detect the influence of the quality of organic residues derived from trees on the patterns of C, N and P storage. The work was carried out in three smallholding coffee production areas under agroforestry- (AGF) and full-sun coffee (FSC) systems located in the municipalities of Divino and Araponga in the Atlantic Coastal Forest biome in the state of Minas Gerais, Brazil. Soil samples were collected from 0-5, 5-10, 10-20 and 20-40 cm-deep intervals. C, N and P stocks were measured in the whole soil and in humic substances. Microbial C and N and C-CO2 emissions were quantified. The lability of SOM was evaluated by the fractionation of soil organic C under different degree of oxidization. Soil organic C stocks in the coffee-cultivated lands varied from 1.36 to 3.92 kg m-2 in all evaluated sites. In general, there were no significant differences in the soil C, N and P stocks between AGF and FSC systems in all evaluated sites, exception to soil total P stocks in Araponga(II) at 20-cm soil depth. The stocks of C, N and P were variable across all evaluated sites. No clear tendency could be addressed to the effect of soil management. The potential of CO2-C emission per month in the 0-10 cm soil depth in the AGF systems were 1,221; 594 and 1,005 kg CO2-C ha-1 in Divino, Araponga(I) and Araponga(II), respectively. In Divino, soil relatively large metabolic quotient (qCO2) in the AGF system seems to be more related to the greater levels of more available C content derived from tree-residues. In Divino and Araponga(I), the AGF system tend to increase the proportion of easily oxidizable C. The adoption of AGF management resulted in the increase of the carbon management index in all sites, suggesting the rehabilitation or enhancement of SOM levels. Under a qualitative point of view of SOM, agroforestry systems represent a more attractive option of management for increasing the proportion of more labile C forms. Other relevant aspects that were not object of our investigation, such as root-systems dynamics, need to be better understood and measured in order to obtain a more realistic analysis of the effect of agroforestry management on the C sequestration in the region.
10 1. Introduction
Carbon (C) sequestration in agricultural lands is considered an important strategy of management to deal with the problems of global warming (Lal, 1997; Scholes and Noble, 2001). Soil presents 3.5 times more C than the atmosphere (760 Gt) and 4.5 times the size of biotic pool (560 Gt) (Lal, 2004). This magnitude on the C storage makes soil one of most important factors in the changes of C cycling in the ecosystem.
The evaluation of changes in the SOM as a result of land use and management is important to identify strategies to increase agricultural production avoiding soil degradation and decreasing the emission of greenhouse gases (Freixo et al., 2002). The conversion of native forests into agricultural systems promotes decreases in soil C and N stocks due to reductions of organic inputs and increase of SOM mineralization and soil erosive process (Bayer and Mielniczuk, 1997; Marchiori Junior and Melo, 2000; Leite et al., 2003). The magnitude and extension of SOM decline, however, depends on the method of conversion, soil management intensity after conversion and physical and chemical soil properties (Lugo and Brown, 1993).
Among other factors, soil management has a marked influence on SOM dynamics in agricultural systems. It is assumed that: i) several SOM fractions respond in a specific way to management and land-use practices; ii) the synthesis and decomposition of these fractions are regulated by physical, chemical and biological factors that can be altered by management (Fernandes et al., 1997).
11 storage in no-tillage management range from 0.1 to 0.3 Mg C ha-1 yr-1 (Lal, 2004; Carvalho et al., 2009). Machado and Silva (2001) reported that soils under no-tillage can storage (0-10 cm layer) on average 25.1 Mg C ha-1 compared to 19.9 Mg C ha-1 in conventional cultivation, and that the reductions of C in relation to a reference area were significantly lower in no-tillage compared to conventional systems. Despite the potential of no-tillage to increase C storage in Brazilian soils, little attention has been paid to other options of land use, such as agroforestry systems, in restoring SOM (Albrecht and Kandji, 2003).
Schroeder (1994) stated that regarding the climate change issue, agroforestry could be considered for at least two reasons: i) tree component fixes and stores C from the atmosphere via photosynthesis; and ii) agroforestry can reduce the need of deforestation for agriculture by providing alternatives to shifting cultivation.
Nevertheless, a realistic potential of agroforestry systems to increase SOM storage remain unknown due to the lack of reliable estimates on the extent of the area under agroforestry systems in different ecological zones. Furthermore, the C sequestered in agroforestry systems varies with system-specific characteristics, including climate, soil type, treeplanting densities, and tree management (Montagnini and Nair, 2004).
12 stated that smallholder agroforestry systems have the potential to increase C storage in a rate of 1.5 to 3.5 Mg C ha-1 yr-1.
Some attempts have been started in the region of Zona da Mata (Atlantic Coastal Rainforest Biome) by adopting agroforestry systems in smallholding coffee production areas (Ferrari, 1996). According to Mendonça and Stott (2003), agroforestry represents a potential to solve part of the agricultural problems in this region, since it can contribute to reduce soil erosion (Franco et al., 2002) and enhance nutrients and C cycling (Mendonça et al., 2001). However, only few data have been generated confirming the potential of agroforestry on the soil C sequestration in the Atlantic Forestry Biome. Besides, since C cycle is closely related to N and P cycles in the soil (Stevenson and Cole, 1999), data on the N and P stocks are equally necessary to improve the knowledge of the effects of agroforestry on the dynamics of these nutrients.
13 the quality of organic residues derived from trees on the patterns of C, N and P storage.
2. Materials and methods
2.1. General description of study area
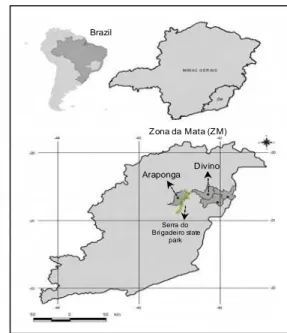
The study was carried out in the Zona da Mata (about 36,000 km2), located in the Atlantic Coastal Rainforest biome of the state of Minas Gerais, Brazil (Figure 1). The region is characterized by a tropical highland climate (average temperature and precipitation of 18 °C and 1500 mm, respectively, with 2 to 4 months of dry period), steep slopes (20 to 45%) and altitudes ranging from 200 to 1800 m (Cardoso, 2002). The parental rock is gneiss and the dominant soil types are deep and well drained Oxisols, which are acid and poor in nutrients (Ker, 1995; Mendonça and Stott, 2003). More detailed information on pedology, agriculture and sociology of the Zona da Mata region was previously published by Cardoso et al. (2001).
Figure 1. Localization of the municipalities of the study sites in the Zona da Mata (ZM), state of Minas Gerais.
Brazil
Zona da Mata (ZM)
Araponga Divino
Serra do Bri gadeiro state
14
2.2. Specific study sites and soil sampling
Three smallholder agroforestry coffee (Coffea arabica L.) systems (AGF) and three full sun coffee (FSC) systems fields with approximately 1.5 hectares and over 12 years of age were studied. These areas were situated at the municipalities of Divino and Araponga (Figure 1), managed by smallholding farmers. More detailed information about the historical land-use and management of the studied systems are presented in Box 1.
In each selected site, areas under natural forest fragments (NF) were sampled and used to represent the native or steady state condition of the soil. In all cases, NF fragments were at the same position on the landscape of the coffee-cultivated areas.
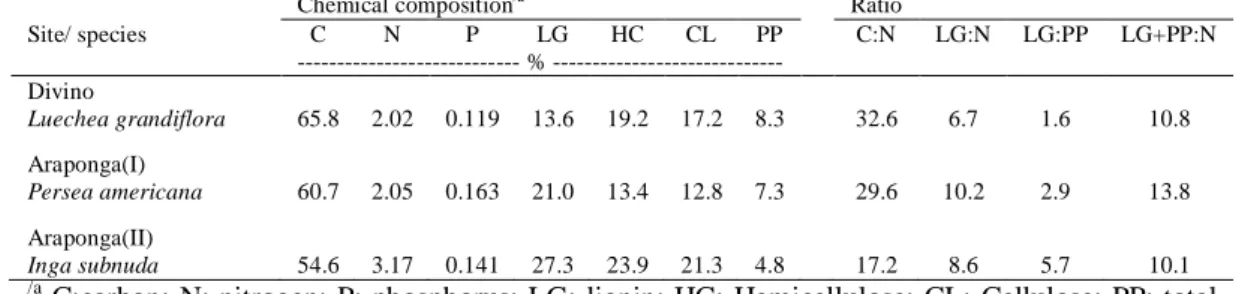
The chemical composition of senescent leaves of the main trees species used in the agroforestry systems was previously measured by Duarte (2007) and a summary is presented in Table 1.
Table 1. Chemical composition and C:N, LG:N, LG:PP and LG+PP:N ratios of senescent leaves of the main tree species in areas under agroforestry-coffee systems at three municipalities of Zona da Mata, Minas Gerais state
Chemical composition/a Ratio
Site/ species C N P LG HC CL PP C:N LG:N LG:PP LG+PP:N --- % ---
Divino
Luechea grandiflora 65.8 2.02 0.119 13.6 19.2 17.2 8.3 32.6 6.7 1.6 10.8 Araponga(I)
Persea americana 60.7 2.05 0.163 21.0 13.4 12.8 7.3 29.6 10.2 2.9 13.8 Araponga(II)
Inga subnuda 54.6 3.17 0.141 27.3 23.9 21.3 4.8 17.2 8.6 5.7 10.1
/a
15 Box 1. Historical of land use and management of selected sites
/1 Liquid biofertilizer for foliar application prepared from fresh manure diluted in water and enriched with bone meal,
blood, fish scraps (the latter two contributing minerals), and unrefined sugar and milk to stimulate fermentation. This mix is fermented anaerobically for about 1.5 months. Other organic liquid fertilizers include fermented, cattle urine and an infusion prepared from manure (Velásquez, 2002).
Divino (coordinate: 20º33’S, 42º11’W; altitude: 1,160 m)
Agroforestry-coffee system: Prior cultivation this area was deforested and use as pasture, cultivated with Melinis minutiflora P. Beauv. (common name: Capim gordura). Some tree species of Piptadenia gonoacantha J.F. Macbr. (Jacaré) spontaneously grew in the pasture area. The intensive use of soil with pasture for several years (exact time unknown) declined the soil quality. Agroforestry-coffee system was implemented in 1994. The study was concentrated in an area of approximately 3,150 m2 with 600 coffee-trees (Coffea Arabica L.) spaced in 3.5 m x 1.5 m. Native tree species were
intercropped with coffee. The main tree species is Luehea grandiflora Mart (Açoita-cavalo), although other species such as Aegiphila sellowiana Cham. (Papagaio), Erythrina verna Vell (Mulungu), Musa sp. L. (Banana) and Zeyheria tuberculosa (Vell.) Bur. (Ipê-preto) can be found. Fertilizers and limestone were not applied during the two first years of the establishment of agroforestry systems. After this period, 3 Mg of limestone were applied in the projection of coffee-tree canopy. From 1999 to 2002, 50 g per plant of a mixture of ammonium sulfate, potassium chloride and monocalcium phosphate in a proportion of 3-1-1 was applied in a rate of 4 applications per year, totalizing 200 g per plant. In 2000, the trees species intercropped with coffee were drastically pruned, and the residues were left on the soil surface between the coffee rows. From 2003 to 2006 the farmer started the transition to organic coffee and stopped the inorganic fertilization. During this period, cow manure, castor bean cake, residues of leguminous species, supermagro/1 and cattle urine were
applied (Table 2). The productivity during organic cultivation was approximately 1.5 kg of coffee (pulp removed) per plant. In 2007, the organic coffee production was interrupted. Since this year, 100 g per plant of N-P-K fertilizer (20-5-20) has been applied twice a year (Table 2). The lower branches of the trees are pruned every 2 years and the residues are left on the soil surface, between coffee rows. Sporadically, jackbean, pumpkin and castor bean are cultivated between coffee rows. The mean annual productivity in 2007, 2008 and 2009 were about 0.90, 0.72 and 0.60 kg of coffee per plant. Full sun coffee system: the historical of land use is identical to the previous described site. The forest was converted in pasture for several years (exact time unknown) and further in coffee cultivation. The area has approximately 2,000 m2 with 1,000 coffee trees spaced in 2 m x 1 m. There are no trees intercropped with coffee. Soil liming is not performed and there is no application of organic manure. Chemical fertilization of soil in 2007, 2008 and 2009 was done by applying 300, 200 and 150 g per plant of N-P-K (20-5-20). The mean annual productivity in 2007, 2008 and 2009 were 0.93, 1.2 and 0.06 kg of coffee per plant, respectively.
Araponga(I) (coordinate: 20º48’S, 42º32’W; altitude: 1,040 m)
Agroforestry-coffee system: In the past this area was deforested and used as pasture for several years (exact time is unknown). Then, coffee was cultivated under conventional management during 15 years, which resulted in severe reduction of soil fertility mainly caused by soil erosion. In 1995, agroforestry-coffee system was implemented in an area of approximately 5,040 m2 with 1,200 coffee-trees spaced in 3 m x 1.2 m. The system was established in the highest slope area of the farm. The main tree species intercropped with coffee is Persea americana Mill. (Abacate). Soil is limed once a year, and there is no chemical fertilizer application. Chicken manure was used in the organic fertilization in 2001. Cow manure is applied annually and foliar fertilization is done by using supermagro twice a year (Table 2). Spontaneous vegetation is slashed 1- or 2-times per year and the residues are kept on the soil. Bean straw is applied annually on the rows. The lower branches of the tree-canopy are pruned during the dry season (June-July), after coffee harvesting. The residues of prune are kept on the soil surface avoiding soil erosion. The annual productivity is around 0.62 kg of coffee per plant. Full sun coffee system: the historical of land use is identical to the previous described site. The area has approximately 4,000 m2 with 2,000 coffee trees spaced in 2 m x 1 m. The system was implanted in the lowest slope
position, immediately below of the agroforestry-coffee area. There are no trees intercropped with coffee, but corn and beans had been planted between coffee rows. Soil liming and N-P-K fertilizer (20-5-20) applications are performed annually (Table 2) and there is no organic fertilization. The annual coffee productivity is approximately 0.79 kg of coffee per plant.
Araponga(II) (coordinate: 20º41’S, 42º31’W; altitude: 1,040 m)
Agroforestry-coffee system: In the past this area was deforested and used as pasture for several years (exact time is unknown). Further, it was burned and cultivated with rice during 7 years. During rice cultivation the soil was usually plowed by animal traction. Rice cultivation caused severe soil erosion leading to a decline of soil quality. After rice the area was cultivated with corn and beans, and finally, it was converted in pasture for 3 years when soil achieved its lowest level of fertility. In order to reclaim the land, in 1994 Pennisetum purpureum Schum. cv. Napier (capim-napier) and trees species such as, Colubrina glandulosa Perkins (sobrasil), Hovenia dulcis Thunb. (uva-do-japão), Inga sessilis Mart. and Inga subnuda subsp. luschnathiana (Benth.) T.D. Penn. were planted. The Inga species were introduced later on and the other tree species were removed. In 1998, Agroforestry-coffee was implemented. Soil liming was done in 1999, 2001, 2004 and 2006 by adding 200 g of limestone per m2. The coffee field which includes the area covered by Inga species has
approximately 1,500 m2 with 500 coffee-trees spaced in 3 m x 1 m. At the beginning, corn and beans was usually
16 The more detailed characterization of the sites studied is presented in Table 2.
Table 2. Characterization of the agroforestry-coffee (AGF) and full-sun coffee (FSC) systems in the municipalities of Divino and Araponga.
Divino Araponga(I) Araponga(II)
Item AGF FSC AGF FSC AGF FSC
Area size, m2 3,150 2,000 5,040 4,000 1,500 7,500 Number of coffee trees 600 1,000 1,200 2,000 500 2,500 Spacing of coffee trees, m 3.5 x 1.5 2 x 1 3 x 1.2 2 x 1 3 x 1 3 x 1 Number of trees per ha 150 - 200 - 200 - ~150 - Fertilizer N-P-K (20-5-20), g/plant 100/b 150/c na 180 200/d 200/d
Cow manure, kg 10,000/e na 2,880 na na na
Castor bean residue, kg 600/e na na na na na
Compost, kg 5,000/e na na na na na
Limestone, g/m2 950/f na 20/g 40/g 200/h 200/h Foliar fertilization (supermagro) yes na yes na na na Biomass production/a (litter)
Coffee trees, kg/year 720 890 1,440 1,780 600 2,225
Trees, kg/year 2,398 - 2,004 - 4,331 -
/a
Coffee trees: estimated from Campanha et al. (2007) where litter production (dry matter) in agroforestry is 50.7 g m-2 month-1 and sun coffee system is around 37.2 g m-2 month-1; Other trees: measured by Duarte (2007);
/b
From 2006 to 2009, applied twice a year; From 1999 to 2002: 200 g plant-1 year-1 of a mixture of ammonium sulfate, potassium chloride and monocalcium phosphate in a proportion of 3-1-1;
/c
Performed in 2008; In 2006 and 2007, N-P-K (20-5-20) was applied on a rate of 150 and 100 g per plant, respectively, twice a year;
/d
applied once a year;
/e
Total applied during organic cultivation from 2003 to 2006; supermagro applied twice a year; na: not applied;
/f
applied in 1997;
/g
applied annually;
/h
total applied in 1999, 2001, 2004 and 2006.
air-17 dried, sieved through a 2-mm sieve and stored at room temperature. Selected physical and chemical characteristics of the studied soils are shown in Table 3.
Table 3. Values of particle sized fractions, pH (H20), cation exchange capacity (CEC) and base saturation of soils under native forest (NF), agroforestry coffee (AGF) and full sun coffee (FSC) systems at 0-10 cm layer in the municipalities of Divino, Araponga(I) and Araponga(II)
Divino Araponga(I) Araponga(II) Soil characteristic NF AGF FSC NF AGF FSC NF AGF FSC Particle size, g kg-1
Sand 504 573 519 493 520 495 474 388 444
Silt 237 122 165 108 119 124 124 113 134
Clay 259 305 316 399 361 381 402 499 422
pH H2O (1:2.5) 6.4 6.0 6.1 4.9 5.8 5.8 4.8 5.6 6.2
CEC, cmolc dm-3 21.4 11.1 11.6 16.6 11.1 10.1 17.7 12.2 11.0
Base saturation, % 77.0 69.0 63.0 2.0 46.0 51.0 1.0 30.0 40.0
2.3. Total soil organic carbon, nitrogen and phosphorus stocks
Soil organic C (SOC) was quantified by wet combustion with a mixture of potassium dichromate and sulfuric acid (Yeomans and Bremner, 1988). Soil total N (STN) was measured after sulfuric digestion followed by Kjedahl distillation (Tedesco et al., 1995). Soil total P (STP) was determined colorimetrically (Murphy and Riley, 1962) after digestion with H2SO4 – H2O2 (Bowman, 1988). For each soil layer (0-5, 5-10, 10-20 and 20-40 cm), the C, N and P stocks were calculated by multiplying the element concentration (g kg-1) by the soil bulk density (g cm-3) and to the thickness of the soil layer (cm). The result was divided by 100 to obtain stocks in kg m-2 (Fidalgo et al. 2007).
2.4. Soil microbial properties
18 NaOH and the excess of NaOH was quantified by titration with 0.25 M HCl. The CO2 production was then measured for 30 days (Anderson, 1982).
The microbial biomass C and N (MB-C, MB-N) were estimated by the irradiation-extraction method (Islam and Weil, 1998; Ferreira et al., 1999) by using 0.5 M K2SO4 as extractant. The MB-C and MB-N were measured in aliquots of irradiated and non-irradiated samples by wet combustion with a mixture of potassium dichromate and sulfuric acid (Yeomans and Bremner, 1988) and by digestion followed by Kjedahl distillation (Tedesco et al., 1995), respectively. The conversion factors for the calculation of MB-C and MB-N (Kc and Kn), used to convert the flux of soil C and N into microbial C and N, were 0.33 and 0.54, respectively (Brookes et al., 1985; Sparling and West, 1988). The metabolic quotient (qCO2) was calculated as follows: [basal respiration (mg CO2-C kg soil day-1)/MB-C] x 100. The results were expressed in mg CO2-C mg-1 MB-C day-1.
2.5. Soil humic substances
19 respectively. The P concentration in each extracted humic fraction was determined colorimetrically (Murphy and Riley, 1962) after digestion with H2SO4 – H2O2 (Bowman, 1988). The stocks of C, N and P (Mg ha-1) in the humic substances were calculated by multiplying the element concentration (%) by the soil bulk density (g cm-3) and to the thickness of the soil layer (cm).
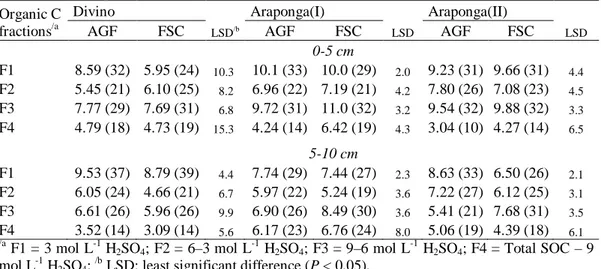
2.6. Soil organic carbon fractionation
Soil organic C fractionation was performed through adaptation of the method described by Chan et al. (2001). Organic C fractions were quantified by organic matter oxidation with potassium dichromate in an acid medium (Yeomans and Bremner 1988), by using different H2SO4 concentrations without external heating. The final H2SO4 concentrations were 3, 6 and 9 mol L-1, at a constant concentration of potassium dichromate. The amount of SOC oxidized in each concentration was separated into four fractions with different degrees of lability:
Fraction 1 (3 mol L-1 of H2SO4): oxidized SOC in 3 mol L-1 of H2SO4; Fraction 2 (6 – 3 mol L-1 of H2SO4): oxidized SOC between 6 and 3 mol L-1 of H2SO4;
Fraction 3 (9 – 6 mol L-1 of H2SO4): oxidized SOC between 9 and 6 mol L-1 of H2SO4, and Fraction 4 (Total SOC – 9 mol L-1 of H2SO4): oxidized SOC between Total SOC and 9 mol L-1 of H2SO4.
20 and CNL, respectively. The CPI and LI indexes were used to determine the Carbon Management Index (CMI), which was calculated as following: CMI = CPI x LI x 100. The CMI has been considered a sensitive index to measure the impact of soil management on the SOM levels (Blair et al., 1995).
2.7. Statistical analysis
The effect of soil management was tested by performing the analysis of variance (ANOVA) followed by the least significant difference (LSD at P < 0.05) post-hoc test. The t-test (P < 0.05) was applied assess the differences among estimated means (e.g. CL, CNL, CPI, L and LI indexes).
3. Results and discussion
3.1. Soil bulk density
21 Table 4. Soil bulk density (g cm-3) in areas under native forest (NF),
agroforestry-coffee (AGF) and full-sun agroforestry-coffee (FSC) systems in the municipalities of Divino, Araponga(I) and Araponga(II)
Soil depth
(cm)
Divino Araponga(I) Araponga(II)
NF AGF FSC lsd0.05 NF AGF FSC lsd0.05 NF AGF FSC lsd0.05
0-5 0.93 1.21 1.23 0.06 0.69 1.08 0.99 0.13 0.70 1.00 1.21 0.19 5-10 0.80 1.19 1.21 0.16 0.79 1.10 1.04 0.12 0.75 1.06 1.32 0.10 10-20 0.97 1.27 1.25 0.21 0.81 1.11 1.15 0.17 0.88 1.06 1.40 0.11 20-40 1.03 1.28 1.27 0.22 0.89 1.08 1.06 0.11 1.02 1.06 1.43 0.23 lsd: least significant difference (P < 0.05).
3.2. Total organic C contents in the soil and humic substances
22 Table 5. Total soil organic C (SOC) contents, organic C in fulvic acids (FA) and humic acids (HA), proportions of C in FA and HA in relation to SOC and humification rate (HR) index in soils under native forest (NF), agroforestry coffee (AGF) and full sun coffee (FSC) systems at 0- to 40-cm soil depth in the municipalities of Divino, Araponga(I) and Araponga(II)
System Soil depth (cm)
SOC Carbon, g kg-1 % SOC
(g kg-1) FA HA FA HA HR/a
Divino
NF 0-5 97.02 5.40 15.35 6 16 21.4
5-10 63.86 5.72 13.16 9 21 29.6
10-20 53.34 3.95 14.47 7 27 34.5
20-40 44.21 3.03 12.16 7 28 34.4
AGF 0-5 26.59 2.77 6.89 10 26 36.3
5-10 25.70 2.45 5.45 10 21 30.7
10-20 18.21 2.64 4.97 14 27 41.8
20-40 15.30 2.39 4.78 16 31 46.9
FSC 0-5 24.48 2.95 7.05 12 29 40.8
5-10 22.50 2.83 6.61 13 29 42.0
10-20 18.33 2.29 5.78 12 32 44.0
20-40 13.36 2.49 5.36 19 40 58.8
Araponga(I)
NF 0-5 77.00 7.23 18.30 9 24 33.2
5-10 60.96 8.21 13.84 13 23 36.2
10-20 47.94 7.05 9.77 15 20 35.1
20-40 22.87 5.54 3.34 24 15 38.8
AGF 0-5 31.05 6.01 8.89 19 29 48.0
5-10 26.78 5.77 8.60 22 32 53.7
10-20 20.09 6.01 7.81 30 39 68.8
20-40 17.20 5.49 4.60 32 27 58.7
FSC 0-5 34.58 4.07 7.15 12 21 32.4
5-10 27.93 3.76 6.11 13 22 35.3
10-20 24.11 4.02 6.29 17 26 42.8
20-40 22.36 3.61 4.87 16 22 37.9
Araponga(II)
NF 0-5 55.06 6.56 14.15 12 26 37.6
5-10 46.32 6.68 8.47 14 18 32.7
10-20 33.68 6.09 6.30 18 19 36.8
20-40 30.77 4.69 3.78 15 12 27.5
AGF 0-5 29.62 4.63 7.56 16 26 41.2
5-10 26.33 4.31 6.80 16 26 42.2
10-20 16.90 4.63 6.49 27 38 65.8
20-40 17.91 7.50 4.57 42 26 67.4
FSC 0-5 29.05 5.43 5.93 19 20 39.1
5-10 24.68 5.59 6.89 23 28 50.6
10-20 15.27 9.77 4.41 64 29 92.9
20-40 13.65 7.18 2.12 53 16 68.1
/a
HR = [CFA+HA/SOC] x 100.
23 translocation, whereas FSC is located at the downslope position which can be considered a condition of accumulation on the landscape.
In general, C contents in HA were higher than in FA in all evaluated sites (Table 5). The reductions of C contents in FA with the increase of soil depth were less accentuated than in HA due to the greater mobility of the FA fraction in the soil compared to HA (Stevenson, 1994). Regarding the whole soil profile (0-40 cm), C content in FA in the NF and cultivated sites accounted on average for 12 and 22% of SOC, respectively, whereas C contents in HA represented 21 and 27% of SOC, respectively. Humification rate (HR%) is a parameter that can provide quantitative information about the humic substance content normalized with respect to the total SOM (Dell’Abate et al., 2002). The HR was greater in FSC than AGF systems in Divino and Araponga(II) (Table 5), suggesting that at these sites, FSC systems favored the accumulation of humified compounds. A contrary pattern occurred in Araponga(I). Such behavior was more pronounced at soil surface (0-10 cm), where the effect of soil management is more expressive.
3.3. Soil total C, N and P stocks
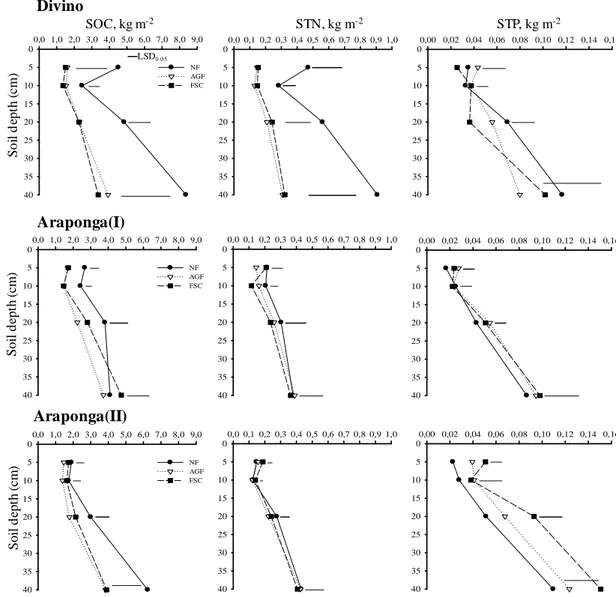
24 reference area, suggesting that soil cultivation leads to a decline in the SOM levels regardless of the type of soil management.
Figure 2. Soil total organic C, N and P stocks (SOC, STN, STP) at different soil depths in areas under native forest (NF), agroforestry-coffee (AGF) and full-sun coffee (FSC) systems in the municipalities of Divino, Araponga(I) and Araponga(II). Horizontal bars indicate the least significant difference (LSD, P < 0.05).
In general, there were no significant differences in the soil C, N and P stocks between the AGF and FSC systems in all evaluated sites, exception to STP stocks in Araponga (II) in the 20-cm soil depth. Even in Araponga(II), where the
0,00 0,02 0,04 0,06 0,08 0,10 0,12 0,14 0,16 0 5 10 15 20 25 30 35 40 0,0 0,1 0,2 0,3 0,4 0,5 0,6 0,7 0,8 0,9 1,0 0 5 10 15 20 25 30 35 40 0,0 1,0 2,0 3,0 4,0 5,0 6,0 7,0 8,0 9,0 0 5 10 15 20 25 30 35 40 NF AGF FSC
SOC, kg m-2 STN, kg m-2 STP, kg m-2
S o il d ep th (c m )
0,0 1,0 2,0 3,0 4,0 5,0 6,0 7,0 8,0 9,0 0 5 10 15 20 25 30 35 40 NF AGF FSC
0,0 0,1 0,2 0,3 0,4 0,5 0,6 0,7 0,8 0,9 1,0 0 5 10 15 20 25 30 35 40
0,00 0,02 0,04 0,06 0,08 0,10 0,12 0,14 0,16 0 5 10 15 20 25 30 35 40 S o il d ep th (c m )
0,0 1,0 2,0 3,0 4,0 5,0 6,0 7,0 8,0 9,0 0 5 10 15 20 25 30 35 40 NF AGF FSC
0,0 0,1 0,2 0,3 0,4 0,5 0,6 0,7 0,8 0,9 1,0 0 5 10 15 20 25 30 35 40
0,00 0,02 0,04 0,06 0,08 0,10 0,12 0,14 0,16 0 5 10 15 20 25 30 35 40 S o il d ep th (c m ) Divino Araponga(I) Araponga(II)
25 largest input of aboveground biomass occurred (4.3 Mg ha-1 year-1), SOC stocks were similar in both AGF and FSC systems. Since SOC stock calculation takes into account the bulk density, this response is probably more associated to the increase of soil bulk density in the FSC (Table 4) than the lack of effect of the SOM storage in the AGF system.
An increase of soil C storage has been pointed out as one of the most important benefits of AGFs in a global scale (Schoroeder, 1994; Albrecht and Kandji, 2003). Our results, however, suggest that it could not be generalized when evaluated in field scale because inherent factors such as climate, soil, topography, etc, can play a decisive role in the C dynamics. Besides, the quality of organic residues derived from trees also rules the pattern of SOM cycling (Mafangoya et al., 1998; Mendonça and Stott, 2003). Basically, two reasons can be drawn to explain the lack of changes in C, N and P storage in AGF comparison to FSC systems: i) there is a slow decomposition rate of the organic residues that, in turn, results in a slow rate of transfer of C and other nutrients from litter to soil; ii) On the contrary, there is a fast rate of decomposition of the residues that can accelerate SOM cycling, retarding C storage in a short-time.
26 Araponga(I), in which leaves had a smaller contribution on the total of biomass input compared to the other two sites, meanwhile flowers and fruits accounted with a greater proportion to C input (data not shown). The AGF system in Araponga(I) was implanted in a condition of huge slope, and it was common to verify the gravitational transportation of fruits from upper to lower positions of the slope. As a result of this behavior, there is a loss in the storage of C and other nutrients, especially at the upper soil depths in the AGF system.
Albrecht and Kandji (2003) highlighted that C sequestration in agroforestry systems is a dynamic process. At establishment, many systems used to lose C and N from vegetation and soil to atmosphere. Then, the following phase is characterized by a quick accumulation of tons of C that are stored in the trunks, stems, leaves and roots of trees and in the soil. At the end of the rotation period, part of the C will be released back to the atmosphere (Dixon, 1995). The benefits of agroforestry systems go beyond providing C restoration. These systems improve land cover in agricultural fields, as observed in Araponga(II). This has often reduced soil erosion (Franco et al., 2002), which is an essential process in the soil C dynamics.
27 affected by the slope position, and probably has influence of the deposition of materials from AGF, which is located in the upslope position. In Araponga(II), FSC increased C stocks in relation to the AGF system in 5.2 and 9.5 Mg ha-1 in the 0-10 and 0-40 cm layers, respectively. At this site, the increase of C storage in the FSC system has been influenced by the increasing of soil bulk density in all soil layers (Table 4). Therefore, the potential of the AGF system to restore soil quality must be analyzed not only with respect to the increase of SOM levels but it needs to take into account other benefits such as the enhancement of the soil physical quality and protection against erosive processes.
Table 6. Organic carbon storage (Mg ha-1) in soils under native forest, agroforestry-coffee and full sun-coffee systems in the municipalities of Divino, Araponga(I) and Araponga(II). Values in brackets are ± standard error (n=4) Soil depth (cm) Native Forest Agroforestry-coffee Full sun-coffee
Divino
0-5 45.1 (9.4) 16.0 (0.5) 15.0 (0.7)
5-10 24.4 (3.3) 15.3 (0.7) 13.6 (0.7)
Total 0-10 69.5 31.3 28.6
Total 0-40 201.6 93.5 85.0
Araponga(I)
0-5 26.6 (1.5) 16.9 (1.2) 17.2 (2.0)
5-10 24.2 (1.2) 14.5 (0.8) 14.5 (1.1)
Total 0-10 50.8 31.4 31.7
Total 0-40 129.9 91.0 107.3
Araponga(II)
0-5 19.0 (0.7) 14.6 (0.7) 17.4 (0.9)
5-10 17.4 (0.6) 13.9 (0.5) 16.3 (1.5)
Total 0-10 36.4 28.5 33.7
28
3.4. Soil microbial parameters
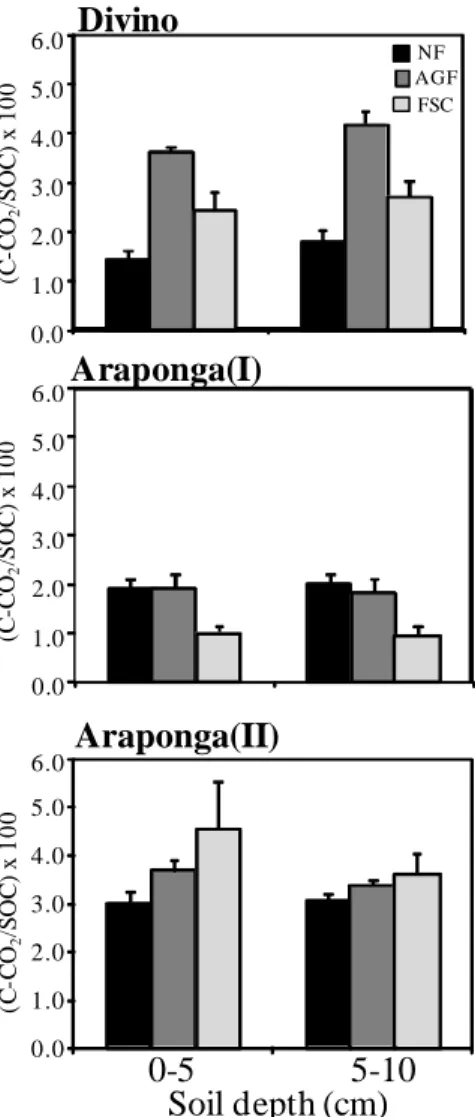
The estimate of CO2-C emission by the microbial biomass in the different agroecosystems is presented in Figure 3. In order to make comparable values among the systems, in each area the total amount of CO2-C produced was related to their respective total SOC content.
Figure 3. CO2-C emissions in function of total soil organic carbon (SOC) at different soil depths in areas under native forest (NF), agroforestry-coffee (AGF) and full-sun coffee (FSC) systems in three municipalities of Zona da Mata, Minas Gerais state.
(C -C O2 /S O C ) x 1 0 0 (C -C O2 /S O C ) x 1 0 0 0.0 1.0 2.0 3.0 4.0 5.0 6.0
Soil depth (cm)
29 In Divino, the CO2-C emissions in the AGF system accounted for 3.6 and 4.2% of SOC at the 0-5 and 5-10 cm layers, respectively, against 2.4 and 2.7% in the FSC system. A higher amount of CO2-C was also verified in AGF when compared to the FSC system in Araponga(I) for both soil layers. However, a similar pattern was not observed in Araponga(II). The larger emission of CO2-C in AGFs in Divino and Araponga(I) imply that this system presented the highest level of microbial activity, which may result in a higher potential to act as sink of C to the atmosphere under a possible condition of soil disturbance. The CO2-C production trends reinforce the hypothesis of two opposite patterns on SOM cycling between Divino and Araponga(II), and it seems to be directly influenced by the quality of the organic residues in each situation.
The potential of CO2-C emission per month of evaluation in the 0-10 cm soil depth (Table 7) for the AGF systems were 1,221; 594 and 1,005 kg CO2-C ha -1
30
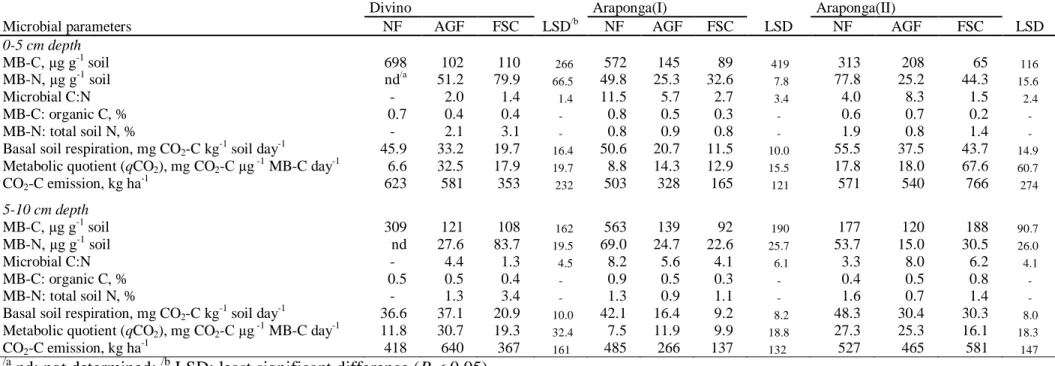
Table 7. Microbial biomass C and N, microbial-C to N ratio, microbial-C to organic C ratio, microbial-N to total N ratio, basal respiration, metabolic quotient and total CO2-C production in soils under native forest (NF), agroforestry-coffee (AGF) and full-sun coffee (FSC) systems at three municipalities of Zona da Mata, Minas Gerais state
Divino Araponga(I) Araponga(II)
Microbial parameters NF AGF FSC LSD/b NF AGF FSC LSD NF AGF FSC LSD
0-5 cm depth
MB-C, µg g-1 soil 698 102 110 266 572 145 89 419 313 208 65 116
MB-N, µg g-1 soil nd/a 51.2 79.9 66.5 49.8 25.3 32.6 7.8 77.8 25.2 44.3 15.6
Microbial C:N - 2.0 1.4 1.4 11.5 5.7 2.7 3.4 4.0 8.3 1.5 2.4
MB-C: organic C, % 0.7 0.4 0.4 - 0.8 0.5 0.3 - 0.6 0.7 0.2 -
MB-N: total soil N, % - 2.1 3.1 - 0.8 0.9 0.8 - 1.9 0.8 1.4 -
Basal soil respiration, mg CO2-C kg-1 soil day-1 45.9 33.2 19.7 16.4 50.6 20.7 11.5 10.0 55.5 37.5 43.7 14.9 Metabolic quotient (qCO2), mg CO2-C µg -1 MB-C day-1 6.6 32.5 17.9 19.7 8.8 14.3 12.9 15.5 17.8 18.0 67.6 60.7
CO2-C emission, kg ha-1 623 581 353 232 503 328 165 121 571 540 766 274
5-10 cm depth
MB-C, µg g-1 soil 309 121 108 162 563 139 92 190 177 120 188 90.7
MB-N, µg g-1 soil nd 27.6 83.7 19.5 69.0 24.7 22.6 25.7 53.7 15.0 30.5 26.0
Microbial C:N - 4.4 1.3 4.5 8.2 5.6 4.1 6.1 3.3 8.0 6.2 4.1
MB-C: organic C, % 0.5 0.5 0.4 - 0.9 0.5 0.3 - 0.4 0.5 0.8 -
MB-N: total soil N, % - 1.3 3.4 - 1.3 0.9 1.1 - 1.6 0.7 1.4 -
Basal soil respiration, mg CO2-C kg-1 soil day-1 36.6 37.1 20.9 10.0 42.1 16.4 9.2 8.2 48.3 30.4 30.3 8.0 Metabolic quotient (qCO2), mg CO2-C µg -1 MB-C day-1 11.8 30.7 19.3 32.4 7.5 11.9 9.9 18.8 27.3 25.3 16.1 18.3
CO2-C emission, kg ha-1 418 640 367 161 485 266 137 132 527 465 581 147
/a
nd: not determined; /b LSD: least significant difference (P < 0.05).
31 In Araponga(I), MB-C contents tended to be higher in AGF than FSC even though larger qCO2 was observed in AGF in both soil layers (Table 7), reinforcing the previous patterns found in Divino. In Araponga(II), the qCO2 in AGF tended to be lower than the FSC system at soil surface (Table 7), suggesting a better efficiency in the use of substrate-C, which reflected a significant increase in the MB-C. The improvement of the microbial efficiency in the AGF system might be attributed to a shift in the soil microbial community from bacteria to fungal dominance. It has been suggested because there was a significant increase on MB-C:N ratio, from 1.5 in FSC to 8.3 in AGF (Table 7). An increase in fungal-to-microbial biomass ratios has been reported as a result of large fungal-to-microbial biomass C-to-N ratios (Salamanca et al., 2001). Zhang et al. (2007), studying microbial biomass dynamics and soil wettability, also found that the intensity and frequency of wetting and drying cycles caused an increase in soil microbial C-to-N ratio due to a dominance of fungal instead of bacterial community. Regarding the high content of lignin in the litter from the AGF system in Araponga(II) (Table 1), our findings are well consistent with the previous findings, since fungi are considered the most important degraders of lignin (Fukushima and Kirk, 1995; Tuor et al., 1995). Therefore, further direct measurements of fungal biomass and microbial community are needed.
32 upper soil layer tended to be consistently higher in AGF than FSC, probably as a result of the increase in the efficiency of the substrate used by the microbiota. MB-N: the total N ratio averaged 2.5; 0.9 and 1.0% in Divino, Araponga(I) and Araponga(II), respectively. In general, FSC systems showed larger MB-N: total N ratio than AGF systems. The immobilization of N into microbial biomass in the FSC systems can be associated to the incorporation of fresh residues of leguminous species (e.g. beans) into soil surface, which are often cropped between coffee rows. These results are in accordance with the findings of Xavier et al. (2006) in areas under organic cropping cultivation.
3.5. C, N and P stocks in the humic substances
The stocks of C, N and P in the soil FA and HA fractions are presented in Figures 4, 5 and 6. In Divino soils (Figure 4), stocks of C, N and P were relatively greater in HA than FA. At this site, FA, HA and Humin (HUM, data not shown) from cultivated areas accounted for 13, 28 and 56% of SOC and 15, 38 and 47% of STN, respectively. The proportions of P contents in humic substances in relation to STP varied according to soil management. In the FSC system, FA, HA and HUM represented 5, 10 and 86% of STP, respectively. However, these proportions changed to 10, 20 and 23% in the AGF system.
33 and STN stocks (Figure 2). On the other hand, AGF showed significant increases on the P stocks in the FAs and HAs compared to the FSC system.
Figure 4. Stocks of carbon, nitrogen and phosphorus in fulvic and humic acids fractions in soils under native forest (NF), agroforestry-coffee (AGF) and full-sun coffee (FSC) systems in the municipality of Divino, Minas Gerais state. Horizontal bars indicate the least significant difference (LSD, P < 0.05).
In Araponga(I), the stocks of C and N were quite similar in FAs and HAs (Figure 5). The P stocks, in turn, were higher in HAs than FAs. A significant increase in the C stocks occurred in FAs in AGF, compared to the FSC system in almost all soil profile. At this site, FAs accounted for 26 and 15% of SOC in AGF and FSC, respectively. A similar pattern was verified in HAs, where greater C stocks were registered in AGF compared to FSC, mainly at soil surface.
0 40 80 120 380 390 400 0 5 10 15 20 25 30 35 40 0,0 0,3 0,6 0,9 1,2 1,5 3,8 4,0 0 5 10 15 20 25 30 35 40
0 1 2 3 4 5 6 7 24 25
0 5 10 15 20 25 30 35 40 NF AGF FSC
C, Mg ha-1 N, Mg ha-1 P, kg ha-1
Fulvic acids S o il d ep th (cm )
0 5 10 15 20 25
0 5 10 15 20 25 30 35 40 NF AGF FSC
0,0 0,8 1,6 2,4 3,2 4,0
0 5 10 15 20 25 30 35 40
0 80 160 240 320 400
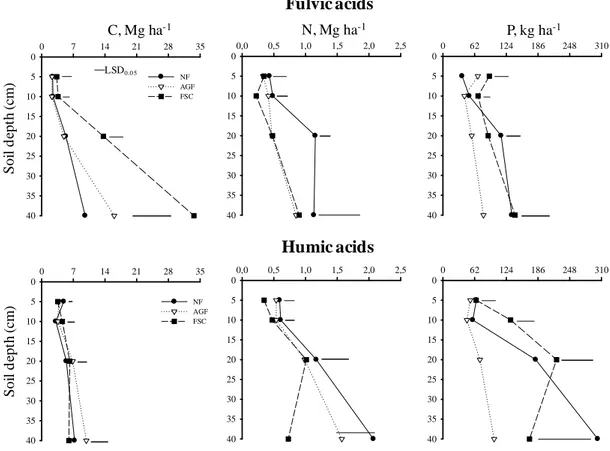
34 Figure 5. Stocks of carbon, nitrogen and phosphorus in fulvic and humic acids fractions in soils under native forest (NF), agroforestry-coffee (AGF) and full-sun coffee (FSC) systems in the municipality of Araponga(I), Minas Gerais state. Horizontal bars indicate the least significant difference (LSD, P < 0.05).
In general, the N stocks followed a behavior similar to that of C, but significant differences between the AGF and FSC systems were only verified at 40-cm depth for FAs and at 0-to 5- and 5- to 10-cm depths for HAs. In both conditions, AGF presented significant higher N contents. The trends for P stocks in the humic substances in Araponga(I) were conversely different from Divino (Figure 4). Significant higher P stocks occurred in FSC compared to the AGF system for both FAs and HAs, except for HAs at 20 to 40-cm soil depth. It suggests that most part of the organic P in AGF is associated to the most stable humic fraction (Humin), whereas FSC favors increases of P in the least stable fractions. It might indicate that P cycling in the FSC system can occur faster than in AGF, which has most part of organic P stabilized. One possible explanation for
0,0 2,5 5,0 7,5 10,0 12,5 15,0 0 5 10 15 20 25 30 35 40 NF AGF FSC
0,0 0,7 1,4 2,1 2,8 3,5 0 5 10 15 20 25 30 35 40
0 40 80 120 160 200
0 5 10 15 20 25 30 35 40
0 20 40 60 180 190 200
0 5 10 15 20 25 30 35 40
P, kg ha-1
0,0 0,7 1,4 2,1 2,8 3,5 0 5 10 15 20 25 30 35 40
N, Mg ha-1
0,0 2,5 5,0 7,5 10,0 12,5 15,0 0 5 10 15 20 25 30 35 40 NF AGF FSC
C, Mg ha-1
35 this behavior is that in the AGF system, the organic P in FAs and HAs has been potentially mineralized in order to supply the requirements for available P, since no inorganic P fertilizers are used in this area. NaOH-Po pool has been considered an important P source for the crop in low P-input systems (Guo et al., 2000; Verma et al., 2005).
In Araponga(II), no significant differences occurred in the C and N stocks for both FAs and HAs between the AGF and FSC systems at the soil surface (Figure 6). However, there were significant increases in the C stocks of the FAs fraction in FSC, compared to the AGF system at 20 and 40-cm soil depth. Opposite trend occurred in the HAs at 40-cm soil depth, where AGF presented higher C and N stocks than FSC system.
Figure 6. Stocks of carbon, nitrogen and phosphorus in fulvic and humic acids fractions in soils under native forest (NF), agroforestry-coffee (AGF) and full-sun coffee (FSC) systems in the municipality of Araponga(II), Minas Gerais state. Horizontal bars indicate the least significant difference (LSD, P < 0.05).
0,0 0,5 1,0 1,5 2,0 2,5
0 5 10 15 20 25 30 35 40
0 62 124 186 248 310
0 5 10 15 20 25 30 35 40
0 7 14 21 28 35
0 5 10 15 20 25 30 35 40 NF AGF FSC
0 62 124 186 248 310
0 5 10 15 20 25 30 35 40
0,0 0,5 1,0 1,5 2,0 2,5
0 5 10 15 20 25 30 35 40
0 7 14 21 28 35
0 5 10 15 20 25 30 35 40 NF AGF FSC
P, kg ha-1
N, Mg ha-1
C, Mg ha-1
Fulvic acids Humic acids So il d ep th (c m )
LSD0.0 5
36 The increase of C stocks in FAs with increase of soil deep in the FSC systems indicate that larger amounts of most easily oxidizible humic fraction have been lost to the deepest soil layers, whereas in AGF system C stocks in FAs followed similar trend of the reference area. The greater C and N stocks in HAs at the deepest soil layer in AGF compared to FSC can be an indicative of the influence of cycling of the tree root system. The stocks of P in FAs and HAs in the FSC system tended to be higher than AGF. Similar patterns were verified in Araponga(I) soils (Figure 5) but differed from site at Divino (Figure 4).
The organic P dynamics in the humic substances seems to be closely related to the quality of organic residues in the AGF systems. For instance, C:P ratios of litter at Divino (553) was larger than the sites at Araponga (I) (372) and Araponga(II) (387). We believe that organic P in humic substances has been an important source for P supplying in the AGF systems. Further investigations are needed to stress the role of organic P in areas under agroforestry management.
3.5. Soil organic carbon fractionation