SAULO ALVES SANTOS DE OLIVEIRA
GENETIC STRUCTURE, AGGRESSIVENESS AND FUNGICIDE SENSITIVITY OF Phytophthora infestans POPULATIONS FROM THE SOUTH AND
SOUTHEAST REGIONS OF BRAZIL
Tese apresentada à Universidade Federal de Viçosa, como parte das exigências do Programa de Pós-Graduação em Fitopatologia, para obtenção do título de Doctor Scientiae.
VIÇOSA
SAULO ALVES SANTOS DE OLIVEIRA
GENETIC STRUCTURE, AGGRESSIVENESS AND FUNGICIDE SENSITIVITY OF Phytophthora infestans POPULATIONS FROM THE SOUTH AND
SOUTHEAST REGIONS OF BRAZIL
Tese apresentada à Universidade Federal de Viçosa, como parte das exigências do Programa de Pós-Graduação em Fitopatologia, para obtenção do título de Doctor Scientiae.
APROVADA: 12 de novembro de 2010.
Prof. Luiz Antonio Maffia
(Coorientador) Prof. Sérgio H. Brommonschenkel (Coorientador)
Pesq. Ailton Reis Pesq. Cesar Bauer Gomes
ii À Deus, senhor da minha vida.
AGRADEÇO
A todos os Professores da UFV UFRPE e da UESB, que direta ou indiretamente, contribuíram para este momento.
DEDICO
Ao meu pai Jaime e minha mãe Ariádenes, aos meus irmãos Thiago e Lucas e minha noiva Vanessa.
iii
AGRADECIMENTOS
Ao professor Eduardo Mizubuti pela orientação, amizade e por todo apoio que me foi dado;
À Universidade Federal de Viçosa (UFV), pelo apoio institucional, ao Conselho Nacional de Desenvolvimento Científico e Tecnológico (CNPq), pela concessão da bolsa de estudos e, a Fundação de Amparo à Pesquisa do Estado de Minas Gerais (FAPEMIG), pelo financiamento do projeto;
Aos professores Luiz Maffia, Sérgio Brommonschenkel e demais professores e alunos do programa de Pós-Graduação em Fitopatologia da UFV pela atenção, ensinamentos e disponibilidade;
Aos doutores Cesar Bauer Gomes e Ailton Reis, pela disponibilidade e ajuda com o vasto conhecimendo sobre P. infestans.
À Sarah, Robson, Leonardo, Braz, Lahyre, Carine, Lillian, Claudinei, Pollyana, Raquel, Thaís e Jaime, que fazem parte da grande família que é o BIOPOP;
A todos os amigos, colegas e professores da UESB e UFRPE, especialmente aos professores Adalberto Brito e Sami Michereff ;
Aos meus pais, irmãos, avós, parentes e noiva por todo apoio e incentivo;
iv
BIOGRAFIA
Saulo Alves Santos de Oliveira, filho de Jaime Evangelista de Oliveira Filho e Ariádenes Alves Santos de Oliveira, nasceu na cidade de Alagoinhas – BA, no dia 10 de Agosto de 1982.
Concluiu o ensino médio na Cooperativa Educacional de Eunápolis, em Eunápolis – BA, no ano de 1999.
Graduou-se Engenheiro Agrônomo pela Universidade Estadual do Sudoeste da Bahia (UESB), em Vitória da Conquista -BA, no ano de 2006.
Obteve o título de Mestre em Fitopatologia pela Universidade Federal Rural de Pernambuco (UFRPE), em Fevereiro de 2008.
v
ÍNDICE
Página
RESUMO... vii
ABSTRACT... ix
INTRODUÇÃO GERAL... 1
REFERÊNCIAS BIBLIOGRÁFICAS... 5
Capítulo 1 1. Characterization and temporal analysis with SSR markers of Phytophthora infestans isolates from Brazil reveal population admixture, sexual recombination and bottleneck effects…………..…. 7
1.1. Abstract... 7
1.2. Introduction... 8
1.3. Material and Methods... 10
1.4. Results... 15
1.5. Discussion... 18
1.6. Acknowledgments... 23
1.7. References... 24
Capítulo 2 2. Assessment of the aggressiveness of Phytophthora infestans isolates sampled in 2008-2010…….………....….. 42
2.1. Abstract... 42
2.2. Introduction... 43
vi
2.4. Results... 47
2.5. Discussion... 49
2.6. Acknowledgments... 52
2.7. References... 53
Capítulo 3 3. Sensitivity to protectant and systemic fungicides of isolates of Phytophthora infestans collected from potato and tomato fields in Brazil………..….. 63
3.1. Abstract... 63
3.2. Introduction... 64
3.3. Material and Methods... 66
3.4. Results... 69
3.5. Discussion... 72
3.6. Acknowledgments... 76
3.7. References... 76
vii
RESUMO
OLIVEIRA, Saulo Alves Santos de, D.Sc., Universidade Federal de Viçosa, novembro de 2010. Estrutura genética, agressividade e sensibilidade a fungicidas de populações de Phytophthora infestans das regiões sul e
sudeste do Brasil. Orientador: Eduardo Seiti Gomide Mizubuti. Co-orientadores: Luiz Antonio Maffia e Sérgio Hermínio Brommonschenkel.
viii
ix
ABSTRACT
OLIVEIRA, Saulo Alves Santos de, D.Sc., Universidade Federal de Viçosa, November, 2010. Genetic structure, aggressiveness and fungicide sensitivity of Phytophthora infestans populations from the south and
southeast regions of Brazil. Adviser: Eduardo Seiti Gomide Mizubuti. Co-advisers: Luiz Antonio Maffia and Sérgio Hermínio Brommonschenkel.
x
1
INTRODUÇÃO GERAL
A batateira (Solanum tuberosum L.) e o tomateiro (Solanum lycopersicum L.) são as espécies olerícolas mais importantes para o Brasil. A maior parte da produção de batata e tomate está concentrada nos estados da região Sudeste e Sul, além da Bahia e Goiás nas regiões Nordeste e Centro-Oeste, respectivamente (IBGE 2008). Atualmente, a batata é a quarta cultura mais importante do mundo sendo que mais de um terço da produção global de batata é oriunda de países em desenvolvimento (CIP 2007). A produção mundial anual é de aproximadamente 300 milhões de toneladas enquanto a produção brasileira é de 3,1 milhões de toneladas (FAO 2006). Países como China e Rússia são os maiores produtores desta olerícola. A cultura do tomate, antes considerada atividade de pequenas propriedades, vem experimentando rápida expansão, especialmente na China e nos Estados Unidos (Kemmitt 2002). A produção mundial em 2006 chegou a mais de 123 milhões de toneladas e o Brasil é o 9º maior produtor, com aproximadamente 3,3 milhões de toneladas (FAO 2006).
2
produtores de batata podem efetuar até 30 aplicações de agroquímicos para controlar doenças (Nazareno & Jaccound Filho 2003).
A espécie P. infestans pertence ao reino Stramenopila, filo Oomycota, classe Peronosporomycetidae, ordem Pythiales família Pythiaceae (Petersen & Rosendahl 2000; Kroon at al. 2004). A reprodução, quando em sua forma assexuada, ocorre com a produção de esporângios (zoosporângios) e zoósporos (Ristaino & Gumpertz 2000; Vargas et al. 2009). A reprodução sexuada resulta na produção de oósporos, entretanto, como a espécie é heterotálica, com dois grupos de compatibilidade (A1 e A2), a reprodução sexuada ocorre somente quando indivíduos de ambos os grupos acasalam (Erwin & Ribeiro 1996; Flier et al. 2003). Os oósporos são capazes de se manterem viáveis no solo na ausência de hospedeiro (Widmark et al. 2007).
Até o final da década de 1970 ou início de 1980 apenas no planalto central do México eram encontrados os dois grupos de compatibilidade de P. infestans (Gómez-Alpizar et al. 2007). No restante do mundo, a população do patógeno era dominada por uma linhagem clonal, US-1, cujos isolados apresentavam grupo de compatibilidade A1. Segundo Reis et al. (2003), no Brasil, os dois grupos de compatibilidade estão presentes, associados às duas linhagens clonais: US-1, que afeta tomateiro e é constituída por isolados do grupo de compatibilidade A1; e BR-1, encontrada associada à requeima em batateira e constituída por isolados do grupo A2. No entanto, observou-se no Rio Grande do Sul a ocorrência de isolados dos grupos A1 e A2 em um mesmo campo de batata (Santana 2006), o que pode favorecer a reprodução sexuada do patógeno. A recombinação pode trazer consequências epidemiológicas em função do aumento da variabilidade genética das populações de P. infestans, além da formação de oósporos que podem servir de inóculo para epidemias de requeima (Anderson 2007; Cooke et al. 2003).
3
fungicidas de amplo espectro (protetores) como o oxicloreto de cobre, mancozeb e clorotalonil (Nazareno & Jaccoud 2003), além de fungicidas sistêmicos com ação específica contra P. infestans, como por exemplo, o mefenoxam, cymoxanil, dimetomorfe e propamocarbe (Reis et al. 2005; Pérez et al. 2009). No caso dos QoI’s, além dos produtos liberados para o controle de P. infestans (famoxadone e fenamidone), existe também a pressão de seleção exercida na aplicação de estrobilurinas (azoxystrobin) para o controle de Alternaria tomatophila em tomateiro e A. grandis em batateira (Rodrigues et al. 2010), que também pode afetar P. infestans.
A primeira caracterização da sensibilidade de isolados brasileiros de P. infestans a fungicidas foi realizada entre os anos de 1998 e 2000 (Reis et al. 2005). Foi detectada alta frequência de indivíduos resistentes à mefenoxam, entretanto não foram detectados isolados resistentes aos fungicidas cymoxanil, clorotalonil e mancozeb (Reis et al. 2005).
A compreensão da dinâmica da variabilidade genética dos fitopatógenos é necessária para o entendimento de como as populações evoluem e as implicações desse processo na durabilidade de cultivares resistentes e no controle de doenças. De forma prática, esta compreensão pode ser traduzida na duração da efetividade da adoção de uma planta hospedeira resistente ou de um fungicida específico para o manejo da doença (Milgroom & Peever 2003). Segundo Lees et al. (2006), diversos trabalhos foram realizados em todo o mundo para caracterizar o grupo de compatibilidade e a resistência a fungicidas das populações de P. infestans, no entanto, os estudos relacionados à diversidade genética têm sido limitados pela sensibilidade dos marcadores genéticos utilizados. Este aspecto justifica a adoção de novos marcadores nas análises de biologia de populações de fitopatógenos, como o caso dos microssatélites, também conhecidos como sequências simples repetidas (SSR) (Cooke & Lees 2004).
4
mudanças na população foram relatadas em plantios de batata do Rio Grande do Sul (Santana, 2006), gerando a necessidade de uma nova caracterização das populações brasileiras com marcadores moleculares mais informativos, como os microssatélites. Faz-se necessário, também, nova avaliação de possíveis modificações na agressividade do patógeno, em relação às plantas hospedeiras, e na sensibilidade aos principais fungicidas empregados nas duas culturas. O entendimento da dinâmica populacional de P. infestans ao longo dos anos, permitirá melhor embasamento para o desenvolvimento e a adoção de práticas de manejo da doença, no auxílio ao desenvolvimento de cultivares resistentes à requeima e melhorar a eficiência do controle químico.
Este trabalho teve por objetivo a caracterização da população atual de Phytophthora infestans nas regiões Sul e Sudeste do Brasil. Foram estabelecidos os seguintes sub-objetivos:
i) Efetuar a caracterização fenotípica e molecular dos isolados de Phytophthora infestans coletados nos períodos de 1998-2000, 2003-2005 e 2008-2010 nas regiões Sul e Sudeste do Brasil
ii) Determinar a estrutura genética das populações analisadas por meio de técnicas de genética molecular de populações.
iii) Quantificar a agressividade de isolados de Phytophthora infestans oriundos de batateira e tomateiro quando inoculados no hospedeiro de origem ou de forma cruzada.
5
REFERÊNCIAS BIBLIOGRÁFICAS
Anderson, B. 2007. Sexual reproduction in Phytophthora infestans - epidemiological consequences. Swedish University of Agricultural Science, Uppsala. Doctoral thesis. 31p.
Brent, K. J., & Hollomon, D. W. 2007. Fungicide resistance in crop pathogens: How can it be managed. FRAC monograph. 1:1–60
Cip. 2007. Centro Internacional de la Papa. Available at: <http://www.cipotato.org/potato>. [Assessed on September 25, 2008]
Cooke, D. E. L., & Lees, A. K. 2004. Markers, old and new, for examining Phytophthora infestans diversity. Plant Pathology. 53:692-704
Cooke, D. E. L., Young, V., Birch, P. R. J., Toth, R., Gourlay, F., Day, J. P., Carnegie, S. F., & Duncan, J. M. 2003. Phenotypic and genotypic diversity of Phytophthora infestans populations in Scotland (1995-97). Plant Pathology. 52:181-192
Erwin, D. C., & Ribeiro, O. K. 1996. Phytophthora diseases worldwide. American Phytopathological Society (APS Press).
Fao. 2006. Food and Agriculture organization of the United Nations. Available at: FAO: <http://faostat.fao.org/site/567/DesktopDefault.aspx?PageID=567> [Assessed on September 26, 2008]
Flier, W. G., Grunwald, N. J., Kroon, L., Sturbaum, A. K., van den Bosch, T. B. M., Garay-Serrano, E., Lozoya-Saldana, H., Fry, W. E. & Turkensteen, L. J. 2003. The population structure of Phytophthora infestans from the Toluca Valley of central Mexico suggests genetic differentiation between populations from cultivated potato and wild Solanum spp. Phytopathology. 93:382-390
Fry, W. 2008. Phytophthora infestans: the plant (and R gene) destroyer. Molecular Plant Pathology. 9:385-402
Gómez-Alpizar, L., Carbone, I., & Ristaino, J. B. 2007. An Andean origin of Phytophthora infestans inferred from mitochondrial and nuclear gene genealogies. Proceedings of the National Academy of Sciences. 104:3306 -3311
6
Kemmitt, G. 2002. Early blight of potato and tomato. The Plant Health Instructor. Available at: <http://www.apsnet.org/Education/phi_index.html>. [Assessed on August 15, 2008]
Kroon, L., Bakker, F. T., Van Den Bosch, G. B. M., Bonants, P. J. M., & Flier, W. G. 2004. Phylogenetic analysis of Phytophthora species based on mitochondrial and nuclear DNA sequences. Fungal Genetics and Biology. 41:766–782
Lees, A. K., Wattier, R., Shaw, D. S., Sullivan, L., Williams, N. A., & Cooke, D. E. L. 2006. Novel microsatellite markers for the analysis of Phytophthora infestans populations. Plant Pathology. 55:311-319
Milgroom, M. G., & Peever, T. L. 2003. Population biology of plant pathogens - The synthesis of plant disease epidemiology and population genetics. Plant Disease. 87:608-617
Nazareno, N. R. X., & Jaccound Filho, D. S. 2003. Doenças fúngicas. In O cultivo da batata na região sul do Brasil, orgs. A. S. Pereira & J. Daniels. Brasília, DF: Embrapa Infromação Tecnológica. 567p.
Pérez, W., Lara, J., & Forbes, G. A. 2009. Resistance to metalaxyl-M and cymoxanil in a dominant clonal lineage of Phytophthora infestans in Huánuco, Peru, an area of continuous potato production. European Journal of Plant Pathology. 125:87–95
Petersen, A. B., & Rosendahl, S. O. 2000. Phylogeny of the Peronosporomycetes (Oomycota) based on partial sequences of the large ribosomal subunit (LSU rDNA). Mycological Research. 104:1295–1303
Reis, A., Smart, C. D., Fry, W. E., Maffia, L. A., & Mizubuti, E. S. G. 2003. Characterization of isolates of Phytophthora infestans from southern and southeastern Brazil from 1998 to 2000. Plant Disease. 87:896-900
Reis, A., Ribeiro, F. H., Maffia, L. A., & Mizubuti, E. S. G. 2005. Sensitivity of Brazilian isolates of Phytophthora infestans to commonly used fungicides in tomato and potato crops. Plant Disease. 89:1279–1284
Ristaino, J. B., & Gumpertz, M. L. 2000. New frontiers in the study of dispersal and spatial analysis of epidemics caused by species in the genus Phytophthora. Annual. Review of Phytopathology. 38:541-5476
Rodrigues, T. T. M. S., Berbee, M. L., Simmons, E. G., Cardoso, C. R., Reis, A., Maffia, L. A., Mizubuti, E. S. G. 2010. First report of Alternaria tomatophila and A. grandis causing early blight on tomato and potato in Brazil. New Disease Reports. 22:28
Santana, F. M. 2006. Distribuição e caracterização de isolados de Phytophthora infestans (mont.) De Bary associados à batata (Solanum tuberosum L.) na região sul do Brasil. Universidade Federal de Pelotas, Pelotas. Doctoral thesis. 76f.
7
1. Characterization and temporal analysis with SSR markers of Phytophthora
infestans isolates from Brazil reveal population admixture, sexual recombination
and bottleneck effects.
1.1.Abstract
8 1.2.Introduction
In the past 25 years major genetic changes in the populations of Phytophthora infestans (Mont.) de Bary, the oomycete that causes potato (Solanum tuberosum L.) and tomato (Solanum lycopersicum L.) late blight, have been recorded worldwide (Fry 2008). These changes impacted on yield of those crops and on management of this severe foliar disease that affects two of the most widely cultivated vegetable crops. In developing countries, crop losses due to late blight in potatoes alone are estimated to have reached more than 3 billion dollars (Bradshaw et al. 2006). Late blight epidemics are notoriously known for high progress rates. The pathogen can complete its life cycle in a short time span, under favorable conditions (moderate temperatures and high humidity) it can be as short as three days (Fry 2008). Two types of spores can be formed by P. infestans since this organism can reproduce both sexually and asexually. Sexual recombination can occur only when individuals of the opposite mating types, A1 and A2, are present in the same geographic area. Until 1984, except for the Toluca Valley in Mexico, where a recombining population was known to be present, populations worldwide were clonal and comprised of individuals of the A1 mating type. However, starting 1985 isolates of the A2 mating type were reported in areas outside the Toluca Valley (Fry et al. 1993).
Migrations resulted in the introduction of new genotypes and recombination thereafter are two evolutionary mechanisms likely to have contributed to change the genetic makeup of the populations. Isolates of both mating types are present in several countries and increased genotypic diversity is well documented in many areas (Day et al. 2004; Möller et al. 2009; Gisi et al. 2010). Previous analyses of the Brazilian population of P. infestans support the occurrence of migration events with the introduction of the A2 mating type, but there was no evidence of recombination and only two clonal lineages, BR-1 (A2 mating type), associated with late blight on potato, and US-1 (A1), predominantly found on tomato fields, were detected countrywide (Reis et al. 2003). A decade has passed since this study was conducted and potato and tomato growers have noticed more severe late blight epidemics with the increase in the occurrence of stem lesions. These facts raised the possibility that the genetic structure of the Brazilian populations of P. infestans could have changed.
9
a population (Miller & Johnson 2000). The presence of isolates of the A2 mating type and the establishment of a sexually recombining populations in some European countries resulted in new genotypes of the pathogen capable to overcome disease resistance genes in potato and tomato (Anderson 2007).
10 1.3.Material and Methods
Sampling and isolates
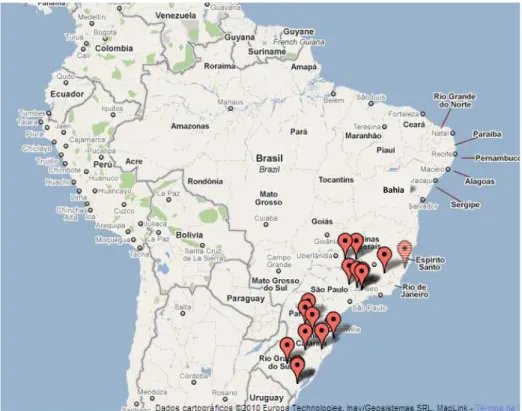
Infected leaves, fruits or stems of potato and tomato with typical late blight symptoms were collected in the major producing regions (Fig. 1). Isolates were collected during three periods: 1998/2000 (by Reis 2001); 2003/2005 (by Santana 2006) and 2008/2010. For each sample, geographic coordinates were obtained with a portable GPS device. Three to ten leaflets or stems were collected from each sampled field and taken to the laboratory where they were transferred to moist chamber at 18°C to induce sporulation. Isolation procedure started by harvesting the sporangia from the lesions and transferring them to the V8-medium (1.0 g CaCo3, 200 mL of V8-juice, 0.05 g of β-sitosterol), amended with ampicillin at 100 mg L-1, rifampicin at 20 mg L-1, pentachloronitrobenzene at 670 mg L-1 (PCNB) and benomyl 100 mg L-1. Pure culture of single lesion isolates were grown on V8, Rye-B (Trout et al. 1997) or Pea-glucose-agar (150g of frozen peas, 5g of glucose, 15g of Pea-glucose-agar and 0.05g of β-sitosterol) culture media, at 18°C in the dark.
Mating type characterization
A total of 166 isolates (Table S1) were characterized based on the presence of coenocytic hyphae, shape of the sporangia, ramification of the sporangiophores with swellings at sites of sporangium formation, and presence of papillae. Pathogen structures were examined under a compound microscope (400X).
11 DNA extraction
Isolates were grown for 8 to 15 days at 18°C in clear pea broth (Goodwin et al 1995). After colony development, the mycelium was dehydrated, frozen with liquid nitrogen, and ground in a mortar with a pestle. DNA extraction was accomplished using two protocols: (i) Quick & Easy protocol and a (ii) modified protocol from the Reader and Brodar method (Eucablight, <www.eucablight.org>).
Sequencing of the ITS region
Ten isolates were randomly selected for PCR amplification of the internal transcribed spacer (ITS) region of the ribosomal DNA, with the ITS4 and ITS5 primers (White et al. 1990). The reaction was done in a 25 L volume and consisted of 1x PCR buffer (50 mM KCl, 10 mM Tris-HCl and 0.1 % of Triton X-100), 2 mM MgCl2,200 mM dNTPs, 0.2 mM each primer, 1.25 units Taq DNA polymerase, and 50 ηg DNA. The PCR products were purified with the High Pure PCR Cleanup Micro Kit (Roche Diagnostics) and sequenced in a MegaBaceTM DNA analysis system (GE Healthcare). The forward and reverse sequences of each isolate were aligned and manually edited with the Staden Package software (Staden 1996) and a consensus sequence was generated. The consensus sequences of the ITS region of all isolates were aligned with Clustal-W (Thompson, Higgins, & Gibson 1994) and manually re-edited for a more precise alignment (MEGA 4.1, (Tamura et al. 2007)).
The blastn algorithm (BLAST - NCBI <http://blast.ncbi.nlm.nih.gov/Blast.cgi>) was used to assess the identity of the nucleotide sequence of all isolates. Additionally, four random sequences of P. infestans isolates were selected from the GenBank and aligned with the sequences generated in this study and a phylogenetic analysis was carried out with other Phytophthora species using the Neighbor-Joining method with the Kimura-2-parameter substitution model (Kimura 1980).
Mitochondrial haplotypes
12
CATCCAGAGGTTTATGTT 3’ and R4 = 5’CCGATACCGATACCAGCACCAA -3’) (Griffith & Shaw 1998) were amplified in a 100 L reaction consisting of 1x PCR buffer (50 mM KCl, 10 mM Tris-HCl and 0.1 % of Triton X-100), 2.75 mM MgCl2,200 mM dNTPs, 0.325 mM of each primer, 5 units Taq DNA polymerase, and 100 ηg DNA (Gavino & Fry 2002). The amplification was under with the following PCR conditions: one cycle of 90° C for 90s, followed by 40 cycles of 90° C for 30s, 55° C for 40s and 72° C for 2 minutes, plus a final extension period of 72° C for 10 min.
The expected sizes of the PCR products were 1.2 kb for P2 and 0.96 Kb for P4. The amplification products of the P2 and P4 mtDNA loci were digested with Msp I and Eco RI, respectively. Five L of the digested product were stained with GelRedTM (Biotium, Inc.), separated by electrophoresis on 2.5% agarose gels, visualized using standard techniques, and haplotypes were determined as previously described (Griffth and Shaw 1998).
SSR amplification
A total of eleven SSR loci were chosen: Pi02, Pi04, Pi16, Pi33, Pi56(Long), Pi63(Long), Pi89, D13, Pi70 (Lees et al. 2006; Cooke 2009), Pi4B, and G11 (Knapova & Gisi 2002). To allow the analysis of several loci at the same time, the forward primer of each locus was labeled with one of the three fluorescent dyes: FAM (Pi02, Pi63(Long), D13 and Pi70), NED (Pi33, Pi89, and G11), and HEX (Pi16, Pi04, Pi56(Long) and Pi04B). The Multiplex PCR reaction was performed in a 25 L reaction with the Type-it® Microsatellite Kit (QIAGEN, USA), according to the manufacturer's recommendation using 20 ηg of DNA template. The PCR conditions for all multiplex panels were: one cycle at 95° C for 5 min, followed by 28 cycles at 95° C for 30 s, 58° C for 90 s and 72° C for 30 s, plus a final extension period of 60° C for 30 min. Five L of the PCR product were stained with GelRedTM, separated by electrophoresis on 2.5 % agarose gels and visualized using standard techniques.
13
with the GeneMapperTM 3.5 software, and the calibration of the allele sizes was done with reference isolates kindly provided by Dr. David E. L. Cooke of the Scottish Crop Research Institute (SCRI), UK (Lees et al. 2006). A subset of isolates was replicated three times with independent mycelial growth (solid and liquid medium) and DNA extraction. Independent DNA extraction, PCR and scores of the fragments sizes, were used to confirm the reproducibility of the data.
Statistical and temporal population analyses
Based on ten independent microsatellite loci different multilocus genotypes (MLGs) were identified. The polymorphism of each locus and the heterozygosity values (Nei 1978) were accessed using the Microsatellite toolkit (Park 2001). Hierarchical analysis of the P. infestans population were conducted by period (98/00, 03/05 and 08/10), by region, and based on host of origin when more than five isolates were available. To access the genotypic diversity measured by the richness, diversity and evenness, and to reduce the error due to different sample sizes, the genotypic richness E(gn) was estimated using rarefaction curves (Grünwald et al. 2003), and the number of genotypes in a population of n = 16, the smallest population observed, was estimated. To measure genotypic diversity the N1 (Hill 1973) and the Stoddart and Taylor’s G (Stoddart & Taylor 1988) indices were calculated. Confidence intervals for N1 and G values were calculated from 1000 bootstrap re-sampling of the original MLG frequency with “vegan” and “vegetarian” packages in R (R Development Core Team 2008). Similarly, the genotypic evenness was assessed using the E5 index = [(G-1) /(N1-1)] (Grünwald et al. 2003).
14
the package ‘DEMEtics’ in R (R Development Core Team 2008). The Dest values were used to calculate the number of migrants per generation, by the formula Nm = (0.25x(1-Dest))/Dest. A distance matrix based on Nei’s genetic distance (Nei 1972) was used to generate an UPGMA (unweighted pair group method with arithmetic mean) dendrogram with POPGENE 1.32.
The hypothesis of random mating was tested using the index of association (IA) and the RD which corrects for the number of loci with the software Multilocus 1.3 (Agapow & Burt 2001). The estimates of linkage-disequilibrium (IA and RD) were compared with the expected distribution of the loci when in random association (null hypothesis). Deviation from the null hypothesis (no linkage-disequilibrium) was accessed by 1000 permutation of the alleles between individuals for each locus.
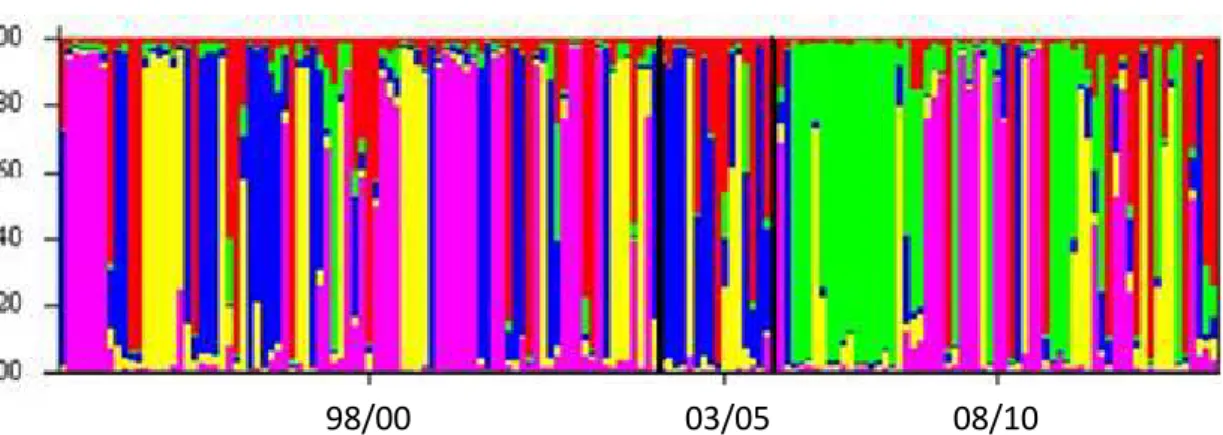
To investigate the population structure, a bayesian clustering approach to genetic mixture analyses was performed using the software Structure 2.3.3 (Pritchard et al. 2000). The entire dataset was analyzed using the admixture model. The number of Monte-Carlo Markov Chains (MCMC) was 100,000 replicates with burn-in of 20,000. All other parameters were set at the default values. The number of underlying groups (k) varied from 1 to 10 and the analysis was conducted five independent times. The posterior probability of the likelihood [Ln P(D)] was used to choose cluster number (k) for the entire dataset. Analysis of molecular variance (AMOVA) was conducted in Arlequin ver. 3.5.1.2 (Excoffier & Lischer 2010) to test for significant variation among years, regions, and MLG. The default set of 10,000 permutations was used. Finally, the intensity of genetic drift was estimated with the software Bottleneck v.1.2.02 (Cornuet & Luikart 1996).
1.4.Results
Isolate morphology and mating type characterization
15
Regardless of collection date, all isolates from tomato were of A1 mating type (Table 1). Among the potato isolates (n = 99), 15 were of A1 and 84 of the A2 mating type. In the 98/00 period (n = 29), the number of potato isolates of the A1 and A2 mating types was 1 and 28, respectively. In the 08/10 period, the A1:A2 ratio in the Alto Paranaíba region of Minas Gerais State was 1:3, and for isolates collected in Vargem Grande do Sul, São Paulo State, the ratio was close to 1:1. For the 03/05 period Santana (2006) noticed a frequency close to 1:1 in the Rio Grande do Sul state. The isolates collected in 03/05 were part of the analysis of the present work.
ITS region and mitochondrial haplotypes
All sequences had approximately 795 bp and low polymorphisms were detected. The Blastn analysis revealed more than 98% identity with ITS sequences of P. infestans isolates deposited in the GenBank, with e-value <0.0001. All ten isolates of P. infestans grouped together with the GenBank sequences, confirming the P. infestans identity.
Among the four possible mitochondrial haplotypes: Ia, Ib, IIa and IIb (Griffth and Shaw 1998), only two, Ib and IIa, were detected among the isolates analyzed (Table 1). All A1 isolates had the Ib haplotype pattern. Two haplotypes were detected among the A2 mating type isolates: Ib and IIa. In the 08/10 period all isolates from Minas Gerais State (Southeast region) had the Ib haplotype, whereas 92.6% of the isolates from the South region had mtDNA haplotype IIa and 7.4% the Ib haplotype
Gene and genotypic diversity
All isolates (n = 166) were analyzed with 10 microsatellite markers and polymorphism was high (Figure S1). The amplification of the locus Pi4B was not reproducible and it was not included in the analysis, thus 10 SSR markers were used in this study.
16
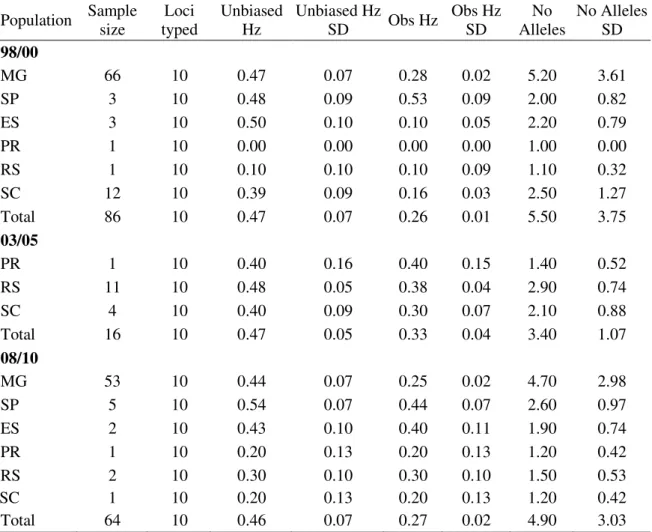
Obs Hz did not differ among all populations. In sampled locations with sample size higher than 10 isolates, the highest values of allele number were found in Minas Gerais State (Table 2).
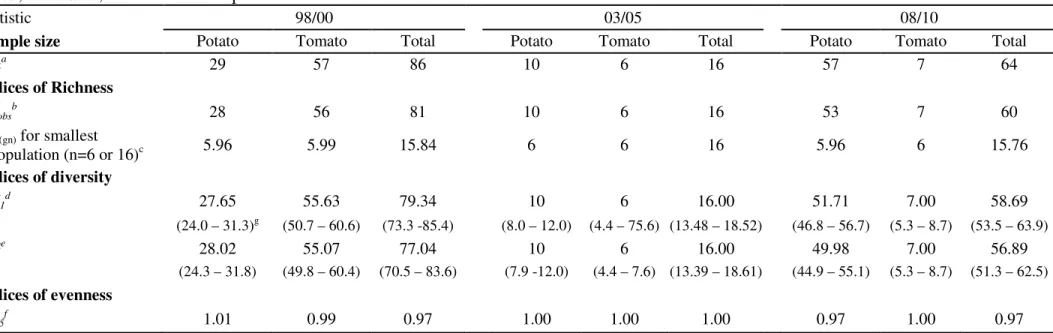
Across all years 157 multilocus genotypes (MLG’s) were identified and there was no significant difference among years or host (potato and tomato) for genotype richness (E(gn)). There was no significant difference of diversity and evenness among all periods (Table 3). There was no redundant MLG among the three periods. In the same year, MLGs were shared only among isolates sampled from the same State. Complementary analysis of pairwise comparison, conducted with the Microsatellite Toolkit, revealed 158 cases of more than 80% of shared alleles among different years (data not shown).
Linkage disequilibrium and population structure
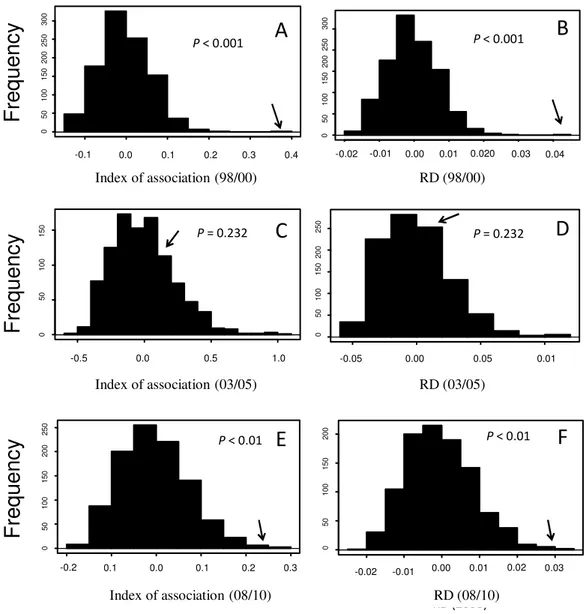
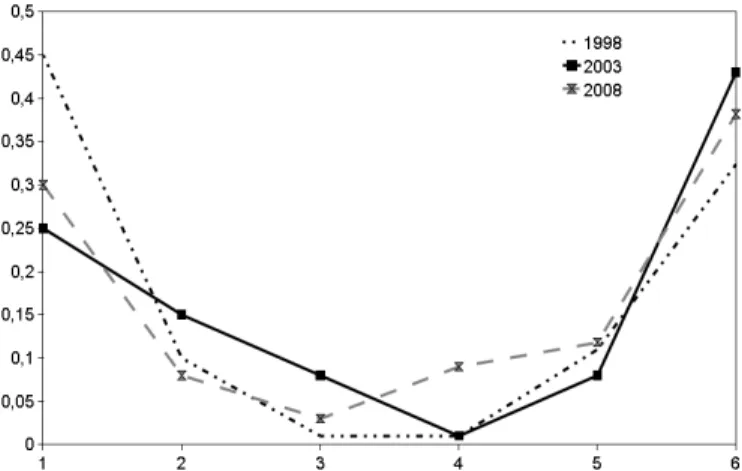
According to the IA and Rd tests, there was no evidence of random mating in the 98/00 and 08/10 periods. The 03/05 period was in linkage equilibrium and there was strong evidence of random mating in this period (Fig. 2).
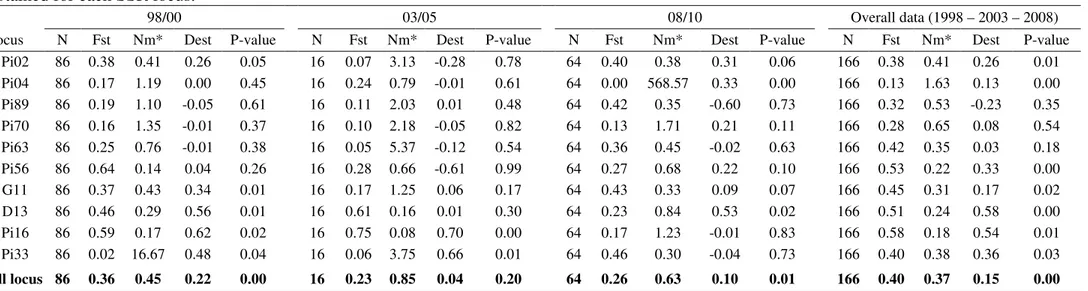
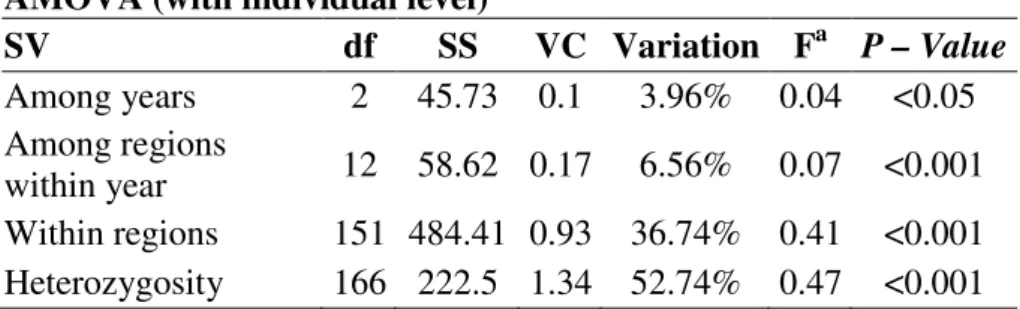
Estimates of population differentiation based on fixation index (FST) and the differentiation index (Dest) support strong population differentiation among and within sampled years (Table 4). The Dest among the 1998-2003 was 0.24 (Nm=0.78) and low differentiation was found when 03/05 and 08/10 periods were compared (Dest = 0.15 and Nm = 1.42) (Table 5). Based on the AMOVA the high population differentiation was due to the great level of heterozigosity across population (52.7%, Table 6). Variation among periods was approximately 4% of the total variation. When the individual level was not included, the effect of periods was not significant (1.9%, P = 0.08), and differentiation was caused by the variation within collected regions (87.7%, P < 0.001). There was no correlation between genetic and geographic distance based on the Mantel’s test (Rxy = 0.092; P = 0.19).
17
sampled years shared part of each cluster, but the frequency changed from periods. An admixture population was detected across different periods; for instance the 03/05 periods represents part of the 98/00 period.
Evidence for population shifts and bottleneck effect
The allele frequency in each of three sampled periods differed (Table S2), and the homogeneity test was significant to all loci, thus an unequal distribution of the alleles was detected across the 10-year period. However, overall, none of these loci can be fit on Hardy-Weinberg equilibrium, indicating the presence of clonality (Table S2). Bottleneck results showed that all tested microsatellite loci evolved according to the infinite allele model (IAM). All sub-populations of each state within year were combined and three groups were formed. Signals of recent genetic drift could be detected based on the excess of heterozygosity (H) for all loci (P < 0.01) (Table 7). The same level of significance was observed with the standardized differences test (SDT), assuming that all loci are in mutation-drift equilibrium, and also with the Wilcox test (one tail for H excess) (data not shown).
18 1.5.Discussion
Based on the set of markers used in this study, there is strong evidence that genetic changes occurred in the population of P. infestans associated with potatoes, but not in those associated with tomato. The results of the analyses of three markers corroborate this claim: the mating type ratio; the detection of mtDNA haplotype Ib associated with individuals of the A2 mating type, and the different alleles found at the SSR loci. The presence of individuals of the A1 mating type in recent samples from potato fields in the Southeast region is noteworthy and can have important consequences to late blight management. On the other hand, the population of P. infestans associated with tomato late blight is comprised only by isolates of the A1 mating type, as previously reported (Reis et al. 2003). In this previous study, potato isolates were mostly A2 (82%) and only in an experimental field located in Viçosa, Minas Gerais State, were A1 isolates found in potato plots (Reis et al. 2003). The experimental field was located in an important tomato producing area where only A1 isolates were found to cause late blight in this crop. Thus, migration from the surrounding tomato fields was postulated to have contributed to the presence of A1 in potato fields.
19
to break the linkage-disequilibrium, or that the frequent population expansion during the epidemics can be more favorable to more closely related individuals, resulting in dominance of some alleles and maintaining the linkage-disequilibrium (Smith et al. 2000; Groenewald et al. 2008). More intense sampling in these areas with an increased sample size is required to address this issue.
If random mating is occurring in the field then increased variability in the population of P. infestans and the potential role of oospores in the epidemics of late blight are anticipated to implicate in the adjustment of the disease management. Pathogens with mixed reproduction models, like P. infestans, pose the highest risk of evolution, because during the sexual cycle new allelic combinations are formed and the more fitted genotypes generated can predominate in the population due the asexual reproduction (McDonald & Linde, 2002). Late blight is a polycyclic disease and in Brazil the main inoculum for epidemics are the asexual structures (sporangia). In countries where sexual reproduction commonly takes place, the oospores contribute significantly to initiate late blight epidemics (Goodwin 1997; Fry et al. 2009; Deahl et al. 2009; Widmark et al. 2007). Earlier development of late blight epidemics in potato fields are frequently reported by growers. However, at this point no study was conducted to assess if the initial lesions were originated from oospore germination or by the “constant supply” of airborne sporangia. Intensive sampling in potato fields where A1 and A2 isolates were found and the genetic characterization of the isolates with SSR markers should help elucidate this issue.
20
seed tubers could have contributed to introduce new genotypes of P. infestans. Tomato growers in Brazil do not use their own seeds and also purchase from several companies. However, transmission of late blight by tomato seeds is not as likely as by seed tubers (Baker & Smith 1966).
The higher resolution of the SSR markers used in the current study revealed a more variable population of P. infestans in Brazil then previously reported using RFLP. The multilocus genotype system based on these SSR markers has been useful in assessing the genetic structure of P. infestans (Lees et al. 2006). The SSR markers are well-known for being highly polymorphic and codominant (Queller et al. 1993; Lees et al. 2006). These features make them a powerful tool to detect population changes caused by sexual recombination, population expansion or genetic bottlenecks (Linde et al. 2010). In the present analysis, higher gene and genotypic diversity among all sampled years were detected when compared to previous estimates (Reis et al. 2003). The presence of a more variable population since 1998 can be partly due to the use of a more polymorphic marker and/or the presence of variants of the two dominant clonal lineages. Despite the prevalence of US-1 on tomatoes, variants of this lineage were reported to be present in the Brazilian population of P. infestans (Reis 2001). This could explain the diversity noticed in this work, when the 98/00 period was analyzed. However, no signal of random mating was found based on the linkage-disequilibrium analysis. The high diversity in this subpopulation could be explained by the presence of an admixture population or presence of variants of a same clonal lineage. A more recent study with isolates collected from 03/05 in the South region already pointed to a change in the population. New variants were sampled that did not fit in any of the known clonal lineages of P. infestans (Santana 2006). The current data allowed more reliable inferences regarding the occurrence of sexual recombination. Variation in the allele frequency and the introduction of alleles that were not present in the 98/00 period also support the change in the population.
21
frequency and the maintenance of high variability. The linkage-disequilibrium in the 08/10 period agrees with the fact that recombination in Brazil can occur at low frequency and the epidemic is predominantly caused by asexual inoculum. However, the most likely explanation for not detecting recombination signal in the current population (08/10) is sampling artifact. Since that the sensitivity on random mating detection is connected with the frequency of recombination events. According to Weiss and Clark (2002), the sample size must be proportional to the epidemiological and evolutionary questions. Hence the linkage-disequilibrium is influenced by the substructures existent in the sampled population. The sample size must be great enough to overcome this background effect and excludes the presence of artifacts.
The distribution of both mating types close to a 1:1 ratio, high levels of gene and genotypic diversity, and linkage equilibrium in some populations provide evidence for the occurrence of randomly mating populations (Milgroom 1996; Milgroom & Peever 2003; McDonald & Linde 2002; Montarry et al. 2010). However, clonality is common in heterothallic oomycetes, even when and both mating types are present (Vercauteren et al. 2010). A study with isolates from a single field in southwest Sweden showed relatively low diversity even when sexual recombination occurs, but no direct comparison could be made because only 6 SSR marker were used and this considerably reduces probability of detecting polymorphisms (Widmark et al. 2007).
22
feasibly that changes in PMC sensitivity are occurring, noted as presence and/or an increase in the frequency of isolates capable to tolerating more than 10 ppm of this compound (Grünwald et al. 2006; Lehtinen et al. 2008). These two works has noticed the ability of some isolates of grow in culture medium or leaflet treated with more than 100 ppm of PMC. The consequences of this finding, if happening in Brazil are unknown, but insensitive isolates can become more prevalent across the years.
The sub-populations of the Southeast are genetically more similar across the years while more variation from year to year was observed for the South sub-population. Genetic distance was reduced in more than ten years, and agree with the increase in the gene flow in Brazilian population. Despite gene flow, differences are maintained in the population probably due to genetic drift and local selection events, as differences on climate conditions and fungicides applications. Evidence of sexual recombination was only recorded in the South Region. In the Southeast region diversity is maintained as an admixture of lineages and this fact are favorable to population differentiation by dominance of more fitted genotypes to local conditions.
Despite the abundance of airborne sporangia of P. infestans and its importance as inoculum, sporangia are very sensitive to the environmental conditions (temperature and humidity), and can be rapidly inactivated by the solar irradiance (Mizubuti et al. 2000; Fry et al. 2008; Lima et al. 2009). Dispersion by itself does not guarantee the survival and the contribution of the inoculum to the next generation (Pariaud et al. 2009). The occurrence of unfavorable environmental conditions can cause population bottlenecks even in presence of hosts.
23
increase variability and the contribution to the emergence of new variants of the pathogens that could lead to more aggressive isolates and/or isolates resistant to commonly used fungicides, mainly the site-specific products. The results of characterization of the population are of great interest to plant pathologist. Because knowledge about the changes that are occurring in the population are important to understanding the evolutionary potential of the population, genetic changes in the pathogen population can lead to the reassessment of management strategies for controlling the late blight.
More intense intra-region sampling is needed in addition to frequent analysis of the population. From an epidemiological perspective, the identification of prevalent MLG or recombinant genotypes with altered aggressiveness is of great interest. The estimates of aggressiveness of the new populations can shed light into the epidemiology of late blight and explain the alleged increase in the severity of late blight epidemics. In a previous work host specificity of the two dominant clonal lineages (BR-1 on potato and US-1 on tomato) was demonstrated (Suassuna et al. 2004), but changes in the population and the presence of new variants could lead to a different scenario. Likewise, the assessment of the sensitivity of current population to the commonly used fungicides is required. Further investigations of these topics are urgently warranted in Brazil.
1.6.Acknowledgements
24 1.7.References
Agapow, P. M., & Burt, A. 2001. Indices of multilocus linkage disequilibrium. Molecular Ecology Notes. 1:101–102
Anderson, B. 2007. Sexual reproduction in Phytophthora infestans - epidemiological
consequences. Swedish University of Agricultural Science, Uppsala. Doctoral Thesis. 31f.
Baker, K. F., & Smith, S. H. 1966. Dynamics of seed transmission of plant pathogens. Annual Review of Phytopathology. 4:311–332
Bradshaw, J. E., Bryan, G. J., Lees, A. K., McLean, K., & Solomon-Blackburn, R. M. 2006. Mapping the R10 and R11 genes for resistance to late blight (Phytophthora infestans) present in
the potato (Solanum tuberosum) R-gene differentials of black. TAG. Theoretical and applied
genetics. 112:744-51
Carlisle, D. J., Cooke, L. R., Watson, S., & Brown, A. E. 2002. Foliar aggressiveness of Northern Ireland isolates of Phytophthora infestans on detached leaflets of three potato
cultivars. Plant Pathology. 51:424–434
Cooke, D. E. L. 2009. EUCABLIGHT Protocols for SSR analysis of P. infestans (Draft).
Available at: http://www.eucablight.org/EucaBlight.asp.
Cooke, L. R., Carlisle, D. J., Donaghy, C., Quinn, M., Perez, F. M., & Deahl, K. L. 2006. The Northern Ireland Phytophthora infestans population 1998-2002 characterized by genotypic and
phenotypic markers. Plant Pathology. 55:320-330
Cornuet, J. M., & Luikart, G. 1996. Description and power analysis of two tests for detecting recent population bottlenecks from allele frequency data. Genetics. 144:2001
Day, J. P., Wattier, R. A. M., Shaw, D. S., & Shattock, R. C. 2004. Phenotypic and genotypic diversity in Phytophthora infestans on potato in Great Britain, 1995-98. Plant Pathology.
53:303-315
Deahl, K. L., Perez, F. M., Thompson, J. M., Fleming-Archibald, C., Thompson, S., Collier, R., et al. 2009. Characterization of Phytophthora infestans isolates from Jersey, Channel Islands.
Potato Research. 52:341–354
Dieringer, D., & Schlötterer, C. 2003. Microsatellite analyser (MSA): a platform independent analysis tool for large microsatellite data sets. Molecular Ecology Notes. 3:167-169
Excoffier, L., & Lischer, H. E. L. 2010. Arlequin suite ver 3.5: a new series of programs to perform population genetics analyses under Linux and Windows. Molecular Ecology Resources. 10:564-567
Fry, W. 2008. Phytophthora infestans: the plant (and R gene) destroyer. Molecular plant
Pathology. 9:385-402
Fry, W. E., Grünwald, N. J., Cooke, D. E. L., McLeod, A., Forbes, G. A., & Cao, K. 2009. Population genetics and population diversity of Phytophthora infestans. In Lamour, K. &
Kamoun, S. eds. Oomycete Genetics and Genomics: Diversity, Interactions and Research Tools. John Wiley & Sons, Inc. Hoboken, New jersey. 139-164 p.
Fry, W. E., Goodwin, S. B., Dyer, A. T., Matusak, M., Drenth, A., Tooley, P. W., Sujkowski, L. S., Koh, Y. J., Cohen, A. Spielman, L. J., Deahl, K. L., & Inglis, D. A. 1993. Historical and recent migrations of Phytophthora infestans: Chronology, pathways, and implications. Plant
disease. 77:653-661
25
population differentiation based on GST and D: forget GST but not all of statistics! Molecular Ecology. 19:3845-3852
Gisi, U., Walder, F., Resheat-Eini, Z., Edel, D., & Sierotzki, H. 2010. Changes of genotype, sensitivity and aggressiveness in Phytophthora infestans isolates collected in European
Countries in 1997, 2006 and 2007. Journal of Phytopathology. early view.
Gomes, C. B., Santana, F. M., Garrastazu, M. C., Reis, A., Pereira, A. S., Nazareno, N. R. X., & Becker, W. F. 2007. Monitoramento e caracterização dos grupos de compatibilidade de
Phyotphthora infestans associados à batata na região sul do Brasil. EMBRAPA. 45.
Goodwin, S. B. 1997. The population genetics of Phytophthora. Phytopathology. 87:462–473
Griffith, G. W., & Shaw, D. S. 1998. Polymorphisms in Phytophthora infestans: four
mitochondrial haplotypes are detected after PCR amplification of DNA from pure cultures or from host lesions. Applied and Environmental Microbiology. 64:4007-4014
Groenewald, M., Linde, C. C., Groenewald, J. Z., & Crous, P. W. 2008. Indirect evidence for sexual reproduction in Cercospora beticola populations from sugar beet. Plant Pathology.
57:25–32
Grünwald, N. J., Goodwin, S. B., Milgroom, M. G., & Fry, W. E. 2003. Analysis of genotypic diversity data for populations of microorganisms. Phytopathology. 93:738–746
Grunwald, N. J., Sturbaum, A. K., Montes, G. R., Serrano, E. G., Lozoya-Saldana, H., & Fry, W. E. 2006. Selection for fungicide resistance within a growing season in field populations of
Phytophthora infestans at the center of origin. Phytopathology. 96:1397-1403
Hill, M. O. 1973. Diversity and evenness: a unifying notation and its consequences. Ecology. 54:427–432
Kimura, M. 1980. A simple method for estimating evolutionary rates of base substitutions through comparative studies of nucleotide sequences. Journal of Molecular Evolution. 16:111-120
Knapova, G., & Gisi, U. 2002. Phenotypic and genotypic structure of Phytophthora infestans
populations on potato and tomato in France and Switzerland. Plant Pathology. 51:641-653
Lebreton, L., Lucas, J. M., & Andrivon, D. 1999. Aggressiveness and competitive fitness of
Phytophthora infestans isolates collected from potato and tomato in France. Phytopathology.
89:679-686
Lees, A. K., Wattier, R., Shaw, D. S., Sullivan, L., Williams, N. A., & Cooke, D. E. L. 2006. Novel microsatellite markers for the analysis of Phytophthora infestans populations. Plant
Pathology. 55:311-319
Lehtinen, A., Andersson, B., Le, V., Naerstad, R., Rastas, M., Ketoja, E., Hannukkala, A. O., Hermansen, A., Nielsen, B. J., Hansen, J. G., & Yuen, J. 2009. Aggressiveness of Phytophthora infestans on detached potato leaflets in four Nordic countries. Plant Pathology. 58:690-702
Lehtinen, A., & Hannukkala, A. 2004. Oospores of Phytophthora infestans in soil provide an
important new source of primary inoculum in Finland. Agricultural and Food Science. 13
Lehtinen, A., Hannukkala, A., Andersson, B., Hermansen, A., Le, V. H., Naerstad, R., Brunberg, A. B., Nielsen, B. J., Hansen, J. G., & Yuen, J. 2008. Phenotypic variation in Nordic populations of Phytophthora infestans in 2003. Plant Pathology. 57:227–234
Lehtinen, A., Hannukkala, A., Rantanen, T., & Jauhiainen, L. 2007. Phenotypic and genetic variation in Finnish potato-late blight populations, 1997–2000. Plant Pathology. 56:480–491
26
in a subtropical region: survival on tomato debris, temporal dynamics of airborne sporangia and alternative hosts. Plant Pathology. 58:87–99
Linde, C. C., Liles, J. A., & Thrall, P. H. 2010. Expansion of genetic diversity in randomly mating founder populations of Alternaria brassicicola infecting Cakile maritima in Australia.
Applied and Environmental Microbiology. 76:1946
McDonald, B. A., & Linde, C. 2002. Pathogen population genetics, evolutionary potential, and durable resistance. Annual Review of Phytopathology. 40:349-379
Milgroom, M. G. 1996. Recombination and the multilocus structure of fungal populations. Annual Review of Phytopathology. 34:457–477
Milgroom, M. G., & Peever, T. L. 2003. Population biology of plant pathogens - The synthesis of plant disease epidemiology and population genetics. Plant Disease. 87:608-617
Miller, J. S., & Johnson, D. A. 2000. Competitive fitness of Phytophthora infestans isolates
under semiarid field conditions. Phytopathology. 90:220–227
Mizubuti, E. S. G., Aylor, D. E., & Fry, W. E. 2000. Survival of Phytophthora infestans
sporangia exposed to solar radiation. Phytopathology. 90:78–84
Moller, K., Dilger, M., Habermeyer, J., Zinkernagel, V., Flier, W., & Hausladen, H. 2009. Population studies on Phytophthora infestans on potatoes and tomatoes in southern Germany.
European Journal of Plant Pathology. 124:659-672
Montarry, J., Andrivon, D., Glais, I., Corbiere, R., Mialdea, G., & Delmotte, F. 2010. Microsatellite markers reveal two admixed genetic groups and an ongoing displacement within the French population of the invasive plant pathogen Phytophthora infestans. Molecular
Ecology. 19:1965–1977
Nei, M. 1978. Estimation of average heterozygosity and genetic distance from a small number of individuals. Genetics. 89:583
Nei, M. 1972. Genetic distance between populations. American Naturalist. 106:283–292
Pariaud, B., Ravigne, V., Halkett, F., Goyeau, H., Carlier, J., & Lannou, C. 2009. Aggressiveness and its role in the adaptation of plant pathogens. Plant Pathology. 58:409-424
Park, S. D. E. 2001. Trypanotolerance in West African cattle and the population genetic effects
of selection. Dublin: University of Dublin. Ph.D, Thesis.
Porter, L. D., Cummings, T. F., & Johnson, D. A. 2006. Effects of soil-applied late blight foliar fungicides on infection of potato tubers by Phytophthora infestans. Plant Disease. 90:964–968
Pritchard, J. K., Stephens, M., & Donnelly, P. 2000. Inference of population structure using multilocus genotype data. Genetics. 155:945
Queller, D. C., Strassmann, J. E., & Hughes, C. R. 1993. Microsatellites and kinship. Trends in Ecology & Evolution. 8:285–288
R Development Core Team. 2008. R: A language and environment for statistical computing. R Foundation for Statistical Computing. Available at: http://www.R-project.org.
Reis, A. 2001. Caracterização das populações de Phytophthora infestans das regiões sul e
sudeste do Brasil. Universidade Federal de Viçosa, Viçosa. Doctoral thesis. 76f.
Reis, A., Ribeiro, F. H., Maffia, L. A., & Mizubuti, E. S. G. 2005. Sensitivity of Brazilian isolates of Phytophthora infestans to commonly used fungicides in tomato and potato crops.
27
Reis, A., Smart, C. D., Fry, W. E., Maffia, L. A., & Mizubuti, E. S. G. 2003. Characterization of isolates of Phytophthora infestans from southern and southeastern Brazil from 1998 to 2000.
Plant Disease. 87:896-900
Reis, A., Suassuna, N. D., Alfenas, A. C., & Mizubuti, E. S. G. 2002. Monitoramento da populaçao de Phytophthora infestans na região da Zona da Mata de Minas Gerais de 1998 a
2000. Fitopatologia Brasileira. 27:614-620
Ryman, N., & Leimar, O. 2009. GST is still a useful measure of genetic differentiation–a comment on Jost’s D. Molecular Ecology. 18:2084–2087
Santana, F. 2006. Distribuição e caracterização de isolados de Phytophthora infestans
(Mont.) De Bary associados à batata (Solanum tuberosum L.) na região sul do Brasil.
Universidade Federal de Pelotas, Pelotas. Doctoral Thesis 76p.
Smith, J. M., Feil, E. J., & Smith, N. H. 2000. Population structure and evolutionary dynamics of pathogenic bacteria. Bioessays. 22:1115–1122
Staden, R. 1996. The Staden sequence analysis package. Molecular Biotechnology. 5:233–241
Stoddart, J. A., & Taylor, J. F. 1988. Genotypic diversity: estimation and prediction in samples. Genetics. 118:705
Suassuna, N. D., Maffia, L. A., & Mizubuti, E. S. G. 2004. Aggressiveness and host specificity of Brazilian isolates of Phytophthora infestans. Plant Pathology. 53:405–413
Tamura, K., Dudley, J., Nei, M., & Kumar, S. 2007. MEGA4: molecular evolutionary genetics analysis (MEGA) software version 4.0. Molecular biology and evolution. 24:1596
Thompson, J. D., Higgins, D. G., & Gibson, T. J. 1994. CLUSTAL W: improving the sensitivity of progressive multiple sequence alignment through sequence weighting, position-specific gap penalties and weight matrix choice. Nucleic acids research. 22:4673
Vercauteren, A., De Dobbelaere, I., Grünwald, N. J., Bonants, P., Van Bockstaele, E., Maes, M., Heungens, K.. 2010. Clonal expansion of the Belgian Phytophthora ramorum populations based
on new microsatellite markers. Molecular Ecology. 19:92–107
Weiss, K. M., & Clark, A. G. 2002. Linkage disequilibrium and the mapping of complex human traits. Trends in Genetics. 18:19-24
White, T. J., Bruns, T., Lee, S., & Taylor, J. 1990. Amplification and direct sequencing of fungal ribosomal RNA genes for phylogenetics. PCR protocols a guide to methods and applications. :315–322
Widmark, A. K., Andersson, B., Cassel-Lundhagen, A., Sandström, M., & Yuen, J. E. 2007.
Phytophthora infestans in a single field in southwest Sweden early in spring: symptoms, spatial
distribution and genotypic variation. Plant Pathology. 56:573–579
Yeh, F., & Yang,, R. 1999. Popgene version 1.31. Available at: http://www.ualberta.ca/~fyeh/popgene.pdf [Acessado Agosto 4, 2010].
Young, G. K., Cooke, L. R., Kirk, W. W., Tumbalam, P., Perez, F. M., & Deahl, K. L. 2009. Influence of competition and host plant resistance on selection in Phytophthora infestans
28
Bahia
Figure 1. Map showing the sampled areas located in the the different regions of Brazil. Brazilian states names are in bold.
Table 1. Summary description of the collection of isolates of Phytophthora infestans used in this study according to the geographic region, year of collection, host crop, mating type (A1 or A2), and mtDNA haplotype.
Region Potato Tomato
Southeast Period Na n
p
b A1 mtDNAc A2 mtDNA n
t
d A1 mtDNA
MG 98/00 66 17 1 Ib 16 IIa 49 49 Ib
08/10 53 50 9 Ib 41 Ib 3 3 Ib
SP 98/00 3 0 0 0 0 0 3 3 0
08/10 5 5 2 Ib 3 IIa 0 0 0
ES 98/00 3 1 0 0 1 IIa 2 2 Ib
08/10 2 0 0 0 0 0 2 2 Ib
South
RS 98/00 1 1 0 0 1 IIa 0 0 0
03/05 11 9 2 Ib 7 IIa 2 2 Ib
08/10 2 1 0 0 1 Ib 1 1 Ib
SC 98/00 12 10 0 0 10 IIa 2 2 Ib
03/05 4 2 1 Ib 1 IIa 2 2 Ib
08/10 1 0 0 0 0 0 1 1 Ib
PR 98/00 1 1 0 0 1 IIa 0 0 0
03/05 1 1 0 0 1 IIa 0 0 0
08/10 1 1 0 0 1 Ib 0 0 0
MG = Minas Gerais, SP = São Paulo, ES = Espírito Santo, PR = Paraná, SC = Santa Catarina, and RS = Rio Grande do Sul State.
aN = sample size; bn
p = sample size ofisolates from potato; cmtDNA = mitochondrial haplotype; dnt =
29
Table 2. Population statistics with the heterozygosity, plus standard error, by period and Brazilian state collected.
Population Sample size
Loci typed
Unbiased Hz
Unbiased Hz
SD Obs Hz
Obs Hz SD
No Alleles
No Alleles SD
98/00
MG 66 10 0.47 0.07 0.28 0.02 5.20 3.61
SP 3 10 0.48 0.09 0.53 0.09 2.00 0.82
ES 3 10 0.50 0.10 0.10 0.05 2.20 0.79
PR 1 10 0.00 0.00 0.00 0.00 1.00 0.00
RS 1 10 0.10 0.10 0.10 0.09 1.10 0.32
SC 12 10 0.39 0.09 0.16 0.03 2.50 1.27
Total 86 10 0.47 0.07 0.26 0.01 5.50 3.75
03/05
PR 1 10 0.40 0.16 0.40 0.15 1.40 0.52
RS 11 10 0.48 0.05 0.38 0.04 2.90 0.74
SC 4 10 0.40 0.09 0.30 0.07 2.10 0.88
Total 16 10 0.47 0.05 0.33 0.04 3.40 1.07
08/10
MG 53 10 0.44 0.07 0.25 0.02 4.70 2.98
SP 5 10 0.54 0.07 0.44 0.07 2.60 0.97
ES 2 10 0.43 0.10 0.40 0.11 1.90 0.74
PR 1 10 0.20 0.13 0.20 0.13 1.20 0.42
RS 2 10 0.30 0.10 0.30 0.10 1.50 0.53
SC 1 10 0.20 0.13 0.20 0.13 1.20 0.42
Total 64 10 0.46 0.07 0.27 0.02 4.90 3.03
Unbiased Hz = Unbiased Nei gene diversity; Unbiased Hz SD = standard error of Unbiased Nei gene diversity; Obs Hz = Observed heterozygosity; Obs Hz SD = Standard error of Observed heterozygosity; No Alleles = Mean number of alleles per locus; No Alleles SD = Standard error of the Mean number of alleles per locus
30
Table 3. Indices of richness, evenness and diversity for the three sampling period of isolates of Phytophthora infestans obtained period from 98/00,
03/05, and 08/10, from tomato and potato fields.
Statistic 98/00 03/05 08/10
Sample size Potato Tomato Total Potato Tomato Total Potato Tomato Total
na 29 57 86 10 6 16 57 7 64
Indices of Richness
gobs
b 28 56 81 10 6 16 53 7 60
E(gn) for smallest
population (n=6 or 16)c 5.96 5.99 15.84 6 6 16 5.96 6 15.76
Indices of diversity
N1
d 27.65 55.63 79.34 10 6 16.00 51.71 7.00 58.69
(24.0 – 31.3)g (50.7 – 60.6) (73.3 -85.4) (8.0 – 12.0) (4.4 – 75.6) (13.48 – 18.52) (46.8 – 56.7) (5.3 – 8.7) (53.5 – 63.9)
Ge 28.02 55.07 77.04 10 6 16.00 49.98 7.00 56.89
(24.3 – 31.8) (49.8 – 60.4) (70.5 – 83.6) (7.9 -12.0) (4.4 – 7.6) (13.39 – 18.61) (44.9 – 55.1) (5.3 – 8.7) (51.3 – 62.5)
Indices of evenness
E5
f 1.01 0.99 0.97 1.00 1.00 1.00 0.97 1.00 0.97
aNumber of sampled individuals; bNumber of observed MLG’s; cNumber of expected genotype based on rarefaction curve for a sample with 16 individuals (among
years) and 6 individual (among hosts); dHill’s index; eStoddart & Taylor index; f
E5 index of evenness,calculated by (G -1)/(N1 -1); gNumbers in parentheses indicate
31
Table 4. Population differentiation analysis by the Fisher (Fst) and the Dest tests of differentiation. Data were arranged by period and estimates were obtained for each SSR locus.
98/00 03/05 08/10 Overall data (1998 – 2003 – 2008)
Locus N Fst Nm* Dest P-value N Fst Nm* Dest P-value N Fst Nm* Dest P-value N Fst Nm* Dest P-value
Pi02 86 0.38 0.41 0.26 0.05 16 0.07 3.13 -0.28 0.78 64 0.40 0.38 0.31 0.06 166 0.38 0.41 0.26 0.01
Pi04 86 0.17 1.19 0.00 0.45 16 0.24 0.79 -0.01 0.61 64 0.00 568.57 0.33 0.00 166 0.13 1.63 0.13 0.00
Pi89 86 0.19 1.10 -0.05 0.61 16 0.11 2.03 0.01 0.48 64 0.42 0.35 -0.60 0.73 166 0.32 0.53 -0.23 0.35
Pi70 86 0.16 1.35 -0.01 0.37 16 0.10 2.18 -0.05 0.82 64 0.13 1.71 0.21 0.11 166 0.28 0.65 0.08 0.54
Pi63 86 0.25 0.76 -0.01 0.38 16 0.05 5.37 -0.12 0.54 64 0.36 0.45 -0.02 0.63 166 0.42 0.35 0.03 0.18
Pi56 86 0.64 0.14 0.04 0.26 16 0.28 0.66 -0.61 0.99 64 0.27 0.68 0.22 0.10 166 0.53 0.22 0.33 0.00
G11 86 0.37 0.43 0.34 0.01 16 0.17 1.25 0.06 0.17 64 0.43 0.33 0.09 0.07 166 0.45 0.31 0.17 0.02
D13 86 0.46 0.29 0.56 0.01 16 0.61 0.16 0.01 0.30 64 0.23 0.84 0.53 0.02 166 0.51 0.24 0.58 0.00
Pi16 86 0.59 0.17 0.62 0.02 16 0.75 0.08 0.70 0.00 64 0.17 1.23 -0.01 0.83 166 0.58 0.18 0.54 0.01
Pi33 86 0.02 16.67 0.48 0.04 16 0.06 3.75 0.66 0.01 64 0.46 0.30 -0.04 0.73 166 0.40 0.38 0.36 0.03
All locus 86 0.36 0.45 0.22 0.00 16 0.23 0.85 0.04 0.20 64 0.26 0.63 0.10 0.01 166 0.40 0.37 0.15 0.00
32
Index of Association (1998)
fr
eq
ue
nc
y
-0.1 0.0 0.1 0.2 0.3 0.4
0 50 1 00 15 0 20 0 2 50 30 0
P< 0.001
RD (1998)
fre
qu
en
cy
-0.02 -0.01 0.00 0.01 0.02 0.03 0.04
0 50 1 00 1 50 20 0 25 0
P< 0.001
Index of association (1998)
RD (1998) IA (2003) fr eq ue nc y
-0.5 0.0 0.5 1.0
0 5 0 10 0 15 0
P= 0.232
RD (2003)
fre
qu
en
cy
-0.05 0.00 0.05 0.10
0 50 10 0 15 0 20 0 25 0
P= 0.232
Index of association (2003) RD (2003)
-0.1 0.0 0.1 0.2 0.3 0.4 -0.02 -0.01 0.00 0.01 0.020 0.03 0.04
0 50 10 0 20 0 15 0 25 0 30 0 RD (1998) 0 50 10 0 20 0 15 0 25 0 30 0 0 50 10 0 15 0 50 10 0 20 0 15 0 25 0 0
-0.5 0.0 0.5 1.0 -0.05 0.00 0.05 0.01
IA (2008)
10
0
-0.2 -0.1 0.0 0.1 0.2 0.3
0 50 10 0 15 0 20 0 25 0
Index of association (2008) RD (2008)
P< 0.01
RD (2008)
10
0
-0.02 -0.01 0.00 0.01 0.02 0.03
0 50 10 0 15 0 20 0
P< 0.01
50 10 0 20 0 15 0 25 0 0 50 10 0 15 0 0 20 0
-0.2 0.1 0.0 0.1 0.2 0.3 -0.02 -0.01 0.00 0.01 0.02 0.03
F
re
qu
en
cy
F
re
qu
en
cy
F
re
qu
en
cy
A
B
C
D
E
F
Index of association (98/00) RD (98/00)
Index of association (03/05) RD (03/05)
Index of association (08/10) RD (08/10)
Fig 2. Histograms representing the expected distribution for the Phytophthora infestans subpopulations in linkage-equilibrium. Panels A, C, and E refer to index of association. Panels B, D, and F, represent the analysis of Rd. Data from A and B are for the 98/00, C and D for the 2003-2008, and E and F for the 08/10 periods. The observed values of the index of association (IA) and RD for the three different periods are indicated by the arrows. The P-value of each estimate is depicted above each panel.
Table 5. Genetic differentiation estimated by the Dest index (above diagonals) and gene flow (below diagonals, Nm) for the three sampling periods 1998/2000, 2003/2005 and 2008/2010.
98/00 03/05 08/10 98/00 --- 0.244* 0.217* 03/05 0.776 --- 0.150* 08/10 0.900 1.416 ---
33
Table 6. Analysis of molecular variance (AMOVA) of Phytophthora infestans isolates collected in 1998/2000, 2003/2005 and 2008/2010.
AMOVA (with individual level)
SV df SS VC Variation Fa P – Value
Among years 2 45.73 0.1 3.96% 0.04 <0.05 Among regions
within year 12 58.62 0.17 6.56% 0.07 <0.001 Within regions 151 484.41 0.93 36.74% 0.41 <0.001 Heterozygosity 166 222.5 1.34 52.74% 0.47 <0.001
SV = source of variation; df = degrees of freedom, SS = sum of squares; VC = variation components
aF = Fixation indices
AMOVA (without individual level)
SV df SQ VC Variation Fa P – Value
Among years 2 42.73 0.05 1.94% 0.02ns 0.08 Among regions
within year 12 58.62 0.26 10.37% 0.11 <0.001 Within regions 317 706.91 2.23 87.69% 0.12 <0.001
SV = source of variation; df = degrees of freedom, SS = sum of squares; VC = variation components