Geostatistical analysis of
leprosy cases in the State of
São Paulo, 1991-2002
ABSTRACT
OBJECTIVE: To analyze the spatial pattern of leprosy case occurrences in order to
identify areas with a probability of disease transmission risks.
METHODS: This was an ecological study in which the analysis units were
municipalities in the State of São Paulo that were georeferenced at their centroids. The data source was the electronic database of notified leprosy cases at the Epidemiological Surveillance Center of the State of São Paulo, from 1991 to 2001. Geostatistical techniques were used for detecting areas with a probability of leprosy risk, and for quantifying the spatial dependency of cases.
RESULTS: The spatial dependence detected extended outwards to 0.55 degrees
from the georeferenced coordinates, which corresponded to approximately 60 km. The main areas identified as presenting a probability of risk were the northeastern, northern and northwestern regions of the State.
CONCLUSIONS: Verification of areas with the probability of leprosy risk using
spatial dependence analysis may be a useful tool for assessing health conditions and planning budget allocations.
KEYW O RD S: Leprosy, epidemiology. Residence characteristics. Geographic information systems. Ecological studies.
Paula A O promollaI
Ivete D albenII
M árcio CardimIII
I Coordenadoria de Controle de Doenças.
Secretaria de Estado da Saúde de São Paulo. São Paulo, SP, Brasil
I I Departamento de Saúde Pública.
Faculdade de Medicina de Botucatu. Universidade Estadual Paulista (UNESP). Botucatu, SP, Brasil
I I IDepartamento de M atemática, Estatística
e Computação. Faculdade de Ciências e Tecnologia. UNESP. Presidente Prudente, SP, Brasil
Correspondence:
Paula A. Opromolla
Coordenadoria de Controle de Doenças - CCD
Av. Dr. Arnaldo, 351 1º andar sala 133 01246-902 São Paulo, SP, Brasil E-mail: opromolla@saude.sp.gov.br
INTRODUCTION
Until the 1980s, the data available in the Brazilian literature on the prevalence of leprosy did not repre-sent the real situation regarding this endemic dis-ease, because neither investigations nor reports on cases reached a desirable level.10
The introduction of polychemotherapy from 1981 onwards,14 with effective treatment and cure for
pa-tients restricted to conditions that had favored trans-mission.2 Through this, the prevalence of leprosy was
drastically reduced throughout the world, since the treated and cured cases were taken out of the active records.
In 1991, the World Health Organization (WHO) pro-posed that leprosy should be eliminated as a public health problem by the year 2000.15 However, some
countries have been unable to reach this target, among which Brazil. In 2005, a new commitment was taken on, delaying the elimination in this country until 2010.16
The prevalence of leprosy in Brazil in 1985 was 16.4 individuals out of every 10,000 inhabitants, and this became 4.52 per 10,000 inhabitants in 2003, thus showing a significant reduction. However, leprosy still constitutes a public health problem and surveil-lance is required for resolving it.*
With regard to the detection of new cases, the same pattern has not been seen. According to Andrade (1996),** the increase in the detection rate and the absolute number of cases in Brazil over the last few years is not only due to epidemiological factors. It is possible that training of personnel, increased cover-age of the control program, decentralization of actions and publicity for the signs and symptoms of the dis-ease through the communication media has improved the identification and notification of this disease.
The State of São Paulo appears to be in a pre-elimina-tion phase, although the pattern of leprosy occurrence does not present homogenous distribution, such that there are some areas of high endemicity.12 The
inequali-ties among municipaliinequali-ties regarding the numbers of cases observed and the contrasts in the spatial distri-bution of this endemic disease reveal the complexity of the factors involved in achieving detection.9
In addition to individuals’ immunological conditions, other factors have an influence on the risk of
con-tracting leprosy. Among these are factors related to the level of endemic disease and unfavorable socio-economic conditions such as precarious health and living conditions and high numbers of people living together in the same environment.
Finding out about the health and living conditions of different population groups is an indispensable stage in the process of planning the offer of services and assessing the impact of health actions.1 According to
Barcellos et al,1 public health and environment are
extensively influenced by space occupation patterns, thus justifying the incorporation of spatial analysis for supporting the administrators of the Brazilian Na-tional Health System (SUS - Sistema Único de Saúde).
The statistical analyses usually used in epidemio-logical descriptions do not allow identification and/ or quantification of the differences or influences be-tween nearby regions. The development of techniques for mapping the risk of contracting diseases has been the subject of studies by several researchers.6
Within this context, with regard to organizing the health services in accordance with the SUS princi-ples and guidelines, there is a need to implement and structure new strategies for leprosy control and sur-veillance. Thus, spatial analysis may be a useful tool for assessing the health situation and planning the allocation of resources.
The objective of the present study was to analyze the spatial patterns of leprosy case occurrences, by map-ping the disease and identifying areas with probable transmission risks.
M ETH O D S
An ecological study on the spatial variability of lep-rosy cases was conducted using municipalities as the analysis unit. Leprosy case notification records for the State of São Paulo from 1991 to 2002 were utilized.
The data analyzed came from the historical series of 12 years of leprosy cases in the State that are held in computerized files at the Epidemiological Surveil-lance Center of the São Paulo State Health Depart-ment (CVE-SP). in accordance with the Leprosy No-tification Records of the Sistema de Informação de Agravos de Notificação (Notifiable Disease Informa-tion System - SINAN). Cases among children less than one year old were excluded, as were cases that, de-spite notification in the State of São Paulo, were
*Ministério da Saúde, Secretaria de Vigilância em Saúde, Departamento de Análise de Situação de Saúde. Saúde Brasil 2004: hanseníase. Brasília (DF); 2004. p. 311-2.
among individuals living in other States. All other cases were included.
Thus, the geostatistical methods were applied to a total de 22,250 cases among individuals living in 606 municipalities in the State of São Paulo.
Geostatistical analysis, a technique for detecting spa-tial dependence, was utilized. Most transmittable dis-eases present complex spatial patterns, and this is also the case with leprosy. Nonetheless, quantifica-tion of the transmission risk in terms of probabilities can be estimated for non-sampled locations.
One of the functions most utilized in geostatistics for determining the spatial dependence of variables is the semivariance function, which generates a semivario-gram. The experimental semivariogram is a graph that expresses the spatial variability between the samples. It is a function that only depends on the vector h, the distance between the pairs of cases sampled. When h increases, the semivariogram approaches the total vari-ability of the data, which is called a sill. If there is second-order stationarity, the semivariogram expresses the degree of dependence between the sampled points.
The semivariogram makes it possible to calculate the parameters involved in the model, namely: the spatial dependence distance (a), known as the range or span of the spatial dependence, i.e. the maximum reach of the spatial dependence, which indicates that beyond that distance there is no more dependence between the cases in question; the nugget effect (c0), which is the semivariance at zero distance, i.e. the representation of the variability for scales smaller than the sampling distance; and the height (c), which is the distance be-tween the nugget effect and the sill. This is the interval over which the semivariogram increases and there is spatial dependence. The sill represents the height at which the semivariogram stabilizes and approaches the total variability of the values sampled.
If spatial dependence has been verified by means of the semivariogram, values of the variable under analy-sis can be estimated by interpolation using kriging for locations where it was not sampled, while taking into consideration hypotheses of minimum variance and absence of bias.
Kriging is an estimation method resembling moving averages of spatially distributed values taken from ad-jacent values. These values are considered to be interde-pendent, in accordance with the semivariance function.4
The estimates were calculated by means of equation 1.
where:
Z*(χ0) is the estimated value at the point χ0;
N is the number of pairs of measured values Z (χi) that
are involved in the estimate;
li is the weighting associated with each measured value Z (χι).
The formatting of the databases at CVE-SP was per-formed using the SPSS software. The “registration year” and “municipality of residence” were the vari-ables selected for the leprosy cases.
The geostatistical analyses utilized digital-format car-tographic bases showing the outline of the State of São Paulo with the geographic locations of its municipali-ties in the form of latitudes and longitudes. The cases were aggregated and georeferenced at the centroids of the notification municipalities, in accordance with the homes involved. The analysis sequence was as follows. Using the GEO-EAS software,3 the semivariances and
the parameters for the adjusted mathematical model were calculated, with the utilization of the experimen-tal semivariogram given by equation 2.5
where: N(h) is the number of pairs of sampled values (Z(χi), Z(χi + h)) that are separated by a distance h.
With these calculated values, the model adjusted to the semivariogram was graphically traced out. The condition for adjusting the model to the experimen-tal data was that this model should represent the trend of γ(h) in relation to h, and that γ(h)≥0 g(-h) = γ(h), whatever h is; a positively conditional model.* The Gaussian model was adjusted to the semivariogram, and was given by equation 3.
where: d is the maximum distance over which the semivariogram is defined.
The following parameters involved in the model were determined: (a), (c0), (c).
( )
∑
( )
=
=
N
i i i
χ Z χ Z 1 0 * λ (1) ∑ = + -= ) ( 1 2 * [ ] ) ( 2 1 ) ( h N
i i i
h) Z(χ ) Z(χ h N h γ (2)
*Guimarães EC. Geoestatística básica aplicada. Uberlândia: Faculdade de Matemática da Universidade Federal de Uberlândia; 2004.
( )
-+ = 2 2 0 3 exp 1 a h c c hAfter calculating these values, the interpolation proc-ess using kriging was performed by means of the Surfer software,13 to obtain estimates of the numbers
of leprosy cases at non-sampled locations. This ena-bled the construction of maps showing the risk of leprosy occurrence in the State of São Paulo.
RESU LTS
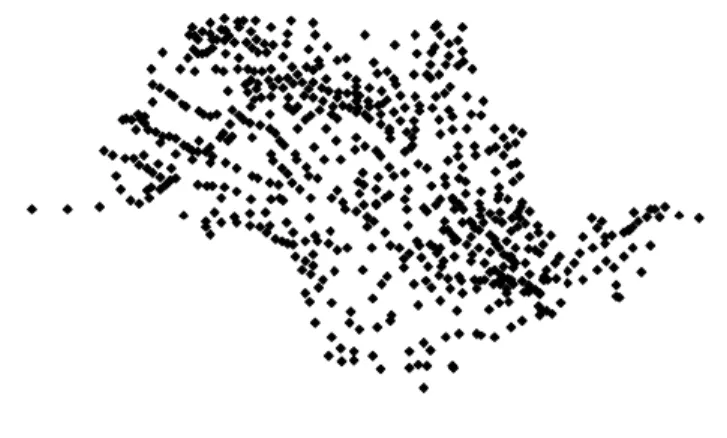
Among the 645 municipalities in the State of São Paulo that existed at the time that was studied, at least one case of leprosy was notified in 606 of them. These were georeferenced in accordance with the homes involved, using latitudes and longitudes, as shown in Figure 1.
The mean age of the cases studied was 43 years (±17); 58% were male and 57% were multibacillary.
Through the geostatistical analysis, the construction of the experimental semivariogram presented the fol-lowing parameters:
c0=150; c=9000; a=0.55.
The span determined extended to 0.55 de-grees from the georeferenced coordinates, which corresponded to approximately 60 km.
The values found from equation 2 are shown in the Table.
Figure 2 shows the semivariogram for the lep-rosy cases and its adjustment by means of the Gaussian model.
The estimates of the semivariances as a func-tion of the distance and the models adjusted to the estimates were displayed graphically to make it possible to view and interpret the spatial variability.
The adjustment of the semivariogram and the
interpolation performed by ordinary kriging, with 10,000 interpolated points, made it possible to draw up a contoured map. In terms of probabilities, these express areas of greater or lesser risk (darker and lighter regions of the map, respectively) of the occurrence of cases. Figure 3 shows the contoured map, while Fig-ure 4 shows a surface map.
These results indicated a pattern of concentration of cases on the northeastern, northern and western bor-ders of the State. Nonetheless, the probability that at least 10 cases would occur in practically all parts of the State was noted.
D ISCU SSIO N
One possible limitation of the present study relates to the way in which the information on the leprosy cases were collected. The da-tabase utilized is open and decentralized, and several services feed into it, with few control mechanisms for data consistency. Thus, it is difficult to evaluate whether there might have been data duplication.
Diagnostic errors may have occurred, since leprosy is a complex disease and its differ-ential diagnosis covers many other dis-Table - Estimated experimental semivariances for leprosy cases. State of São Paulo, 1991-2002.
h (distance) γ(h) (estimated)
0.078 844.50
0.155 2043.53
0.253 3678.52
0.346 7639.85
0.449 9238.61
0.549 7993.66
0.649 8791.09
Figure 1 - Municipalities in which the notified leprosy cases were located. State of São Paulo, 1991 to 2002.
Figure 2 - Semivariogram of the leprosy cases, adjusted by means of the Gaussian model. São Paulo, 1991-2002.
0 2,000 4,000 6,000 8,000 10,000
0 0.1 0.2 0.3 0.4 0.5 0.6 0.7 0.8
Distance in degrees of georeferenced coordinates
eases. Bacilloscopy is often not performed, and the dermatological-neurological as-sessment becomes the criterion for diag-nostic confirmation.
The data on cases detected among children less than one year were withdrawn from the analysis, because of the possibility of error in this information. This is because leprosy is a disease with a long incubation period and slow evolution and therefore it is infre-quent for children of this age group to be affected.
From 1998 onwards, the services and actions relating to leprosy diagnosis, treatment and control were included among the procedures for basic healthcare, i.e. the care for individu-als with this disease were brought within municipal administration. Nevertheless, the environmental and social processes that pro-mote or restrict situations of risk to health are not limited to administrative borders.
Nogueira et al9 (1995) reported that there
were no records of new cases of leprosy in many municipalities of São Paulo in several years of the period they studied, which they called “silent municipalities”. Taking into account the long latent period for this
dis-ease, these municipalities have, in the absence of cases, tended to relax their surveillance and disman-tle the specialized health services. Corroborating this hypothesis, Lastória & Putinatti7 (2004) reported
find-ing 18 new cases of leprosy in silent municipalities over a three-year period. It is evident that, in regions where this pattern is observed, specific controls should be instituted with the aim of optimizing the application of public resources.
Opromolla et al11 (2003) reported a case of advanced
Virchow’s leprosy in a 61-year-old patient in the mu-nicipality of Agudos, in the interior of the State of São Paulo. Although such cases are not so frequent today, they do exist and have importance in conserv-ing the endemic disease, particularly because of the limitations on examining all the patient’s contacts.
In the present study, the northeastern, northern and western borders of the State were identified as areas at high risk, and consequently with greater potential for maintaining the endemic disease.
The northeastern region of the State of São Paulo is an area that historically has had a high concentration of leprosy cases. In the first survey of patients,
car-ried out in 1820, there were 63, 98 and 207 cases in Jacareí, Taubaté and Campinas, respectively.8
The northern and western borders of the State of São Paulo had significant concentrations of cases of the disease, and these have particularly contributed to-wards the records of cases diagnosed over the last few years in the State. This is related to the relatively recent upsurge in occurrences in the center-west re-gion of Brazil.
Maurano8 (1939) reported that the first leprosy cases
possibly entered the State of São Paulo through the Paraíba valley region, from where it disseminated throughout the State, following the routes taken by the settlers.
There are still vast areas at risk, although the dissemi-nation of cases is slower, probably because of a com-bination between the saturation of susceptible indi-viduals and the various control strategies adopted in the State.
The propagation of leprosy in São Paulo can be explained by the migratory movements in the State. The tendency towards migratory behavior was Figure 3 - Spatial distribution of the occurrence of leprosy cases. State of São Paulo, 1991-2002.
associated with the process through which eco-nomic development moved into the interior of the State. Between 1980 and 1991, the regions in the eastern part of the State (Campinas, Santos, São José dos Campos and Ribeirão Preto) presented reductions in the rates of migration. On the other hand, while the western and northern regions of the State (Araçatuba, Presidente Prudente and Marília) had presented negative migration rates during the 1970s, the outflow of population di-minished during the 1980s. Between 1980 and 1991, the region of São José do Rio Preto, Barretos and Franca had positive rates. In the central re-gions of the State (Sorocaba and Bauru) the migra-tion levels were maintained.*
Despite the changes in demographic dynamics in these regions throughout the period from 1980 to 1996, the population of the State of São Paulo is in practice concentrated in six regions: the metropoli-tan regions of São Paulo, Campinas, Sorocaba, São José dos Campos, Santos and São José do Rio Preto. These are precisely the regions where the greatest densities of leprosy cases were observed. More
de-tailed studies using not only epidemiological and operational indicators, but also the socioeconomic conditions in these areas, will probably point to-wards the peripheries of these large population cent-ers as the places with greatest probability for this disease to occur.
Thus, starting from the presupposition that spatial vari-ability occurs when “nearby points tend towards more similar values than distant points”, the verification of areas with a probability of risk, through using spatial dependence analysis for leprosy cases, may be a valu-able tool for controlling leprosy in these regions.
ACKN O W LED GEM EN TS
To the Fundalção Sistema Estadual de Análises de Dados (Foundation for the State Data Analysis Sys-tem - SEADE), for providing the digital cartographic bases, and to the Leprosy Division of the “Alexandre Vranjac” Epidemiological Surveillance Center of the Disease Control Coordination Office of the São Paulo State Health Department, for making available the SINAN leprosy database.
REFERÊN CIAS
1. Barcellos CC, Sabroza PC, Peiter P, Rojas LI. Organi-zação espacial, saúde e qualidade de vida: análise espacial e uso de indicadores na avaliação de situações de Saúde. Inf Epidemiol SUS. 2002;11(3):129-38.
2. Dharmendra. Control and eradication of leprosy. Indian J Lepr. 1986;58(2):175-84.
3. Engl und E, Sparks A. GEO -EAS1.2.1 - geoestati cal envi ronmental assessment softw are: user’s gui de. Las Vegas (N V): U S Envi ronmental Protecti on Agency; 1991.
4. Goovaerts P. Geoestatistics for natural resources evaluation. New York (NY): Oxford University; 1997. 5. Krige DG. A statistical approach to some basic mine
evaluation problems on the Witwatersrand. J Chem Metall Min Soc S Afr. 1951;52:119-39.
6. Lacerda J, Cal vo M , Frei tas S. D i ferenci ai s i ntra-urbanos no município de Florianópolis, Santa Catarina, Brasil: potencial de uso para o planeja-mento em saúde. Cad Saúde Pública.
2002;18:1331-8.
7. Lastória J, Putinatti M . U tilização da busca ativa de hanseníase: relato de uma experiência de aborda-gem na detecção de casos novos. Hansenol Int. 2004;29:6-11.
8. Maurano F. História da lepra em São Paulo. São Paulo: Revista dos Tribunais; 1939.
9. Nogueira W, M arzliac M LC, Gonçalves O SJ, Brasil M TLRF. Perspectivas de eliminação da hanseníase. Hansenol Int. 1995;20:19-8.
10. Opromolla DVA, editor. Noções de hansenologia. Bauru: Centro de Estudos Dr. Reynaldo Quagliato; 2000.
11. Opromolla DVA, Opromolla MA, Ura S. Manutenção da endemia hansênica. Hansenol Int. 2003;28:85-8. 12. O rganização Pan-Americana da Saúde; O rganização
Mundial da Saúde. Leprosy Elimination Monitoring (LEM) in Brazil, 2003. Washington (DC); 2003. 13. Surfer version 6.01 - surface mapping system
[software em disquete]. Golden (CO): Golden Softw are; 1995.
14. WHO Study Group. Chemotherapy of leprosy for control programmes. Geneva; 1982. (TRS, 675). 15. World Health Assembly. Elimination of leprosy:
resolution of the 44th World Health Assembly. Geneva: World Health Organization; 1991. (WHA 44.9). 16. W orld Health Organization. Global strategy for
further reducing the leprosy burden and sustaining leprosy control activities (plan period: 2006-2010). Geneva; 2005.
Research conducted in the Department of Public Health Faculdade de Medicina de Botucatu, Universidade Estadual Paulista.