Subpopulation Activation of an Integrative and
Conjugative Element
Ryo Miyazaki., Marco Minoia., Nicolas Pradervand, Sandra Sulser, Friedrich Reinhard, Jan Roelof van
der Meer*
Department of Fundamental Microbiology, University of Lausanne, Lausanne, Switzerland
Abstract
Conjugative transfer of the integrative and conjugative element ICEclcin the bacteriumPseudomonas knackmussiiis the consequence of a bistable decision taken in some 3% of cells in a population during stationary phase. Here we study the possible control exerted by the stationary phase sigma factor RpoS on the bistability decision. The gene for RpoS inP. knackmussiiB13 was characterized, and a loss-of-function mutant was produced and complemented. We found that, in absence of RpoS, ICEclctransfer rates and activation of two key ICEclcpromoters (Pintand PinR) decrease significantly in cells
during stationary phase. Microarray and gene reporter analysis indicated that the most direct effect of RpoS is on PinR,
whereas one of the gene products from the PinR-controlled operon (InrR) transmits activation to Pintand other ICEclccore
genes. Addition of a secondrpoScopy under control of its native promoter resulted in an increase of the proportion of cells expressing the Pintand PinRpromoters to 18%. Strains in whichrpoSwas replaced by anrpoS-mcherryfusion showed high
mCherry fluorescence of individual cells that had activated Pintand PinR, whereas a double-copyrpoS-mcherry–containing
strain displayed twice as much mCherry fluorescence. This suggested that high RpoS levels are a prerequisite for an individual cell to activate PinRand thus ICEclctransfer. Double promoter–reporter fusions confirmed that expression of PinRis
dominated by extrinsic noise, such as being the result of cellular variability in RpoS. In contrast, expression from Pintis
dominated by intrinsic noise, indicating it is specific to the ICEclctransmission cascade. Our results demonstrate how stochastic noise levels of global transcription factors can be transduced to a precise signaling cascade in a subpopulation of cells leading to ICE activation.
Citation:Miyazaki R, Minoia M, Pradervand N, Sulser S, Reinhard F, et al. (2012) Cellular Variability of RpoS Expression Underlies Subpopulation Activation of an Integrative and Conjugative Element. PLoS Genet 8(7): e1002818. doi:10.1371/journal.pgen.1002818
Editor:Diarmaid Hughes, Uppsala University, Sweden
ReceivedFebruary 5, 2012;AcceptedMay 23, 2012;PublishedJuly 12, 2012
Copyright:ß2012 Miyazaki et al. This is an open-access article distributed under the terms of the Creative Commons Attribution License, which permits
unrestricted use, distribution, and reproduction in any medium, provided the original author and source are credited.
Funding:This work was supported by grants from the Swiss National Science Foundation (31003A_124711 and 3100A0-108199). The funders had no role in study design, data collection and analysis, decision to publish, or preparation of the manuscript.
Competing Interests:The authors have declared that no competing interests exist.
* E-mail: [email protected]
.These authors contributed equally to this work.
Introduction
Integrative and conjugative elements (ICE) are a newly recognized class of mobile DNA elements in prokaryotes [1–4]. ICE come in different families, represented by the host cell range and gene similarities, but all have a similar mechanistic ‘life-style’ [2]. Under most circumstances the ICE resides in one or more positions in the host chromosome like a prophage [5]. At frequencies of typically less than 1022
per cell and under particular growth conditions or environmental signals ICE excise by recombination between short direct repeats at either end (within the attachment sites attL and attR) [6–8]. The double-stranded excised ICE can undergo DNA processing as for plasmid conjugation [9], and transfers a single-stranded ICE-DNA to a new host cell. In the new host cell the ICE-DNA is replicated and integrates by site-specific recombination between the ICE-located
attP-site and the chromosomal attachment site attB [1,2]. Interestingly, many ICE integrate in genes for tRNA [10] and ICE integrase sequences suggest phage ancestry [11].
to the presence of different types of genomic islands [24,26,27]. Such comparisons have further implied that genomic islands are largely responsible for the adaptive capacities of prokaryotic species [28].
Although several ICE have been genetically and functionally characterized, and their general importance for bacterial evolution and adaptation is now widely appreciated, still very little is known about their cell biology [2]. One of the most intriguing aspects of the functioning of an ICE is its low frequency of conjugation (e.g., 1% or less of a population of cells), which suggests that in only very few individual cells in a clonal population a decision is made to activate the ICE. The types of mechanisms and regulatory control that can achieve such low frequency differentiation are still widely unexplored. Some ICE bear regulatory systems controlling excision that involve phage-type repressors [29–31], which therefore may behave similar as the phage lambda bistable lysogenic/lytic switch [32]. Other ICE-classes, however, bear no gene functions with significant homologies to known phage lytic switches. Previously, we showed that excision and transfer of the element ICEclc in Pseudomonas knackmussii B13 must be the consequence of a bistable switch that culminates in the activation of theintB13integrase promoter (hereafter named Pint) in 3% of
cells during stationary phase [33]. ICEclcis a 103-kb sized element with strong homologies to a large number of genomic islands in
Beta-andGammaproteobacteria, and is named after its propensity to
provide the host cell with the capacity to metabolize chlorinated catechols, encoded by the clc genes [21]. Two identical ICEclc
copies reside in the chromosome of strain B13, which are interspaced by 340 kb (Miyazaki, unpublished). Activation of the
intB13 integrase leads to excision and formation of a closed
circular ICEclc intermediate [33]. Transfer of the circular intermediate is dependent on a DNA relaxase, which makes a single-stranded break, but, exceptionally, can initiate transfer at two origins of transfer (oriT) on ICEclc[9]. Single cell studies using fluorescent reporter fusions showed that Pint activation was
preceded by and dependent on expression of a protein named InrR (for INtegRase Regulator) in the same individual cell (Figure 1). InrR is encoded in a small four-gene operon on ICEclc
under control of another bistably expressed promoter (PinR) [33].
This suggested that ICE excision and activation in general may be
the consequence of a bistable switch, and that the frequency of ON-setting is a determining factor for the frequency of ICE conjugation. Bistability as a phenomenon is most well-known from competence development and sporulation inBacillus subtilis, which lead to phenotypically differentiated cells [32,34,35]. Although bistability is thought to originate from stochastic expression noise, this in itself is not sufficient to ‘lock’ cells in different phenotypic behaviour, but rather needs to be amplified and stabilized by regulatory mechanisms that include double positive feedback loops or double negative loops [32]. On the other hand, it is conceivable that the noisiness sets the threshold for the proportion of cells that display the bistable trait.
The goal of the underlying work was to explore whether noisiness may lay at the basis of determining the proportion of cells in which ICEclcbecomes active. We focused our attention on both Pint and PinR promoters, which are expressed during stationary
phase and only in a subpopulation of cells [8,33,36]. Initiation of ICEclc transfer in stationary phase cells further suggested involvement of a specific sigma factor such as RpoS (ss). RpoS is the stress-starvation sigma factor that inP. aeruginosacontrols the expression of some 772 genes at the onset of stationary phase [37], 40% of which have also been identified as quorum-sensing controlled. Deletion ofrpoS in P. aeruginosa does not result in a dramatically changed phenotype, although such mutants survive 50-fold less well to heat and salt shocks than wild-type, and produce less extracellular proteins such as elastase, exotoxin A, and alginate [38]. In order to establish the role of a stationary phase sigma factor in activation of ICEclc, we identified anrpoS -gene inP. knackmussiiB13 and studied the effects of interruption and subsequent complementation using single-cell reporter gene fusions to Pint and PinR. Interestingly, a B13 wild-type
equip-ped with a second rpoS gene copy displayed a much higher
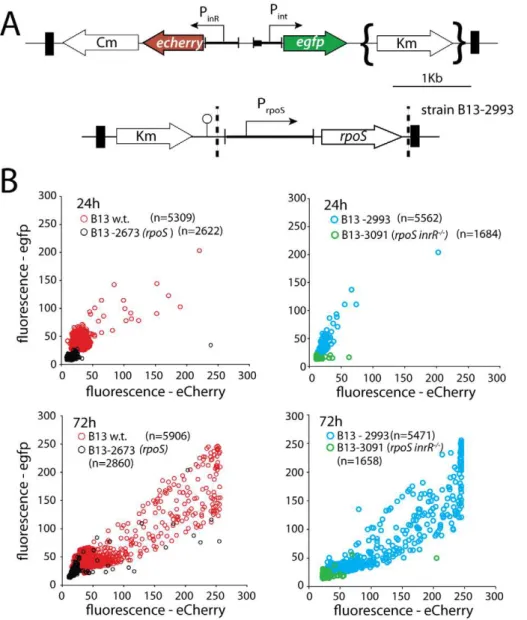
Figure 1. Schematic representation of the ICEclcgenetic layout and relevant regulatory features.(A) Excised and integrated ICEclc
(not to scale) with its flankingattLandattRsites, and the 18-bp repeat sequences (black pentangle) that are the target of the IntB13 integrase. The ‘transfer region’ denotes the,50 kb ICEclcpart largely conserved
with other genomic islands [21]. (B) The region of the open reading frames under control of PinR, among whichinrR, the product of which
has been implicated in relaying bistable expression to the Pintpromoter
[34]. (C) The gene region aroundrpoSin strain B13. doi:10.1371/journal.pgen.1002818.g001
Author Summary
subpopulation of cells expressing both Pintand PinRpromoters. To
study whether actually individual cell levels of RpoS could be somehow deterministic for the activation of ICEclc we replaced nativerpoSby a gene for an active RpoS-mCherry fusion protein. Finally, we measured contributions of intrinsic and extrinsic noise on Pintand PinRpromoters from covariance in the expression of
double gene reporters placed in single copy on different parts of the B13 chromosome [39]. Our results indicate that individual cells with the highest RpoS levels in the population are more prone to activate Pintand PinR, which suggests that the stochastic variation
in RpoS levels across a population of cells is transduced into ICEclc
activation and transfer in a small subpopulation.
Results
Identification of therpoSgene fromP. knackmussiistrain B13
In order to identify therpoSgene ofP. knackmussiistrain B13 we used PCR amplification with primers designed against conserved regions in a multiple alignment ofrpoSsequences ofP. aeruginosa,P.
putida KT2440 and P. fluorescens (Figure S1). The nucleotide
sequence of the amplified fragment from strain B13 showed high homology to a set ofrpoSgenes from other pseudomonads, with a percentage nucleotide identity between rpoSB13 and rpoS from
different P. aeruginosastrains of 83% over 989 bp. The predicted amino acid sequence of RpoSB13positioned most closely to that of
P. aeruginosaPAO1 (Figure S2). Flanking regions of rpoSB13 were
subsequently recovered from a draft genome sequence of P.
knackmussiiB13 (Miyazaki, unpublished data), which showed that
the rpoS region of strain B13 is syntenic to that inP. aeruginosa
PAO1 with a gene for a lipoprotein (nlpD) upstream ofrpoS, and an
rsmZ-like gene and a gene for a ferredoxin (fdxA) downstream (Figure 1). We therefore concluded that this region in B13 most likely encodes a similar stationary phase sigma factor as in P. aeruginosa.
A single crossover rpoS mutant was produced by marker insertion (strain B13-2671, Figure S3, Table 1). Despite repeated attempts we were not successful in producing a double recombi-nant with an internal rpoSdeletion. However, it was possible to replacerpoSB13by a gene for a RpoSB13-mCherry fusion protein
(see below). Maximum specific growth rates of strain B13-2671 (rpoS) on MM with 5 mM 3CBA were similar as B13 wild-type (0.2260.01 versus 0.2660.01 h21, respectively), but the onset of exponential growth was slightly delayed in B13-2671 (rpoS) (Figure S4A). Reversion to the wild-type allele occurred in less than 1% of cells in stationary phase (Figure S4B).
RpoS is implicated in expression of the bistable ICEclc promoters PinRand Pint
The fact that most of the core genes of ICEclc are solely expressed in stationary phaseP. knackmussiiB13 cells [36], and the presence of sequence features typical for RpoS in the PinR
promoter [33] had suggested an implication of RpoS in controlling ICEclc stationary phase expression. Inactivation of rpoS in B13 indeed resulted in reduced expression of both PinR and Pint
promoters. This was evident, first of all, from a reduced proportion of cells in a B13-2673 (rpoS) compared to B13 wild-type population expressing eCherry and eGFP above detection threshold from single copy transcriptional fusions to PinR and Pint, respectively
(Figure 2B, Table 2). Secondly, stationary phase cells of B13-2673 (rpoS) produced a lower average reporter fluorescence signal than wild-type cells (Table 2). In most individual cells the magnitudes of eGFP and eCherry expression correlated, confirming that PinRand
Pintwere expressed in the same cell (Figure 2B). Both eCherry and
eGFP were not visibly expressed in B13-2673 (rpoS) cells examined after 24 h in stationary phase, but after 72 h a small fraction of cells still developed eGFP and eCherry fluorescence (Figure 2B). This delay (48 h) is much longer than would be expected from the slight growth delay (5 h) of B13-2673 (rpoS) compared to B13-78 wild-type to reach stationary phase (Figure S4). Late (72 h) expression of Pint and PinR in B13-2673 (rpoS) was not due to
reversion of therpoSmutation (Figure S4B).
To confirm that the effect on Pintand PinRexpression was caused
by a disruption ofrpoS, we complemented strain B13-2673 with a single copy mini-Tn5insertion containingrpoSB13under control of
its own promoter (PrpoS, Figure 2A). Both the proportion of cells
and their average fluorescence levels of both fluorescent markers from PinR and Pint were restored to wild-type levels in therpoS
-complemented strainP. knackmussiiB13-2993 (Figure 2B, Table 2). The number of cells expressing autofluorescent proteins from both promoters was even slightly higher in the rpoS comple-mented strain than in B13 wild-type after 96 h in stationary phase, although this was not a statistically significant difference (Table 2).
We can thus conclude from this part that, because both the expression level of eGFP and eCherry in single cells and also the percentage of cells that expressed both markers in strain B13-2673 (rpoS) was significantly lower than in B13 wild-type and therpoS -complemented strain (B13-2993), RpoS is necessary for achieving native transcription levels from the PinRpromoter (i.e., within 48 h
of stationary phase). On the other hand, RpoS is not absolutely essential, since cells with interruptedrpoS gene eventually (96 h) express PinRand Pint, which was not due to reversion of therpoS
mutation (Figure S4B).
Direct influence of RpoS on integrase expression Since the observed lower expression from the integrase promoter (Pint) in the rpoSmutant could be the result of either
less InrR being formed from PinR, or of a direct control by RpoS of
Pint, we compared eGFP expression from a single copy Pint-egfp
transcriptional fusion in B13, the B13rpoSmutant (B13-2976) and a B13 lacking bothinrRcopies (B13-2979, Table 1). Interestingly, the proportion of cells expressing eGFP and their average fluorescence were much lower in a strain lacking bothinrRcopies than in the strain missing RpoS (Figure S5, Table 3), suggesting that the major influence of RpoS is indirectly via InrR.
Since the proportion of cells expressing eGFP from Pint in an
inrR2/2 background was already so low, it was not possible to detect statistically significant differences to a strain that would carry the triple rpoS and inrR2/2 mutations (Table 3). For this reason, we produced the triplerpoS inrR2/2 mutation in a B13 strain containing a dual reporter of Pint-egfpand PinR-echerry
(B13-3091), and correlated eGFP to eCherry expression. Since this strain would be devoid of InrR-mediated expression of Pint, we
expected that expression ofegfpfrom Pintin absence ofrpoSwould
be lower than expression ofecherryfrom PinR. Indeed, there was a
slight tendency for the mean proportion of cells expressing eGFP (from Pint) in strain B13-3091 (rpoS,inrR2
/2) to be lower than that expressing eCherry (from PinR), although this was only poorly
significant after 96 h (P = 0.04), again because of the very low subpopulation sizes (,0.5%, Table 2). Purified and reconstituted RpoS-RNA polymerase from E. coli bound DNA fragments encompassing Pintinin vitroelectrophoretic mobility shift assays (K.
Globig and J. van der Meer, unpublished data). This suggests that transcription from Pint is both indirectly (via InrR) and directly
ICEclctransfer and core gene expression is reduced in absence of functional RpoS
Whereas expression of the reporter gene fusions was interpreted as being representative for the behaviour of the native Pintand PinR
promoters on ICEclc, we also determined ICEclc core gene expression and transfer frequencies from B13 wild-type or derivatives as donor andP. putidaUWC1 as recipient. Expression of the ICEclc core genes in stationary phase cells measured by microarray analysis was lower (up to 27-fold) for both B13-2671 (rpoS) and B13-2201 (inrR2/2) compared to B13 wild-type (Figure S6). Interestingly, expression of the inrR operon was not only downregulated in B13-2671 (rpoS) but also in B13-2201 (inrR2/2) (Figure S6), suggesting autoregulation by InrR.
Not only ICEclc core gene expression but also transfer frequencies were significantly lower at all time points from B13-2673 (rpoS) or B13-3091 (rpoS,inrR2/2) than from B13-2581 wild-type or the rpoS-complemented B13 rpoS mutant (B13-2993) as donor (Figure 3, Table S1). ICEclctransfer frequencies from the complemented B13 rpoS mutant were not significantly different than those from B13 wild-type. Transfer frequencies from B13-2673 (rpoS) as donor were significantly higher than from B13-3091
(rpoS,inrR2/2) as donor, but only after 96 h mating time (Table S1). These results thus corroborated that RpoS is favorable (but not essential) for expression of ICEclc core genes and thus for conjugative transfer. RpoS exerts its control mainly via its interaction with the inrR promoter, with InrR relaying the activation further to other ICEclccore genes, but also via direct interaction at Pint.
Correlation betweenrpoSand Pintor PinR expression Since in the absence of RpoS the proportion of cells expressing Pint
or PinRin the population diminishes but not completely disappears,
we wondered whether the levels of RpoS or the magnitude ofrpoS
expression in individual B13 cells are a precondition for cells to become locked in the PinR- Pintbistable ‘ON’-state. Expression from
PrpoSis maximal at the end of the exponential phase and in stationary
phase, as shown by the appearance of mCherry fluorescence from single copy PrpoS-mcherryand rpoS-mCherry fusions in B13-3165 or
B13-3564, respectively (Figure S7), which coincides with the timepoint of activation of PinRand Pint.
To correlate expression from rpoS with that of Pint or PinR in
individual cells we created B13 derivatives with single copy
Table 1.Strains used in this study.
Strain number Description Remarks Reference
78 Pseudomonas knackmussiiB13 Original host for ICEclc [49]
1292 Pseudomonas putidaUWC1, RifR [61]
1346 P. knackmussiiB13 mini-Tn5(Pint,jim2-egfp, KmR) jim2intB13-promoter fragment in 78 [58]
2201 P. knackmussiiB13inrR2/2 Both copies ofinrRdeleted [34]
2581 P. knackmussiiB13 mini-Tn5(Pint-egfp, PinR-echerry, KmR) Dual PintPinRreporter strain from 78 [34]
2671 P. knackmussiiB13rpoS, TetR Single recombinant via integration of pME3087-‘
rpoS’ This study
2673 P. knackmussiiB13rpoS, mini-Tn5(Pint-egfp, PinR-echerry, KmR), TetR Dual PintPinRreporter strain from 2671 This study
2717 P. knackmussiiB13 mini-Tn5(Pint-egfp, KmR), mini-Tn5(Pint-echerry, TetR) Double Pintreporter in 78 This study
2976 P. knackmussiiB13rpoS, mini-Tn5(Pint,jim2-egfp, KmR) Pint[jim2] reporter strain from 2671 This study
2979 P. knackmussiiB13inrR2/2, mini-Tn5(P
int,jim2-egfp, KmR) Pint[jim2] reporter strain from 2201 This study
2993 P. knackmussiiB13rpoS, mini-Tn5(PrpoS-rpoS, KmR),
mini-Tn5(Pint-egfp, PinR-echerry), TetR
rpoScomplemented in 2673 This study
3091 P. knackmussiiB13inrR2/2,rpoS, mini-Tn5(P
int-egfp, PinR-echerry, KmR) rpoSmutant in 2201 background, with dual
PintPinRreporter
This study
3165 P. knackmussiiB13 mini-Tn5(PrpoS-mcherry, KmR) PrpoSreporter strain from 78 This study
3183 P. knackmussiiB13 mini-Tn5(Pint-egfp), mini-Tn5(PrpoS-mcherry, KmR) Pintreporter strain from 3165 This study
3189 P. knackmussiiB13 mini-Tn5(PinR-egfp), mini-Tn5(PrpoS-mcherry, KmR) PinRreporter strain from 3165 This study
3195 P. knackmussiiB13 mini-Tn5(Pint-egfp), mini-Tn5(Pint-echerry, TetR),
mini-Tn5(PinR-orf95213-inrR, KmR)
Extra copy ofinrRin 2717 This study
3201 P. knackmussiiB13 mini-Tn5(Pint-egfp), mini-Tn5(Pint-echerry, TetR),
mini-Tn5(PrpoS-rpoS, KmR)
Extra copy ofrpoSin 2717 This study
3228 P. knackmussiiB13rpoS, mini-Tn5(PrpoS-mcherry, KmR), TetR Transcriptional PrpoSreporter strain from 2671 This study
3257 P. knackmussiiB13 mini-Tn5(Pint-egfp, PinR-echerry),
mini-Tn5(PinR-orf95213-inrR, KmR)
Extra copy ofinrRin 2581 This study
3260 P. knackmussiiB13 mini-Tn5(Pint-egfp, PinR-echerry),
mini-Tn5(PrpoS-rpoS, KmR)
Extra copy ofrpoSin 2581 This study
3555 P. knackmussiiB13rpoS-mCherry, mini-Tn5(PinR-egfp), KmR rpoSreplaced byrpoS-mcherry(translational fusion),
plus single copy transcriptional PinR-egfpfusion
This study
3564 P. knackmussiiB13rpoS-mcherry, mini-Tn5(Pint-egfp), KmR as 3555, with single copy transcriptional Pint-egfpfusion This study
3641 P. knackmussiiB13 mini-Tn5(PinR-egfp, KmR), mini-Tn5(PinR-echerry, TetR) Double PinRreporter in 78 This study
3712 P. knackmussiiB13rpoS-mCherry, mini-Tn5(Pint-egfp),
mini-Tn5(PrpoS-rpoS-mcherry, KmR)
Extra copy ofrpoS-mCherryfusion in 3564 This study
PrpoS-mcherry and Pint-egfpor PinR-egfpfusions (3183 and
B13-3189, respectively). mCherry expression from PrpoSin stationary
phase is normally distributed among all cells with a mean around 50 RFU (Figure 4A). In contrast, simultaneous eGFP expression from Pint-egfpor PinR-egfpin B13-3183 and B13-3189, respectively,
occurs highly skewed in only 3% of cells (Figure 4A). However, there was no particular correlation between expression of mCherry and eGFP in single cells.
To better account for post-transcriptional effects on RpoS expression we repeated the experiment with B13 derivatives expressing RpoS translationally fused to mCherry at its C-terminal end (RpoS-mCherry) from the originalrpoSlocus. This was done by substituting the native rpoSB13 by the rpoSB13-mcherry allele.
Similar as B13 wild-type RpoS also RpoS-mCherry was expressed
during stationary phase in all cells with normal distribution (Figure 4B), and eGFP was again expressed in 3–6% of cells in the population from either the Pintor PinRpromoter (strains B13-3564
and B13-3555, respectively). RpoS-mCherry but not an N-terminal mCherry-RpoS fusion protein complemented B13-rpoS
for bistable Pint or PinR-dependent eGFP expression (data not
shown). This indicated that the RpoS-mCherry fusion protein functionally replaces B13 wild-type RpoS. Significantly, only B13-3564 and B13-3555 cells expressing the highest RpoS-mCherry levels had also activated eGFP from Pint or PinR, respectively,
although not all cells with high RpoS-mCherry levels expressed high levels of eGFP (Figure 4C). This suggests that the RpoS level
per se is not sufficient to elicit PinR or Pint expression but is a
precondition for PinR-or Pint-expression to occur.
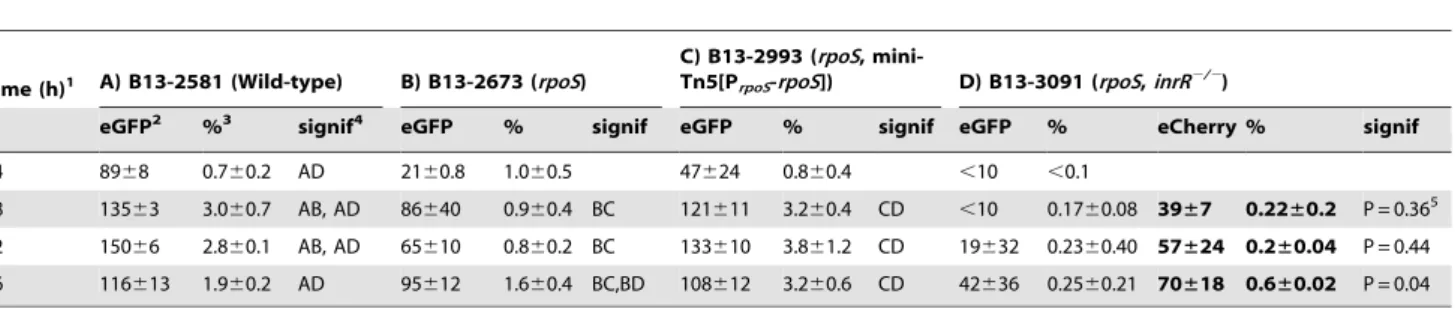
Figure 2. Effect ofrpoSinterruption on reporter gene expression from two key bistable promoters (Pintand PinR) controlling ICEclc
activity in stationary phaseP. knackmussiicells grown on 3CBA.(A) Relevant details of the Pint-egfp, PinR-echerrymini-transposon reporter
construct and of the mini-transposon introducing the nativerpoSgene under control of its own promoter (only in the complemented strain B13-2993, orientation of this insert unknown). Transposon boundaries indicated by thick black lines. (B) Scatter plots showing eGFP (from Pint) and eCherry
(from PinR) fluorescence intensities in single cells (circles) of B13-2581 (wild-type), B13-2673 (rpoS), B13-2993 (rpoScomplemented intransby mini-Tn
withrpoS), or B13-3091 (rpoS,inrR2/2) at 24 h and 72 h in stationary phase. Note the camera saturation in the eCherry channel above 256 units (8-bits). For signal quantification and significance testing, see Table 2.
Globally increasing RpoS levels augments the
subpopulation size of cells expressing the PinRpromoter To artificially increase RpoS expression more globally across all cells in the population, with the idea that this would precondition more cells to activate PinR and Pint, an additional rpoSB13 copy
under control of its own promoter was introduced by mini-Tn5
transposition (B13-3260, Figure 5A). Strikingly,,18% of all cells in stationary phase cultures of B13-3260 (rpoS+) expressed eGFP
from Pint and eCherry from PinR compared to 5% in B13-2581
wild-type (Figure 5B–5E). ICEclctransfer from B13-3260 (rpoS+) as
donor toP. putidaUWC1 as recipient was twice as high as with B13 wild-type after the same mating contact time, although this was not a statistically significant difference (48 h, Table S2). In contrast, B13 with an extra copy ofinrR(strain B13-3257) did not significantly differentially express both reporter genes from PinR
and Pint (Figure 5B–5E). To determine whether the higher
subpopulation of cells expressing both Pint and PinR-promoters
was due to a generally higher level of RpoS in cells, we compared the RpoS-mCherry fluorescence levels in B13 with nativerpoSB13
replaced by therpoSB13-mcherryallele (B13-3564) and in the same
strain into which another single copy of rpoSB13-mcherry was
transposed (B13-3712). Indeed, the mean mCherry fluorescence in B13-3712 was almost twice as high as in B13-3564 (Figure 5F), suggesting that in double-copyrpoSstrains on average more cells became permissive and could induce PinRand Pint.
One extra copy ofrpoSorinrRchanges noise level in gene expression
In order to further examine how variability in RpoS levels would be linked to bistable expression of PinR and Pint, we
measured the contribution of intrinsic and extrinsic noise on both promoters in individual cells. Noise was deduced from intra- and intercellular variations of reporter gene expression (eGFP and eCherry) from two individual single copy transcription fusions to Pintor PinR, placed at different positions of the B13 chromosome as
suggested in Elowitzet al.[39]. Fluorescence intensities from eGFP and eCherry were recorded in three independent clones with different insertion positions of the reporter fusion constructs to avoid positional effects as much as possible. Both markers essentially expressed in the same subpopulation of cells (Figure 6). Interestingly, the total noise was significantly higher on the Pint
promoter than on PinR (Table 4). Moreover, Pint expression was
dominated by intrinsic rather than by extrinsic noise, which suggests that the variation in expression from Pintdepends more
strongly on variations in small numbers of regulatory molecules in individual cells, such as would be expected when Pintis at the end
of a cascade involving InrR.
Adding an extra copy ofrpoSor ofinrRunder control of their own promoters into the double-Pint reporter strain resulted in a
significant decrease of intrinsic and total noise compared to wild-type (Table 4), which was insensitive to the size of the sampled
Table 2.Effect ofrpoSinactivation on reporter fluorescence from a single-copy Pint-egfp; PinR-eCherryfusion inP. knackmussiistrain
B13 and derivatives.
Time (h)1 A) B13-2581 (Wild-type) B) B13-2673 (rpoS)
C) B13-2993 (rpoS,
mini-Tn5[PrpoS-rpoS]) D) B13-3091 (rpoS,inrR2/2)
eGFP2 %3 signif4 eGFP % signif eGFP % signif eGFP % eCherry % signif
24 8968 0.760.2 AD 2160.8 1.060.5 47624 0.860.4 ,10 ,0.1
48 13563 3.060.7 AB, AD 86640 0.960.4 BC 121611 3.260.4 CD ,10 0.1760.08 39±7 0.22±0.2 P = 0.365
72 15066 2.860.1 AB, AD 65610 0.860.2 BC 133610 3.861.2 CD 19632 0.2360.40 57±24 0.2±0.04 P = 0.44
96 116613 1.960.2 AD 95612 1.660.4 BC,BD 108612 3.260.6 CD 42636 0.2560.21 70±18 0.6±0.02 P = 0.04
1)Time after culture inoculation. Time 24 h is onset of stationary phase.
2)Average eGFP or eCherry (in bold) fluorescence (relative units) within the subpopulation of cells across biological triplicates (see Figure S7 for explanation). 3)Average subpopulation of cells (percent of total) expressing
egfpfrom Pint(oreCherryfrom PinR, in bold) determined from cumulative distribution curves among
biological triplicates.
4)Significance of difference (P
,0.05) in a Tukey’s post-hoc test on sample variances of subpopulation sizes per time group across all strains (one-way ANOVA).
5)
Calculated P-values in pair-wise homoscedastic T-test between proportions of eGFP and eCherry expressing cells. doi:10.1371/journal.pgen.1002818.t002
Table 3.Comparison ofrpoSwith doubleinrRdeletion on eGFP expression from a single copy Pint-egfpfusion.
Time (h)1 A)P. knackmussiiB13-1346 (wild-type) B) B13-2976 (rpoS) C) B13-2979 (inrR2/2)
eGFP2 %3 signif4 eGFP % signif eGFP %
24 6867 1.160.1 AB, AC ,10 ,0.1 ,10 ,0.1
48 9661.4 2.260.1 AB, AC 4763 0.460.1 BC ,10 ,0.1
72 13166 3.060.2 AB, AC 110613 1.660.5 BC 9467 0.461.2
96 14366 3.460.1 AB, AC 140616 2.160.4 6367 1.260.8
1)Time after culture inoculation. Time 24 h is onset of stationary phase.
2)Average eGFP fluorescence (relative units) within the subpopulation of ICEclcactive cells across biologically independent triplicates (for explanation, see Figure S7). 3)Average subpopulation of cells (percent of total) expressingegfpfrom P
intdetermined from cumulative distribution curves among biologically independent triplicates. 4)Significance of difference (P
subpopulation (Table S3). This indicates that the relative contribution of the extrinsic noise on Pint expression becomes
more dominant, as would be expected from the increase in a global transcription factor (since RpoS is also directly acting on Pint). Also adding an additional copy ofinrRresulted in a lowering
of the total noise, although the proportion of cells expressing eGFP and eCherry in the inrR+strain was not increased compared to
wild-type (Figure 6, Table 4).
Discussion
One of the mysteries in ICE gene transfer among bacteria is the mechanism that controls the (typically low) frequency by which they become excised in clonally identical populations of donor cells. ICE conjugation must start with its excision and therefore the cellular decision that determines conjugation is binary: ICE excision or not. Low transfer frequencies (e.g., below 1% per donor cell in a population) suggest that the binary ‘ON’-decision is only made in a very small proportion of donor cells. Indeed, our previous results on ICEclc in P. knackmussii B13 using stable fluorescent reporter gene fusions at single-cell level had indi-cated that 3% of cells in stationary phase after growth on 3-chlorobenzoate (3CBA) as sole carbon and energy source measurably express PinR and Pint [8,33]. Moreover, single cell
activation frequencies are in the same order as measured ICEclc
excision and transfer at population level [33]. Our results presented here show for the first time how the expression level of the global transcription factor RpoS in individual cells across a population can modulate the frequency of cells activating excision of the ICEclcelement.
By gene interruption and complementation we first establish that RpoS in P. knackmussii is a stationary phase sigma factor controlling transcription of the PinR- and Pint-promoters and thus,
indirectly, transfer of ICEclc to P. putida. Addition of an extra
rpoSB13 gene copy led to an increased proportion of stationary
phase cells in which the PinR- and Pint-promoters are activated,
which suggested that the expression level of RpoS is important for controlling the bistable switch leading to ICEclcactivation. Indeed, by expressing an RpoS-mCherry fusion instead of RpoS wild-type protein in strain B13 we showed that PinR- or Pint-egfpexpression in
stationary phase preferably occurred in individual cells with the highest levels of RpoS-mCherry fluorescence (Figure 4C). More-over, strains with two rpoS-mCherry gene copies produced on average twofold higher RpoS-mCherry protein fluorescence levels
Figure 4. Correlation between rpoS and either Pint or PinR
expression inP. knackmussiiB13.(A) Scatter plots of scaled single cell mCherry fluorescence expressed from PrpoSand eGFP from Pint(left
panel) or PinR (right panel) in cultures on 3CBA in exponential phase
(grey circles) or after 24 h in stationary phase (red-brown circles). (B) As A but showing single cell fluorescence of an RpoS-mCherry fusion protein (under transcriptional control from PrpoS) versus eGFP
fluores-cence from Pint(left panel) or PinR(right panel). Note that in strain
B13-3564 and B13-3555 the nativerpoSgene is replaced byrpoS-mcherry. Every circle represents measurements on a single cell. The total number of measured cells is displayed in every diagram. (C) Proportion of cells expressing eGFP above threshold (dotted lines in panel B) from Pint(left
panel) or PinR(right panel) in data sets of panel B per quadrant (Q) of
normal distributed RpoS-mCherry intensity.Q1st, from minimum to Q1
(mean21SD);Q2nd, from Q1to Q2(mean);Q3d, from Q2to Q3(mean+1
SD);Q4th, from Q3to maximum. Letters above bar diagrams indicate
significance of difference (P,0.05) in a Tukey’s post-hoc test on sample variances (one-way ANOVA).
doi:10.1371/journal.pgen.1002818.g004
in cells, leading to an increase of up to 20% of cells expressing eGFP from PinR or Pint. This showed that an incidentally high
RpoS level in an individual cell is a prerequisite for leading to PinR
-or Pint-expression. On the contrary, having a high RpoS-level is
not sufficient and an as yet unknown other ICEclc-encoded factor(s) must be responsible for the activation or derepression of PinR(Figure 7). We conclude that RpoS levels are a precondition
for a cell or, in other words, a threshold, to activate the ICEclc
bistable promoters during the first 2 days of stationary phase. This conclusion is further supported by noise measurements on the PinRor Pint-promoters (Figure 6). Intrinsic noise is dominant on
the Pintpromoter in wild-type B13, which would be in agreement
with the major role played by (a low abundant) InrR and the relatively minor role of (a widely abundant) RpoS directly on Pint
-expression. This effect may actually have been overestimated by a bias introduced by the measurement technique (i.e., adding two extra Pint-copies withegfpormcherryto two Pint from both ICEclc
copies in the B13 chromosome, in the presence of twoinrRcopies). In contrast, and in the same ‘biased’ setting (two extra PinR-copies
on a total of four), the total noise is significantly lower on the PinR
-promoter and the relative contribution of the extrinsic noise is higher (Table 4), which is indicative for the more important contribution of RpoS on this promoter. Doubling therpoS copy number resulted in a significant decrease of the total noise on Pint
Figure 5. Effect of an additional copy ofrpoS orinrR on the proportion ofP. knackmussii B13 cells expressing Pintand PinRin
stationary phase.(A) Relevant construction details of the mini-transposon constructs used to deliver single copyrpoS,inrRor reporter genes. (B) Phase-contrast and corresponding epifluorescence micrographs (artificially colored green for eGFP and red for eCherry) of stationary phase cells grown on 3CBA at 10006magnification. (C) Scatter plots showing correlation between normalized eGFP (from Pint) and eCherry fluorescence (from
PinR) in thousands of cells in B13-2581 (wild-type), B13-3260 (extra copy of rpoS) or B13-3257 (extra copy inrR). Correlation coefficients plus
corresponding calculated standard deviations across biological triplicates are indicated. (D) Cumulative distributions of normalized eGFP fluorescence in strains of (C) and indication of the subpopulations of cells actively expressing Pint(average from triplicates6SD). (E) as (D), but for eCherry from
PinR. (F) Effect of an extra copy ofrpoS-mcherryon the scaled RpoS-mCherry fluorescence levels in stationary phase cells. Shown are distributions of
mCherry fluorescence in cultures of B13-3564 (rpoS-mcherryreplacedrpoS, blue bars) and B13-3712 (rpoS-mcherryreplacedrpoS, extra copy rpoS-mcherryon mini-Tn insertion, red bars). Median values plus corresponding calculated standard deviations across biological triplicates are indicated in parentheses.
and a more important relative contribution of extrinsic noise (RpoS). This would make sense since individual cells would overall contain higher levels of RpoS permitting more direct interaction with Pint. Adding a third copy of inrR also reduced the level of
intrinsic noise on Pint, but in this case because such cells would
produce more InrR, diminishing the noise effect by ‘small numbers’ of regulatory factors (i.e., InrR). Noise in individual cell RpoS levels is thus not propagated to noise in expression of downstream regulons, as was shown recently for global transcrip-tion factors in yeast [40], but rather is ‘captured’ in those cells having high RpoS levels and transduced by ICEclcfactors to a precise activation cascade leading to ICEclcexcision and transfer. Intriguingly, doublingrpoScopy number strongly increased the proportion of cells in the population expressing Pintand PinRfrom
3% to almost 20%, although the transfer frequency of ICEclconly doubled (Table S2). In contrast, adding a third copy ofinrRto B13 did not statistically significantly increase the proportion of cells expressing Pintand PinR. To explain this, we propose the following
model for ICEclc bistability generation (Figure 7). In this model cells that by chance have the highest RpoS levels are precondi-tioned to activate ICEclc, although another factor is needed for the actual activation mechanism. Available data suggest that activa-tion starts at PinR, leading to synthesis of InrR, which, by an as yet
unknown mechanism precisely relays activation (i.e., within the same individual cell) to Pint and other ICEclc core genes.
Microarray analysis confirmed the important role of InrR for the overall activation of ICEclc core functions, and indicated a possible feedback loop on its own expression (Figure S6).
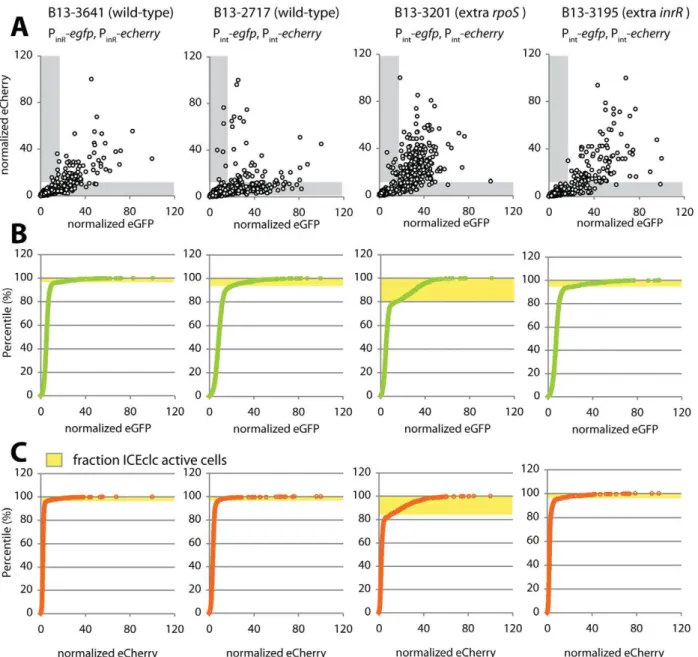
Figure 6. Noise in reporter gene expression from two separately placed single-copy identical promoters (Pint or PinR) in P.
knackmussiiwild-type (strains 2717 and 3641) or with extra copies ofrpoS(B13-3201) orinrR(B13-3195).(A) Scatter plots showing correlation between single cell scaled and normalized eCherry versus eGFP fluorescence values (circles) in stationary phase 3CBA-grown cultures. Grey zones indicate cells which express only one of both markers above threshold (for explanation, see Figure S8). (B) Cumulative distribution of single cell eGFP fluorescence values in the culture sample, used to define the subpopulation size of cells expressing eGFP from the Pintor PinR
Importantly, RpoS but not InrR levels determine the proportion of cells that may become ICEclcactivated. The feedback loop of InrR on PinRexpression may be necessary to obtain sufficiently
high InrR levels to act as co-regulator for the different ICEclccore gene operons [36]. IncreasinginrR copy number, therefore, can decrease the noise in the expression of the ICEclc genes downstream of PinR, but does not influence the proportion of cells
in culture activating ICEclc. The fact that a doublerpoSgene copy increases the number of cells expressing Pintand PinRto 20% but
only doubles transfer frequency suggests that there may be another component that is not under RpoS or InrR control that further limits conjugation rates. How may RpoS be accomplishing such a ‘thresholding’ control? One hypothesis is that RpoS has a relatively poor affinity for the PinR-promoter and that, therefore,
on average only cells with by chance high RpoS levels can activate PinR. TheinrRpromoter bears a potential RpoS-motif in the210
box (TGTCGATCCT), although it is not highly conserved [41]. As far as we are aware, this is the first time that RpoS has been implicated in controlling horizontal gene transfer of a conjugative element. RpoS homologs are part of a large protein cluster called the s70 family, which is widely distributed among prokaryotes, although RpoS regulons can be quite different in individual species [42]. The only other report detailing a role for RpoS dealt with stationary phase regulation of Tn4652activity in P. putida [43]. Interestingly, in that case RpoS downregulatestnpAtransposition
frequency since Tn4652becomes at least 10 times more activated in an rpoS-defective strain [43]. Study on effects of stochastic fluctuations in sigma factors at the single cell level are extremely limited. Perez-Osorio documented highly heterogeneous rpoS
mRNA levels inP. aeruginosabiofilms, but this occurred rather as a consequence of physico-chemical gradients within the biofilm [44]. Stochastic stress-induced fluctuations control the rbsV-rbsW-sigB operon for the stress response sigma factor SigB in Bacillus
subtilis. Interestingly, sigBp expression proceeds in a ‘burst-like’
fashion with a higher pulse frequency under stress than under normal growth condition [45]. Bursts are initiated by stress-dependent fluctuations in phosphatase levels, then first amplified and subsequently terminated bysigBoperon feedback on itself and on its anti- and anti-anti-sigma factors RbsW and RbsV, respectively.
Gene expression noise is ubiquitous and plays an essential role in a variety of biological processes, triggering stochastic differen-tiation in clonal populations of cells [46]. Noise can provide a selective advantage by increasing phenotypic heterogeneity and increasing the chance of individuals to survive [46]. Evidence exists that more noisy systems can become selected under specific conditions [47]. In that sense, our data implicate that specific evolutionary elements such as ICEclcare wired within noise in a global transcription factor but can transduce this noise to a precise activation cascade, and thus may have been selected for their capacity to successfully exploit the noise.
Materials and Methods
Bacterial strains and plasmids
Escherichia coli DH5a (Gibco Life Technologies, Gaithersburg,
Md.) was routinely used for plasmid propagation and cloning experiments.E. coliHB101 (pRK2013) was used as helper strain for conjugative delivery of mini-transposon constructs [48]. P.
knackmussiistrain B13 [49] is the original host of theclc element
(ICEclc), of which it carries two copies [50]. All further B13 derivatives are listed in Table 1.
Media and growth conditions
Luria-Bertani (LB) medium [51] was used for cultivation ofE. coli, whereas LB and type 21C mineral medium (MM) [52] were used for cultivation of P. knackmussii. 3-Chlorobenzoate (3CBA) was added to MM to a final concentration of 5 or 10 mM. When necessary, the following antibiotics were used at the indicated concentrations (mg per ml): ampicillin, 500 (forP. knackmussii) or 100 (for E. coli); kanamycin, 50 and tetracycline, 100 (for P.
knackmussiistrain B13 derivatives) or 12.5 (forE. coli).P. knackmussii
strain B13 was grown at 30uC;E. coliwas grown at 37uC.
Table 4.Subpopulation proportions and noise in expression of eGFP and eCherry from dual Pintor PinRfusions in cultures ofP. knackmussiistrain B13 or derivatives.
Strain Marker
% fluorescent
cells, eGFP1 % fluorescentcells, eCherry Intrinsic noise Extrinsic noise Total noise
B13-2717 Pint-egfp, Pint-echerry 6.2460.87 (A)2 4.2461.81 (A) 1.16560.128 (A) 0.30460.263 1.21760.174 (A)
B13-3641 PinR-egfp, PinR-echerry 4.0161.63 (A) 3.3060.71 (A) 0.54760.071 (B) 0.55360.091 0.77960.110 (B)
B13-3201 (extrarpoS) Pint-egfp, Pint-echerry 19.8563.06 (B) 13.5865.86 (B) 0.57260.099 (B) 0.46760.029 0.73960.089 (B)
B13- 3195 (extrainrR) Pint-egfp, Pint-echerry 6.6260.4 (A) 5.5360.32 (A) 0.55660.034 (B) 0.48860.037 0.74060.050 (B)
1)
Averages from three clones with different marker insertion positions6calculated average deviation.
2)Significantly different (P
,0.05) in a post-hoc Tukey’s test calculated on sample variations in one-way ANOVA (per marker column across all strains). doi:10.1371/journal.pgen.1002818.t004
Figure 7. Stochastic fluctuations of RpoS control permissive-ness for bistable ICEclcactivation and transfer.Stationary phase cells grown on 3CBA with the highest cellular RpoS levels and in the presence of the regulator(s) factor X can activate PinR. InrR positively
controls the expression of Pint and other ICEclc core genes, finally
leading to ICEclctransfer. A positive feedback loop by InrR may lead to higher InrR expression, but only in ICEclcactive cells. RpoS is also a direct sigma factor for Pint-expression. Cells with lower RpoS levels do
not express PinRand ICEclcremains non-active.
ICEclcself-transfer
Self-transfer was tested by mixing 500ml suspension of around 109donor cells (P. knackmussii B13 or one of its derivatives) and 500ml suspension of around 109recipient cells (P. putidaUWC1) on membrane filters for 24, 48, 72 or 96 h, as described earlier [53]. Transconjugants (P. putidaUWC1 with ICEclc) were selected on MM plates with 5 mM 3CBA as sole carbon and energy source (to select for ICEclc) and 50mg per ml rifampicin (resistance marker of the recipient). Transfer frequencies were expressed as number of transconjugant colony forming units (CFU) per number of donor CFU.
DNA and RNA techniques
Polymerase chain reaction (PCR), reverse transcription RT-PCR, plasmid and chromosomal DNA isolations, RNA isolation, DNA fragment recovery, DNA ligations, transformations intoE. coli and restriction enzyme digestions were all carried out according to standard procedures [51] or to specific recommen-dations by the suppliers of the molecular biology reagents (Qiagen GmbH; Promega; Stratagene). Sanger-type DNA sequencing was performed on an automated DNA sequencer using a 3.1 Big-Dye kit (Applied Biosystems, ABI PRISM, 3100 DNA sequencer). Sequences were aligned and verified with the help of the Lasergene software package (Version 7, DNASTAR Inc., Madison, Wisc.). Sequence databases were interrogated by using the BLAST program [54].
Cloning of rpoSfromP. knackmussiiB13
Primers were designed for conserved regions obtained in a nucleotide sequence alignment amongrpoSgenes ofP. aeruginosa,P.
putidaandP. fluorescens(Table S4, Figure S1). A single 1-kb PCR
product was obtained using these primers and B13 genomic DNA as template. This fragment was cloned and sequenced on both strands by primer walking. Surrounding regions of therpoSgene of
P. knackmussii were retrieved from draft genome sequence of P.
knackmussii B13 (R. Miyazaki and J. R. van der Meer,
unpublished). The B13 rpoS gene region was submitted to GenBank under accession number AB696604.
RpoSdisruption
An internal fragment of therpoSB13gene was amplified with a
forward primer (080304) carrying a BamHI, and reverse primer (080303) carrying an EcoRI restriction site (Table S4). The amplified fragment was digested and cloned into the suicide plasmid vector pME3087, which carries a tetracycline resistance [55]. The plasmid was then mobilized from E. coli into P.
knackmussii strain B13 via conjugation. Potential B13
transconju-gants with a single recombination intorpoSwere selected on MM with 5 mM 3CBA as carbon source plus 100mg per ml tetracycline, further purified by replating and verified by PCR for accuracy of homologous recombination. In this manner a mutant of strain B13 was obtained in whichrpoSwas replaced by two incomplete and separated rpoS fragments (Figure S3). This mutant was named B13rpoS(strain 2671). Separate experiments to deleterpoSby using recombination with a DNA fragment in which
rpoSwas fully deleted were not successful either (not shown). The same strategy was then used to produce a single recombinant disruption ofrpoSinP. knackmussiistrain B13 that lacked bothinrR
copies [33]. Reversion of therpoS-pME3087allele to wild-typerpoS
in stationary phase cultures was tested by specific PCR (Table S4, Figure S4B).
rpoScomplementation
A 2.2-kbp fragment containing therpoSgene and its presumed promoter (PrpoS) was amplified from strain B13 purified genomic
DNA using primers 091206 and 090902 (Table S4). The amplified material was first cloned into the vector pGEM-T-Easy (Promega). From here, the PrpoS-rpoSfragment was recovered byNotI digestion
and inserted into the mini-Tn5 delivery plasmid pCK218, which was used to place the construction in single copy on the chromosome of strain B13-2673 (rpoS, mini-Tn[PinR-echerry-cat,
Pint-egfp, Km], see below). As this strain carried a mini-Tn5
insertion already it was necessary to remove the Km gene cassette associated with it. Hereto the strain was transformed with plasmid pTS-parA [56], a temperature-sensitive replicon transiently expressing the ParA resolvase. B13 transformants were selected on LB plus ampicillin and subsequentially grown in the absence of kanamycin for twelve generations. Clones that had lost the Km cassette were screened by replica plating and the absence of the gene was verified by PCR. Finally, the temperature sensitive replicon was cured by growing the strain in LB at 37uC for 16 h and ensuring ampicillin sensitivity. The resulting strain was then used to introduce the mini-Tn5 containing the PrpoS-rpoSfragment,
which was designated B13-2993 (rpoS, mini-Tn[PrpoS-rpoS, Km],
mini-Tn[PinR-echerry-cat, Pint-egfp]). Three independent clones with
possible different mini-transposon insertion sites were examined for ICEclctransfer and reporter gene expression.
Extra-copy ofinrRandrpoS
A 1700-bp fragment containing orf95213 and inrR genes plus PinRwas amplified by PCR using primers (060605+080502, Table
S4) carryingEcoRI andSpeI restriction sites, respectively. The PinR
-orf95213-inrR fragment was digested with EcoRI and SpeI and
cloned into the mini-Tn5 delivery plasmid pBAM1 [57]. In the same way, a 2.2-kb fragment containing PrpoS-rpoSwas amplified
with primers (091206+090902) and cloned in pBAM1 usingSphI and EcoRI. The resultant suicide plasmids were introduced into B13 or its derivatives by electroporation, from where the transposition was selected by plating on MM plus 3CBA and kanamycin. Bona fide single copy transposition was verified by PCR. At least three independent clones with possibly different insertion positions were used for further experiments.
Promoter–reporter gene fusions
Transcriptional fusions between the Pint promoter in front of
intB13and theegfp gene, or Pintand a promoterless echerrygene
have been described previously [33,58]. Transcriptional fusion between the promoter of theorf95213,inrR,ssbgene cluster (PinR)
and either egfpor echerry have been detailed elsewhere [33]. To examine expression of both PinRand Pintpromoters simultaneously,
we used a previous construct with PinR-echerryin one and Pint-egfpin
the opposite direction [33]. Fusions were inserted in single copy into the chromosome of strain B13 or its mutant derivatives via mini-Tn5 delivery using pCK218 [59]. To measure activity of the
rpoS promoter (PrpoS), a 1200-bp fragment upstream of rpoS
including thenlpDgene was amplified from strain B13 by PCR (Figure 1). This fragment was purified and digested withNotI and
Translational fusions of RpoS with mCherry
To produce a C-terminal fusion of RpoS to mCherry, a ,750 bp fragment containing themcherryopen reading frame was amplified using pMQ64-mcherry (kindly obtained from Dianne Newman, CalTech) as a template and primers (101003 and 101004), in which the start codon of mcherry was replaced by a short nucleotide sequence encoding 15 amino acids (KLPENSNVTRHRSAT) as a linker peptide. The fragment was then cloned in HindIII and SpeI sites on the mini-Tn5delivery plasmid pBAM1, resulting in pBAM-link-mCherry. A 2.1 kb region containing PrpoS and rpoS lacking its stop codon was
amplified using B13 genomic DNA and primers 101001 plus 010102. This fragment was digested wtihEcoRI andHindIII, and cloned into the same sites on pBAM-link-mCherry (designated pBAM-rpoS-mcherry), After transformation inE. coli and purifi-cation, this plasmid was introduced into strain B13 or its derivatives by electroporation. Single copy transposon insertions of therpoS-mcherryfusion construct were selected by plating cells on MM plus 3CBA and kanamycin. If required for introduction of subsequent mini-transpositions the kanamycin gene cassette was removed by ParA resolvase action (see above). At least three independent clones with possibly different insertion positions were used for further experiments.
To replace rpoS of B13 by the gene for the RpoS-mCherry fusion protein we used double recombination by crossing-over. Hereto, a ,1 kb downstream region of rpoSwas first amplified using B13 genomic DNA and primers 110524 plus 110525, which was digested usingXbaI andSalI and ligated wtih pJP5603-ISceIv2 [60]. Next, the gene for the RpoS-mCherry translational fusion protein on pBAM-rpoS-mcherry was recovered by digestion with
EcoRI andSpeI, an inserted upstream of the amplified fragment in pJP5603-ISceIv2 which was hereto digested withEcoRI andXbaI. After transformation in E. coli and purification, the resulting plasmid was electroporated into strain B13-78 (Table 1). Single and double recombinants were selected according to a previously described strategy [9], obtaining an allelic exchange mutant that has the gene for RpoS-mCherry instead of the originalrpoS.
Fluorimeter measurements
P. knackmussiistrain B13 or B13rpoScarrying the PrpoS-mcherry
fusion were grown in 96-well black microtiter plates (Greiner Bio-one) with a flat transparent bottom. Each well contained 200ml of
MM medium with 5 mM 3CBA and was inoculated with 2ml of a
bacterial preculture grown overnight in LB medium. Microtiter plates were incubated at 30uC with orbital shaking at 500 rpm. At each given time point both culture turbidity (A600) and
fluores-cence emission (excitation at 590 nm and emission at 620 nm) were measured from triplicate cultures using a Fluostar fluores-cence microplate reader (BMG Lab Technologies). Cultures ofP.
knackmussiistrain B13-78 wild-type served for background
fluores-cence correction.
Epifluorescence microscopy
To image eGFP, eCherry or mCherry expression in single cells, culture samples of 4ml were placed on regular microscope slides, closed with a 50 mm long and 0.15 mm thick cover slip, and imaged within 1–2 minutes. Fluorescence intensities of individual cells were recorded on image fields not previously exposed to UV-light to avoid bleaching. For most imaging series, except data shown in Figure 2, a Zeiss Axioskop2 upright epifluorescence microscope was used, equipped with Spot Xplorer 1.4MPixel cooled CCD camera (Visitron Systems GmbH, Puchheim,
Germany), and 1006/1.30 oil immersion Plan-Neofluar lens at
an exposure time of 500 ms. Filters used for eGFP and for eCherry/mCherry were eGFP HQ470/40 and Cy3 HQ545/30, respectively (Chroma Technology Corp, VT, USA). Images were digitally recorded using VisiView software (version 2.0.4, Visitron Systems GmbH). For data shown in Figure 2 and Figure S3 a Leica DMI6000B inverted epifluorescence microscope was used, equipped with a cooled black-and-white charge-coupled device camera (DFC320, Leica Microsystems CMS GmbH, Wetzlar, Germany), a 100/1.30 oil immersion lens (HCX PL FLUOTAR; Leica), at an exposure time of 800 ms. Filters used for eGFP, and for eCherry or mCherry were GFP BP470/40 and Y3 BP535/50, respectively (Leica). Images were digitally recorded as 8-bit TIFF-files using the Leica AF6000 software. The mean pixel intensity for every individual object in an image was quantified by an automatic subroutine in the program MetaMorph (version 7.7.5; Visitron Systems GmbH) as described previously [33]. Fluores-cence intensities per cell were expressed as cellular average gray values (AGVs) in which background intensities of each image were subtracted.
Subpopulation expression was determined from cumulative ranking of all objects according to their AGV. The ‘breakpoint’ between subpopulations on cumulative distribution curves (Figure S8) was determined by manually placing slope lines to the linear parts of the curve. The point where both slope lines crossed was used to determine the corresponding percentile for the largest subpopulation with lowest AGVs. The relative size of the subpopulaton with highest AGVs (indicative for bistable promoter expression of Pint and PinR) was then calculated as 100% - the
percentile of the breakpoint. The average expression intensity over the highest expressing subpopulation was calculated as the mean AGV over the percentile range between that of the breakpoint and 100%. Fluorescence images for display were adjusted for brightness to a level+143, cropped to their final size and saved at 300 dpi with Adobe Photoshop (Version CS4). Corresponding phase-contrast images were ‘auto contrasted’ using Photoshop.
Noise calculation
To identify and quantify noise in expression of the Pintand PinR
promoters, two identical copies were fused to distinguishable reporter genes (i.e.egfp and echerry) and integrated into separate locations on the chromosome of B13 or its derivatives using mini-Tn5delivery. Three independent clones with different insertional positions were maintained. Stationary phase cells of such double-reporter strains grown in MM with 3CBA were examined in epifluorescence microscopy, and their eGFP and eCherry fluores-cence intensities were measured as outlined above (AGVs). AGVs of both markers in each cell were scaled to subtract background AGV of digital EFM images and normalized to the highest AGV in a population (100%). Only cells belonging to the subpopulations of having higher eGFP or eCherry fluorescence than the breakpoint in the respective cumulative curves (e.g., Figure 6) were used for noise calculation. Intrinsic noise (gint), extrinsic noise
(gext), and total noise (gtot) were then calculated according to
previous definitions given in Elowitzet al.[40] as follows:
g2int:Sg
{c
ð Þ2T
2SgTScT; g 2 ext:
SgcT{SgTScT SgTScT ; g
2 tot:
Sg2zc2T{2SgTScT 2SgTScT
Statistics
Significance of different treatments was examined by pair-wise t-test or ANOVA followed by a Tukey post hoc test. To test the effect of subpopulation size on noise calculations, data sets were randomly resampled using bootstrap procedures (1000 times), upon which the intrinsic, extrinsic and total noise were calculated and finally, averaged over all resampled populations of the same data set.
Microarray analysis
Total RNA was isolated fromP. knackmussiiB13-78 (wild type), B13-2671 (rpoS) and B13-2201 (inrR2/2) cultures after 48 h in stationary phase after growth on 3CBA as sole carbon and energy source, by using the procedure described previously [37]. Briefly, cDNA was synthesized from total RNA, labeled with cyanine-3, purified and hybridized to a 8615K custom-made Agilent
microarray chip (Agilent Technologies, Santa Clara, CA). Data analysis was performed as described previously [37]. Micro-array data and design have been deposited in the NCBI Gene Expression Omnibus (GEO) under accession number GPL10091.
Supporting Information
Figure S1 Alignment ofrpoSgenes fromPseudomonas putida(P. p.),
P. fluorescens (P. f.) and P. aeruginosa (P. a.). Rectangular boxes
represent the region chosen to design primers for the amplification ofrpoSfrom strain B13. Inosine was used in the oligonucleotides at non-conserved positions. Genbank numbers: P. putida KT2440, NC_002947.3; P. fluorescens Pf-5, NC_004129.6; P.aeruginosa
PAO1, NC_002516.2. (TIF)
Figure S2 Comparison of the predicted RpoS amino acid sequence from strain B13 and orthologues from four other
Pseudomonasstrains. (A) MegAlign alignment (DNAStar Lasergene
package v.8) and indication of consensus per position. (B) Dendrogram (Clustal 2.0.12, http://www.ebi.ac.uk) showing the closest neighbourhood clustering of the strain B13rpoSgene. (TIF)
Figure S3 Strategy for inactivatingrpoSin strain B13 by a single recombination event. (A)rpoSgene region. (B) Amplification of a 600-bp internalrpoSB13fragment by PCR whilst creatingBamHI
andEcoRI restriction sites. Insertion of therpoSB13fragment into
the suicide vector pME3087. (C) Genetic structure produced by single homologous recombination and inactivation ofrpoSon the B13 chromosome.
(TIF)
Figure S4 Growth of P. knackmussii78 wild-type and B13-2671 (rpoS) in MM with 5 mM 3CBA. Data points are the average from three independent biological replicates 6 one calculated standard deviation. Maximal specific growth rates in exponential phase for B13-78 were 0.2260.01 versus 0.2660.01 h21
for B13-2671 (rpoS). Note that growth medium for B13-2671 included Tc to select for therpoS-pME3087allele. (B) Semi-quantification of the presence of rpoSrevertants in B13-2671 (rpoS) cultures by PCR. 25 ng of genomic DNAs isolated from B13-2671 culture with Tc at 24 h (lane 5), 48 h (lane 6), 72 h (lane 7), or 96 h (lane 8) were used as templates. A serially diluted B13-78 (wild-type) DNA was used as control: lane 1, 0.25 ng; lane 2, 0.5 ng; lane 3, 2.5 ng; lane 4, 25 ng. IntactrpoS (upper panel) andfdxA (lower panel, as an internal control) alleles were amplified using primer pairs 090206+090902 and 110524+110525, respectively. Lane M,
molecular mass marker (MassRuler DNA Ladder, Fermentas). The positions and sizes of the expected PCR fragments are indictaed. Note that some reversion ofrpoS-pME3087to wild-type
rpoSmust occur (lane 7–9) but at less than 1% in the population (lane 1).
(TIF)
Figure S5 Comparison of effects caused byrpoSor doubleinrR
disruption on expression of a Pint-egfpfusion inP. knackmussii. (A)
Relevant construction details of the mini-Tn construct delivering the single copy Pint-egfp fusion. (B) Micrographs showing the
subpopulation of cells expressing eGFP from Pintamidst a large
number of silent cells for B13-1346 (wild-type), B13-2976 (rpoS) or B13-2979 (inrR2/2) cultured on 3CBA after 24 h into stationary phase. (C) As B, but after 72 h in stationary phase. Shown are phase-contrast micrographs at 1,0006 magnification and corresponding epifluorescence images. For quantification, see Table 3.
(TIF)
Figure S6 ICEclc gene expression compared among P.
knack-mussiiB13-78 (wild-type), B13-2201 (inrR2/2) and B13-2671 (rpoS).
A) Log2fold-change in negative-strand probe signals on an ICEclc
micro-array. Inset shows detail around inrR-operon. B) Positive-strand probe signals. Open reading frames of ICEclcplotted along its length; white boxes: genes oriented on the positive strand, grey boxes: negative strand. Known ICEclcfunctional genes or regions indicated by name for reference.
(TIF)
Figure S7 Growth phase dependent expression from the rpoS
promoter inP. knackmussii. (A) Relevant construction details of the mini-Tn construct used to place a single copy PrpoS-mCherry
transcriptional fusion in the B13 genome. (B) Culture-density normalized mCherry fluorescence as a function of culture density (open circles) and incubation time in 3165 (wild-type) B13-3228 (rpoS), or B13-3654 (rpoS-mCherry). (C) Corresponding phase contrast (PhC) and epifluorescence micrographs of B13-3165 cells 24 h into stationary phase. Note how expression from PrpoS is
RpoS independent and how expression of RpoS-mCherry from PrpoS is detectable slightly later than that of mCherry alone,
suggesting post-transcriptional effects. (TIF)
Figure S8 Calculation of the subpopulation (size and mean reporter fluorescence expression) of B13-cells expressing Pint or
PinRabove threshold and representative for activating the ICEclc
element. (A) Finding the breakpoint between the larger non-active subpopulation of cells and the smaller ICEclc-active subpopulation of cells on a cumulative distribution curve of reporter fluore-scence values from Pint or PinR. (B) Scaling and normalizing of
eCherry and eGFP expression for noise calculations. Only cells falling in the grey zones (i.e., those with reporter expression values above the threshold defined in [A]) are considered for noise calculation.
(TIF)
Table S1 Transfer frequencies of ICEclc from P. knackmussii
strain B13, theinrR deletion and therpoSdeletion mutants toP.
putidaUWC1 as recipient.
(DOC)
Table S2 Transfer frequencies of ICEclc from P. knackmussii
strain B13 and therpoS+