Submitted 28 July 2015 Accepted 29 August 2015 Published17 September 2015 Corresponding author Yudong Zhang,
Academic editor Tifei Yuan
Additional Information and Declarations can be found on page 21
DOI10.7717/peerj.1251
Copyright 2015 Zhang and Wang
Distributed under
Creative Commons CC-BY 4.0 OPEN ACCESS
Detection of Alzheimer’s disease by
displacement field and machine learning
Yudong Zhang1,3and Shuihua Wang2,3
1School of Computer Science and Technology, Nanjing Normal University, Nanjing, Jiangsu, China 2School of Electronic Science and Engineering, Nanjing University, Nanjing, Jiangsu, China 3Jiangsu Key Laboratory of 3D Printing Equipment and Manufacturing, Nanjing, Jiangsu, China
ABSTRACT
Aim.Alzheimer’s disease (AD) is a chronic neurodegenerative disease. Recently, computer scientists have developed various methods for early detection based on computer vision and machine learning techniques.
Method.In this study, we proposed a novel AD detection method by displacement field (DF) estimation between a normal brain and an AD brain. The DF was treated as the AD-related features, reduced by principal component analysis (PCA), and finally fed into three classifiers: support vector machine (SVM), generalized eigenvalue proximal SVM (GEPSVM), and twin SVM (TSVM). The 10-fold cross validation repeated 50 times.
Results.The results showed the “DF+PCA+TSVM” achieved the accuracy of 92.75±1.77, sensitivity of 90.56±1.15, specificity of 93.37±2.05, and precision of 79.61±2.21. This result is better than or comparable with not only the other proposed two methods, but also ten state-of-the-art methods. Besides, our method discovers the AD is related to following brain regions disclosed in recent publications: Angular Gyrus, Anterior Cingulate, Cingulate Gyrus, Culmen, Cuneus, Fusiform Gyrus, Inferior Frontal Gyrus, Inferior Occipital Gyrus, Inferior Parietal Lobule, Inferior Semi-Lunar Lobule, Inferior Temporal Gyrus, Insula, Lateral Ventricle, Lingual Gyrus, Medial Frontal Gyrus, Middle Frontal Gyrus, Middle Occipital Gyrus, Middle Temporal Gyrus, Paracentral Lobule, Parahippocampal Gyrus, Postcentral Gyrus, Posterior Cingulate, Precentral Gyrus, Precuneus, Sub-Gyral, Superior Parietal Lobule, Superior Temporal Gyrus, Supramarginal Gyrus, and Uncus. Conclusion.The displacement filed is effective in detection of AD and related brain-regions.
Subjects Neuroscience, Psychiatry and Psychology, Radiology and Medical Imaging, Computational Science
Keywords Region detection, Machine vision, Generalized eigenvalue proximal SVM, Alzheimer’s disease, Whole brain analysis, Support vector machine (SVM), Machine learning, Twin SVM (TSVM)
INTRODUCTION
interfere with daily life, and to death (Goh et al., 2014;Hahn et al., 2013). There is neither cure nor treatment for AD. In 2006, more than twenty million people in the world suffered from this disease (Murphy et al., 2011). AD is predicted to influence 1 in every 85 people worldwide about thirty years later, and more than forty percent of prevalent cases need high level of care (Brookmeyer et al., 2007).
Now that the earth is growing into an aging society, AD has caused heavier burdens on families and society than before (Esposito et al., 2013;Kantanen et al., 2014). In China, AD accounts for more than half of SD, which extracts a total economic loss of more than eighty billion yuan every year, and is responsible for nearly sixty billion yuan in healthcare costs every year (Song & Wang, 2010). In United States, healthcare on people with Alzheimer’s disease currently costs roughly $100 billion per year and is predicted to cost $1 trillion per year by 2050 (Miller, Erlien & Piersol, 2012;Yuan, Machado & Arias-Carrion, 2014).
Nowadays, it is beneficial to develop early and accurate detection methods for AD, which is also necessary for the treatment and management for controlling the deterioration of AD (Zhang et al., 2015b). A 3D scan of the whole brain becomes acceptable and affordable with recent advances in neuroimaging technology (Zhang et al., 2015e;Zhang et al., 2014b), especially by the help of the most popular imaging technique: magnetic resonance imaging (MRI). With its high-resolution magnetic resonance (MR) images, the diagnostic accuracy of AD are greatly enhanced. MR images already play an essential role in detecting AD from normal elder controls (NC).
In this study, we proposed to employ displacement field (DF) to track the morphometry from normal brains to AD brains. The main advantage is that this method does not need to segment region-of-interest (ROI) beforehand, namely, it obtains the DF for the whole image. The classical level-set method was employed to estimate the DF.
This work is structured as follows: ‘State-of-the-Art’ provides the state-of-the-art. ‘Ma-terials and Methods’ presents the ma‘Ma-terials and methodology. ‘Experiments and Results’ gives the experimental results. ‘Discussion’ discusses the results and the proposed method. ‘Conclusions’ concludes this work. The nomenclature in this work is listed inTable 7.
STATE-OF-THE-ART
Recently, a new type of methods, the “whole-brain analysis”, gets popularity since it considers all voxels in the brain as a whole. It does not need to segment the brain beforehand, and it does not need any biomarker for classification task. The main disadvantage is the curse of dimensionality, which can be solved as the high-speed computers are very cheap nowadays (Alvarez et al., 2009´ ). The whole-brain analysis heavily relies on pure computation, and it can be accomplished by only computer scientists, after physicians help to label the data as either AD or healthy. Generally, the whole-brain analysis treats the whole brain as a ROI, and it consists of two stages: feature extraction and classification. We reviewed more than 10 literatures, and analyzed them in detail.
Scholars have presented various methods to extract efficient features for AD and other types of pathological brain detection.1In addition, various classification models and
1Some abbreviations are modified to avoid conflict within this paper.
methods exist, nevertheless, only a few of them are suitable for MR images.El-Dahshan, Hosny & Salem (2010)extracted the approximation and detail coefficients of 3-level discrete wavelet transform (DWT). They used artificial neural network (ANN) and K-nearest neighbors (KNN) classifiers.Plant et al. (2010)used brain region cluster (BRC). They suggested to use information gain (IG) to evaluate the interestingness of a voxel, and applied clustering algorithm to identify groups of adjacent voxels with a high discriminatory power. They used support vector machine, Bayes statistics, and voting feature intervals (VFI), with the aim of pattern classification.Park (2012)employed manifold learning for classification. Their use of the first and second distance measure resulted in an 18% and 46% error rate for classifying between patients with AD and normal patients, respectively.Chaves et al. (2012)utilized large margin-based methodology for AD detection in SPECT and PET images. Their system yielded accuracy, sensitivity and specificity values of 90.67%, 88% and 93.33% (for PET) and 92.78%, 91.07% and 95.12% (for SPECT), respectively.Saritha, Joseph & Mathew (2013)was the first to use wavelet-entropy in pathological brain detection. They employed spider-web plots to reduce the size of feature space. They also used the probabilistic NN (PNN) for classification.Zhang et al. (2015a)suggested that removing spider-web-plot yielded the same classification performance.Savio & Grana (2013)presented a novel method that employed deformation-based morphometry (DBM) method. They tested five features, and found three features performed excellent as trace of Jacobian matrix (TJM), modulated GM (MGM), and Geodesic Anisotropy (GEODAN). Furthermore, they utilized Pearson’s correlation (PEC), Welch’st-test (WTT), and Bhattacharyya distance (BD), to measure the significance of voxel site.Kalbkhani, Shayesteh & Zali-Vargahan (2013)modeled the detail coefficients of 2-level DWT by generalizing autoregressive conditional heteroscedasticity (GARCH) statistical model, and the parameters of GARCH model were considered as the primary feature vector. They tested the KNN and SVM models.Wang et al. (2014)
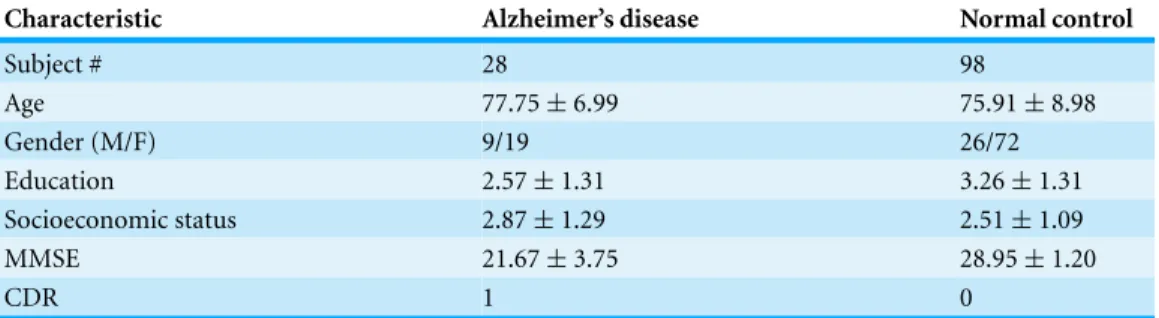
Table 1 Demographic status of subjects.MMSE denotes mini-mental state examination.
Characteristic Alzheimer’s disease Normal control
Subject # 28 98
Age 77.75±6.99 75.91±8.98
Gender (M/F) 9/19 26/72
Education 2.57±1.31 3.26±1.31
Socioeconomic status 2.87±1.29 2.51±1.09
MMSE 21.67±3.75 28.95±1.20
CDR 1 0
the performance of ANN, in terms of classification of medical images, using wavelets as feature extractor. Their classification accuracy achieved 96%.Zhang et al. (2015c)
employed discrete wavelet packet transform (DWPT). They utilized Tsallis entropy to get wavelet packet entropy features. They introduced a generalized eigenvalue proximal support vector machine (GEPSVM).Nazir, Wahid & Khan (2015)suggested to use filters for the removal of noises, and extracted color moments as mean features. Finally, they achieved an overall accuracy of 91.8%.Dong et al. (2015b)employed the eigen-brain (EB) to extract features, and then they employed Welch’s t-Test (WTT) for the aim of reducing features. They proposed to use SVM with radial basis function (RBF).Damodharan & Raghavan (2015)combined tissue segmentation and neural network for brain tumor detection.Zhang et al. (2015f)proposed a novel classification system that implemented 3D discrete wavelet transform (3D-DWT) to extract wavelet coefficients the volumetric image. After reviewing the latest literature, two findings can be obtained: (1) The DWT based features are efficient. However, we presented a novel feature of displacement field, which is the first to be used in MR images. (2) SVMs were commonly used, compared with conventional decision tree, artificial neural network (Wang et al., 2015a;Zhang et al., 2015d), and other classifiers (Collins & Pape, 2011). Hence, we continue to use SVM. Besides, two variants of SVM are introduced in this study: generalized eigenvalue proximal SVM (GEPSVM) and twin SVM (TSVM), with the aim of augmenting the classification performance further.
MATERIALS AND METHODS
Materials
The open dataset was downloaded from “Open Access Series of Imaging Studies (OASIS)” (Ardekani, Figarsky & Sidtis, 2013), which consists of 416 subjects aged from eighteen to ninety-six. All subjects are right-handed. Then, we merely selected 126 samples (28 ADs and 98 NCs) from the dataset. The demographic statuses are reported inTable 1. Following common convention, clinical dementia rating (CDR) was interpreted as the target (label). Note that subjects either with missing records or under sixty years old were removed.
Co-registration and brain-masking
increas-ing signal-to-noise ratio. Afterwards, those three-dimensional images were spatially co-registered to the Talairach space and then were brain-masked.
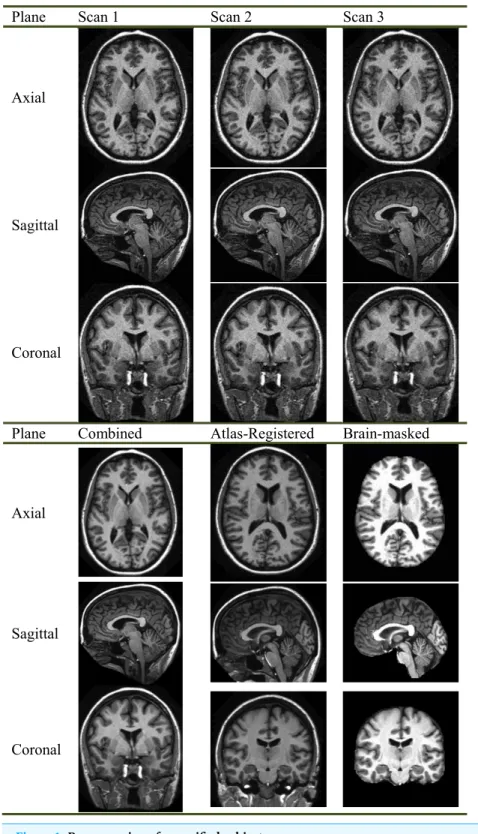
Figure 1offers an example of the preprocessing on 3D images with resolution of 1 mm×1 mm×1.25 mm. The motion-correction procedure registered the images of three scans, and then generated an image in the original acquisition space with resampling to 1 mm×1 mm×1 mm. Finally, the averaged image was normalized to the Talairach coordinate space, and brain-extracted (Fig. 1).
Key slice selection
Calculating the displacement field on the whole brain was time-consuming. Therefore, we introduced the “key-slice (KS) selection” method that picks up key slices containing structures indicative of AD from NC. The procedure was as follows: we established a criterion called “inter-class variance (ICV)”vas
v(k)= ∥µA(k)−µN(k)∥2 (1)
wherekis the index of key slice,∥ · ∥2represents thel2-norm,µAandµNrepresents the
mean of gray-level values of thekth slice of AD subjects and NC subjects, respectively, andv
denotes the ICV. We select the KSs whose ICVs are larger than half of maximum ICV, with 10×undersampling factor (i.e., every ten slices).
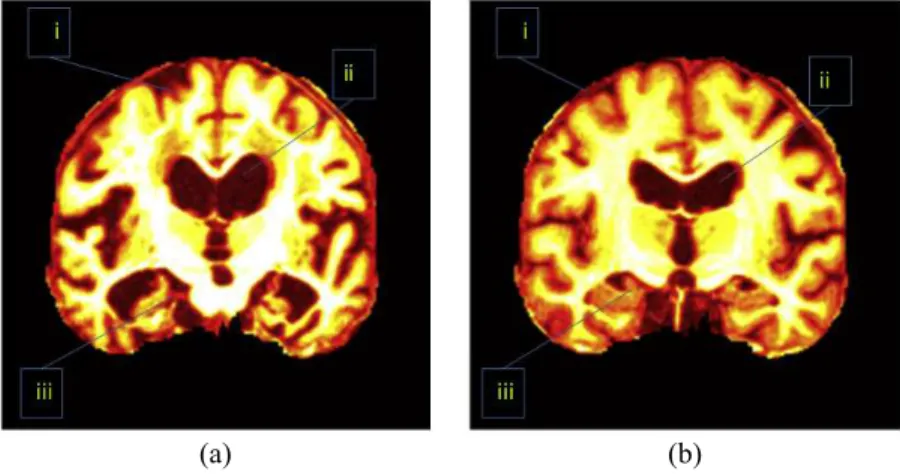
Besides, the direction of key slice can be either sagittal, or axial, or coronal. Scholars found images along coronal direction give a well-defined view compared to those along sagittal and axial directions.Figure 2shows an image along coronal direction has an advantage because it covers 3 most important AD-related regions, which are treated as indicative of AD. These AD-related regions consist of the cerebral cortex (CC), the HC, and the ventricle. When sagittal or axial directions are used, two or even more slices are needed to cover those tissues. Therefore, we chose the coronal direction for key slice selection, in order to use less slices.
Shape registration
The shape registration consists of both global and local registrations. The global registration estimates the rigid parameters, which was accomplished in ‘Co-registration and brain-masking’. Then, the local registration finds the “displacement field (DF)” between the moving and reference images (seeFig. 3).
The rigid registration is an essential preprocessing procedure before non-rigid registration. It can fix the deformation stemming from the position, move, and pose of patients. Then, the following non-rigid registration can reflect the shape deformation of diseases.
Figure 2 Important regions between (A) an AD brain and (B) a normal brain.i, CC; ii, ventricle; iii, HC. (Pseudocolor enhancement is performed for enlarging contrast.)
Figure 3 Flowchart of displacement field.
to solve optimal spline-based function parameters (Petibon et al., 2013). The second type needs a mass of computation resources; it is difficult to determine the local search range, and it is impossible to guarantee to find global optimal points (Lu, Yang & Zhang, 2014). The other three methods are non-parametric. They find the DF by solving directly a predefined physical model using partial differential equation (PDE) (Yang et al., 2007).
The level-set motion estimation method (Huang et al., 2014;Lee, Sandhu & Tannen-baum, 2013;Vandemeulebroucke et al., 2012) is a rather novel method, which is formed on the basis of the level set evolution theory. The moving imageI1morphs iteratively along its
gradient direction, till it deforms close to the given reference imageI2. The displacement
field is in the form of
dV
dt =(I2−I1(V))
∇I1(V) |∇I1(V)|
(2)
whereV represents the displacement field, andI1(V)the deformed image ofI1byV.
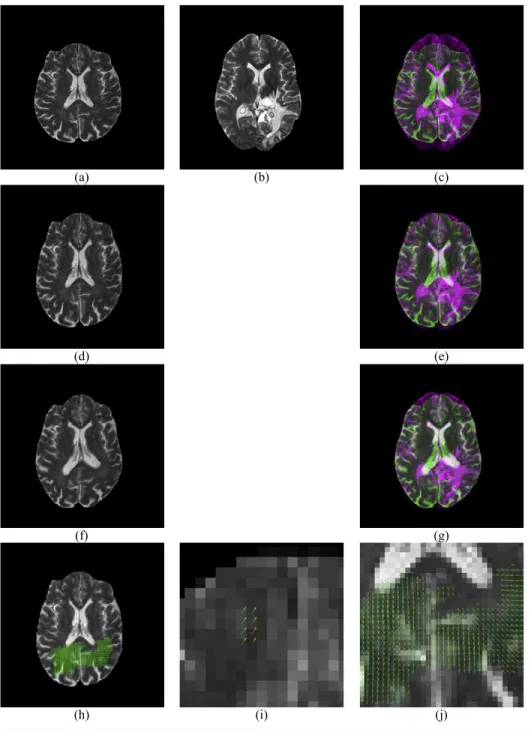
Figure 4 Illustration of displacement field between a Glioma brain and a normal one.(A) Moving ImageI1; (B) Reference ImageI2; (C) Overlap of (B) and (A); (D) Rigid Registration ofI1; (E) Overlap
of (B) and (D); (F) Non-rigid registration of (D); (G) Overlap of (B) and (F); (H) Displacement Field between (B) and (D); (I) Enlarged CC of (H); (J) Enlarged temporal and occipital lobe of (H).
Figure 4gives an example of the displacement field between a glioma brain and a normal one.Figure 4Apresents a moving image whileFig. 4Bis a reference image. Their overlap is shown inFig. 4C. Apparently, the reference image is larger than the moving image, and they are not quite a match.Figure 4Dshows the result of rigid-registration, andFig. 4E
Table 2 Pseudocode of the region detection method.
Region detection
Step 1 Select a normal brain(I1)and an AD brain(I2)from the dataset
Step 2 For each key slicek
Implement level-set displacement-field estimation betweenI1andI2, and obtain the
displacement fieldV.
Move the points(x,y), that satisfies|V(x,y)|>5, to the setR. End
Step 3 OutputR.
Figure 4Fshows the result of non-rigid registration. Compare toFig. 4B, they closely match each other, andFig. 4Galso suggests a nearly-perfect match. The displacement field is shown inFig. 4H, with two enlarged areas inFigs. 4Iand4J.
The values of displacement field are complex, i.e., the real part represents the displacement field along the horizontal direction, and the imaginary part along the vertical direction. Those values of Cartesian system are transformed into polar coordinate system, viz., the magnitude-direction spaces. Hence, the inputs to the classifiers are two fold in this study: (1) the directions of the displacement vector of the whole brain and (2) the magnitude of the displacement field of the whole brain. We did not use the sign of the displacement vector, which were commonly used in literature (Das Gupta & Tamadapu, 2013;Kodipaka et al., 2007). The reason is the direction field already contains the information of sign of the displacement.
Method of region detection
Here, we proposed a visual interpretation approach based on displacement field to detect regionsRthat can distinguish AD and NC.
R= {(x,y)|V(x,y)|>T}. (3)
Here| · |represents the magnitude,V(x,y)represents the displacement field at point of
(x,y),Tthe threshold. From another point of view,Eq. (3)means we preserve the points whose displacement magnitude is larger thanT. In this work,Tis assigned with a value of 5, which is defined empirically. A smaller thresholdTmay introduce more noises in the estimated displacement field; whereas, a larger thresholdTwill drop realistic deformation with short deformation magnitude. Hence, we believe the deformation with magnitude larger than 5 represents realistic deformation in the brain. In all, the visual interpretation is a three-step process (seeTable 2).
Non-parallel support vector machine
Generalized eigenvalue proximal SVM
Original SVM has a limitation that two hyperplanes should be parallel (Wang et al., 2014).
Mangasarian & Wild (2006)designed a generalized eigenvalue proximal SVM (GEPSVM). It drops the parallelism restrain on the two planes (remember the parallelism is necessary in original SVM), and requires each hyperplane should be as close as possible to one of the data sets and as far as possible from the other. The latest literature shows that GEPSVM yielded superior performance to canonical support vector machines in terms of sensitivity, specificity, precision, and accuracy (Khemchandani, Karpatne & Chandra, 2011;
Shao et al., 2013).
Suppose samples are from either class 1 (denote by symbolX1) or class 2 (denoted by
symbolX2), respectively. The GEPSVM finds the two optimal nonparallel planes with the
form of (wandbdenotes the weight and bias of the classifier, respectively)
wT1x−b1=0 and wT2x−b2=0. (4)
To obtain the first plane, we deduce fromEq. (4)and get the following solution
(w1,b1)=argmin (w,b)̸=0
∥wTX1−oTb∥2/∥z∥2 ∥wTX
2−oTb∥2/∥z∥2
(5) U← w b (6)
whereois a vector of ones with any possible dimension according to the context. Simplifying formula(5)gives
min
(w,b)̸=0
∥wTX1−oTb∥2 ∥wTX
2−oTb∥2
. (7)
We include the Tikhonov regularization term to decrease the norm of the variablesU that corresponds to the first hyperplane in(4).
min
(w,b)̸=0
∥wTX1−oTb∥2+t∥U∥2 ∥wTX
2−oTb∥2
(8)
wheretis a positive (or zero) Tikhonov factor. Formula(8)turns to the “Rayleigh Quotient (RQ)” in the following form of
U1=argmin
U̸=0
UTPU
UTQU (9)
wherePandQare symmetric matrices in size of(p+1)×(p+1)
Pdef=
X1 −o T
X1 −o
+tI (10)
Qdef=
X2 −o T
X2 −o
Considering the stationarity and boundedness characteristics of RQ, the answer of(9)is deduced by figuring out a generalized eigenvalue problem (GEP) as
PU=λQU, U̸=0 (12)
here the global optimal result of(9)can be obtained at an eigenvectorU1associated to
the smallest eigenvalueλminof formula(12). Therefore,w1andb1can be deduced from
formula(6), and utilized to from the plane as written in formula(4). Afterwards, a similar optimization problem is generated that is analogous to(7)by exchanging the symbols ofX1
andX2. The eigenvectorU2∗corresponding to the smallest eigenvalue of the 2nd GEP will
obtain the 2nd hyperplane approximate to samples of class 2.
Twin support vector machine
Jayadeva & Chandra (2007)provided a novel variant of standard SVM: the twin support vector machine (TSVM). The TSVM is similar to GEPSVM in the way that both obtain non-parallel hyperplanes. The difference lies in that GEPSVM and TSVM are formulated entirely differently. Each of the two quadratic programming (QP) problems in TSVM pair is formulated as a typical SVM. Reports have shown that TSVM is better than both SVM and GEPSVM (Nasiri, Charkari & Mozafari, 2014;Shao et al., 2014;Xu, Qi & Zhang, 2014). Mathematically, the TSVM is constructed by solving the two QP problems
min
w1,b1,q
1
2(X1w1+o1b1)
T(X
1w1+o1b1)+c1oT2q
s.t. −(X2w1+o2b1)+q>o2,q>0
(13)
min
w2,b2,q
1
2(X2w2+o2b2)
T(X
2w2+o2b2)+c2oT1q
s.t. −(X1w2+o1b2)+q>o1,q>0
(14)
hereci(i=1,2)are positive parameters, andoi(i=1,2)is the same as in formula(5).
By this means, the TSVM constructed two hyperplanes. The first term in equations of
(13)(14)is the sum of squared distances from the hyperplane to one class. The second
term is the sum of error variables. Therefore, minimizingEqs. (13)and(14)will force the hyperplanes approximate to data of each class, and minimize the misclassification rate. Finally, the constraint requires the plane to be at a distance of more than 1 from data in the other class. Another advantage of TSVM is that its convergence rate is four times faster than conventional SVM (Jayadeva & Chandra, 2007).
Statistical analysis
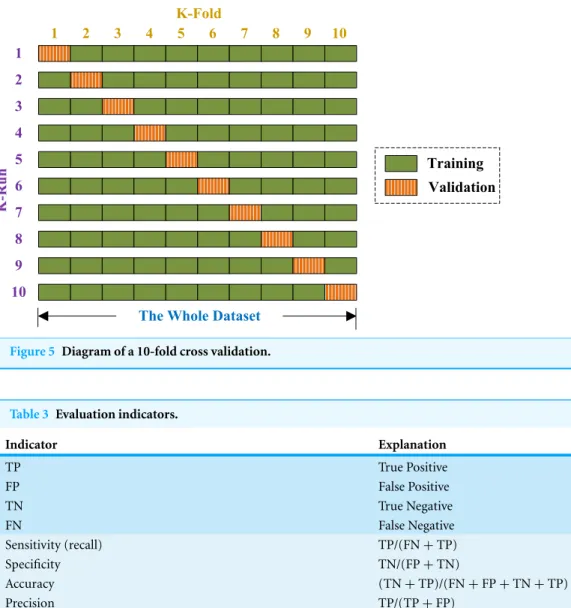
Generalization error was obtained by K-fold CV, and K was set to 10 because of two reasons: (1) to balance between computational cost and reliable estimates, and (2) for fair comparison since the common convention is to set K with the value of 10 (Zhang et al., 2014a).
Figure 5 Diagram of a 10-fold cross validation.
Table 3 Evaluation indicators.
Indicator Explanation
TP True Positive
FP False Positive
TN True Negative
FN False Negative
Sensitivity (recall) TP/(FN+TP)
Specificity TN/(FP+TN)
Accuracy (TN+TP)/(FN+FP+TN+TP)
Precision TP/(TP+FP)
Fig. 5). Above procedure repeats 10 runs, such that each subset is used once for validation. The 10 results over validation set are combined together along the diagonal blocks in
Fig. 5, with the aim of producing an individual out-of-sample evaluation. The 10-fold cross validation repeated 50 times, viz., a 50×10-fold cross validation was implemented.
Evaluation
We used four indicators to measure which algorithm performed the best. Those four indicators consisted of sensitivity (recall), specificity, accuracy, and precision (Table 3). In this work, a correctly detected AD was treated as TP. After the 50×10-fold cross validation, the final evaluation results are written in the form of “mean±standard deviation (SD)”.
The whole proposed system
Table 4 Pseudocode of proposed method.
Algorithm: proposed method
Step A Input the ground-truth imaging data together with their labels. Step B Co-registration to Talairach Coordinate by Rigid Registration.
Step C Pick up the key-slices by ICV (more than half of maximum), with 10×undersampling factor. Step D Produce displacement field for each key slice for each subject.
Step E Submit the displacement field to the classifiers.
Step F Report the classification performance based on a 50×10-fold cross validation.
Step G Report the AD-related regions with the points whose displacement magnitude is larger than five.
discriminant voxels that can detect AD from NC subjects; and (ii) The pseudocode is listed inTable 4.
EXPERIMENTS AND RESULTS
The programs were developed in-house using MATLAB (Version 2015a; Natick, MA), and run on an IBM laptop with 3 GHz Intel i3 dual-processor and 8 GB random access memory (RAM).
Key-slice selection
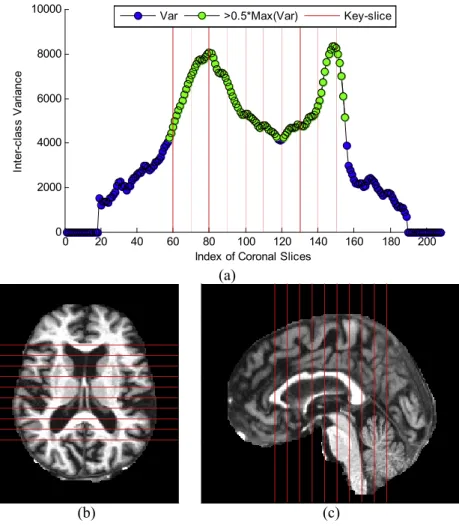
The curve of “inter-class variance” versus coronal slice index is shown inFig. 6A. Ten coronal slices, from 60 to 150 with increasing steps of 10, were selected. The reason is that their corresponding ICVs were all higher than half of the maximum value.Figures 6B–6C
shows respectively the axial and sagittal view of the selected key-slices, where the red lines represent the key-slices. The results are coherent with our formal work (Dong et al., 2015b).
Displacement field
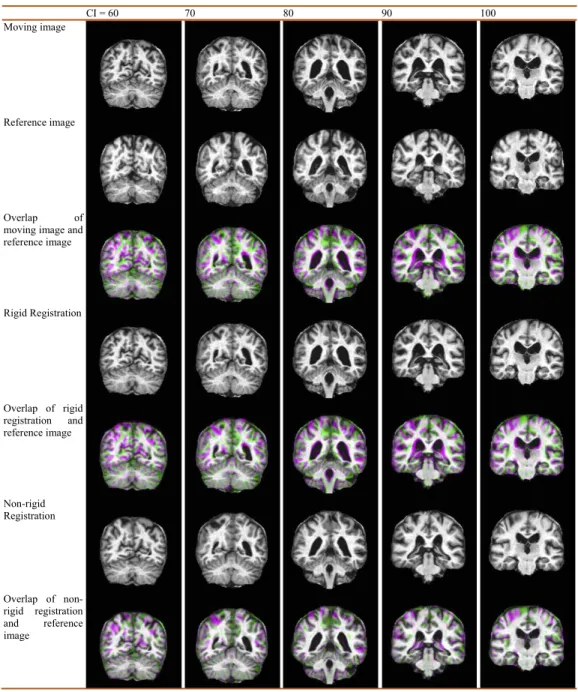
Figure 7 shows the displacement field of an AD over the key-slices. Each column
corresponds to a key slice. Here CI means coronal index. We show the moving image, the reference image, the overlap of both, the rigid registration, the overlap of rigid registration and the reference image, the non-rigid registration, the overlap of non-rigid registration and the reference image, and the displacement field for each key slice. From the row of displacement field, we can see how that a healthy brain is warped into an AD brain through the displacement fields (green arrows in the bottom row).
Classification comparison
The displacement fields were transformed into polar coordinate system, and their number was reduced by PCA as mentioned in the methodology section. Three classifiers were used: SVM, GEPSVM, and TSVM. Classification comparison results are provided inTable 5, together with the results of ten state-of-the-art methods.
Region detection
Figure 6 Results of key-slice selection.(A) Curve of ICV against CI. (B) Key-slices from axial view. (C) Key-slices from saggital view.
is because the algorithm may also consider the distortion of background. This does not influence following labelling procedure.
Area labeling
Talairach Daemon software was used to provide the anatomical label information.Table 6
shows the results, where BA represented Brodmann area. Note that some areas (such as cerebral tonsil, declive, and pyramis) move due to the expansion and shrinkage of neighboring areas, so they are not included inTable 6. We only pick up the areas with changed volume, which are judged manually.
DISCUSSION
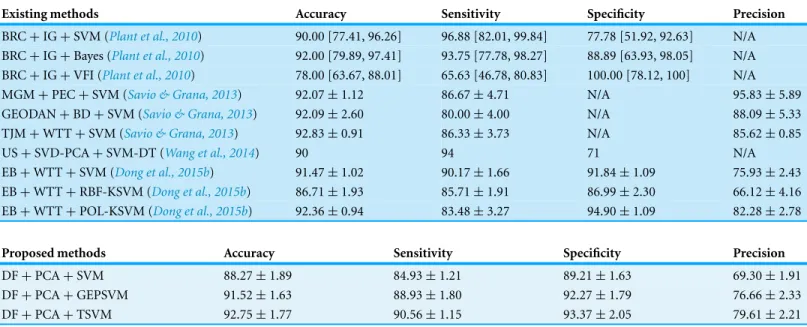
The results inTable 5compare the proposed three classifiers (SVM, GEPSVM, and TSVM) with ten state-of-the-art methods. Plant’s results (Task 1 in Table 3 inPlant et al., 2010) presented the means together with 95% confidence intervals. Wang’s results (Table 7 in
Figure 7 Displacement field of an AD with Coronal Index (CI).CI varies from 60 to 150 with increase of 10. (Please zoom in to see the displacement field.)
(Table 5 inSavio & Grana, 2013) and Dong’s results (Table 9 inDong et al., 2015b) gave the means with SD.
Figure 7 (continued)
Figure 7 (continued)
Table 5 Comparison of different methods.
Existing methods Accuracy Sensitivity Specificity Precision
BRC+IG+SVM (Plant et al., 2010) 90.00 [77.41, 96.26] 96.88 [82.01, 99.84] 77.78 [51.92, 92.63] N/A BRC+IG+Bayes (Plant et al., 2010) 92.00 [79.89, 97.41] 93.75 [77.78, 98.27] 88.89 [63.93, 98.05] N/A BRC+IG+VFI (Plant et al., 2010) 78.00 [63.67, 88.01] 65.63 [46.78, 80.83] 100.00 [78.12, 100] N/A
MGM+PEC+SVM (Savio & Grana, 2013) 92.07±1.12 86.67±4.71 N/A 95.83±5.89
GEODAN+BD+SVM (Savio & Grana, 2013) 92.09±2.60 80.00±4.00 N/A 88.09±5.33
TJM+WTT+SVM (Savio & Grana, 2013) 92.83±0.91 86.33±3.73 N/A 85.62±0.85
US+SVD-PCA+SVM-DT (Wang et al., 2014) 90 94 71 N/A
EB+WTT+SVM (Dong et al., 2015b) 91.47±1.02 90.17±1.66 91.84±1.09 75.93±2.43
EB+WTT+RBF-KSVM (Dong et al., 2015b) 86.71±1.93 85.71±1.91 86.99±2.30 66.12±4.16 EB+WTT+POL-KSVM (Dong et al., 2015b) 92.36±0.94 83.48±3.27 94.90±1.09 82.28±2.78
Proposed methods Accuracy Sensitivity Specificity Precision
DF+PCA+SVM 88.27±1.89 84.93±1.21 89.21±1.63 69.30±1.91
DF+PCA+GEPSVM 91.52±1.63 88.93±1.80 92.27±1.79 76.66±2.33
DF+PCA+TSVM 92.75±1.77 90.56±1.15 93.37±2.05 79.61±2.21
“DF+PCA+TSVM” is only less than one approach of “TJM+WTT+SVM” of 92.83% (Savio & Grana, 2013).
Why TSVM is better? There are two reasons. First, the non-parallel support vector machines provide more flexible and complicated hyperplanes than standard support vector machine. Second, the twin support vector machines formulate each of the two QP problems as a standard support vector machine, which makes it superior to generalized eigenvalue proximal support vector machine.
Figure 8 Related regions of AD.(A) CI=60, (B) CI=70, (C) CI=80, (D) CI=90, (E) CI=100, (F) CI=110, (G) CI=120, (H) CI=130, (I) CI=140, (J) CI=150.
Table 6shows that the displacement field finds the discriminant associated with the following regions reported in latest references: Angular Gyrus (Carbonell et al., 2014), Anterior Cingulate (Schultz et al., 2014), Cingulate Gyrus (Yu et al., 2014), Culmen (Almeida et al., 2011), Cuneus (Yokoyama et al., 2015), Fusiform Gyrus (Rieck et al., 2015), Inferior Frontal Gyrus (Eliasova et al., 2014), Inferior Occipital Gyrus (Liu et al., 2012), Inferior Parietal Lobule (Tramutola et al., 2015), Inferior Semi-Lunar Lobule (Almeida et al., 2011), Inferior Temporal Gyrus (Narayan et al., 2015), Insula (Fletcher et al., 2015), Lateral Ventricle (Gonzalez-Marrero et al., 2015), Lingual Gyrus (Cooley et al., 2015), Medial Frontal Gyrus (Jensen et al., 2015), Middle Frontal Gyrus (Yoo et al., 2015), Middle Occipital Gyrus (Cai et al., 2015), Middle Temporal Gyrus (Han et al., 2015), Paracentral Lobule (Kang et al., 2013), Parahippocampal Gyrus (Shimoda et al., 2015), Postcentral Gyrus (Willette et al., 2015), Posterior Cingulate (Pekarya, Sattin & Lloyd, 2015), Precentral Gyrus (Wang et al., 2015c), Precuneus (Villeneuve et al., 2015), Sub-Gyral (Ouyang et al., 2014), Superior Parietal Lobule (Yamashita et al., 2014), Superior Temporal Gyrus (Ramos et al., 2015), Supramarginal Gyrus (Redolfi et al., 2015), Uncus (Bangen et al., 2014).
Table 6 Discriminant areas with changed volume found by Talairach Daemon software.
Regions # of voxels Reported by
Angular gyrus 33 Carbonell et al. (2014)
Anterior cingulate (BA-33, BA-32, BA-24) 81 Schultz et al. (2014)
Cingulate gyrus (BA-32, BA-23, BA-24, BA-31) 1,551 Yu et al. (2014)
Culmen 396 Almeida et al. (2011)
Cuneus (BA-18, BA-30) 143 Yokoyama et al. (2015)
Fusiform gyrus (BA-18, BA-19, BA-20, BA-37) 314 Rieck et al. (2015)
Inferior frontal gyrus (BA-13, BA-45, BA-47) 320 Eliasova et al. (2014)
Inferior occipital gyrus 24 Liu et al. (2012)
Inferior parietal lobule (BA-2, BA-40) 311 Tramutola et al. (2015)
Inferior semi-lunar lobule 144 Almeida et al. (2011)
Inferior temporal gyrus (BA-20) 58 Narayan et al. (2015)
Insula (BA-44, BA-13) 328 Fletcher et al. (2015)
Lateral ventricle 33 Gonzalez-Marrero et al. (2015)
Lingual gyrus (BA-18, BA-19) 184 Cooley et al. (2015)
Medial frontal gyrus (BA-6, BA-32) 53 Jensen et al. (2015)
Middle frontal gyrus (BA-6, BA-46) 144 Yoo et al. (2015)
Middle occipital gyrus (BA-19) 175 Cai et al. (2015)
Middle temporal gyrus (BA-19, BA-20, BA-21, BA-22, BA-37, BA-38, BA-39) 485 Han et al. (2015)
Paracentral lobule (BA-5, BA-31) 161 Kang et al. (2013)
Parahippocampal gyrus (HC, BA-19, BA-30, BA-37) 62 Shimoda et al. (2015)
Postcentral gyrus (BA-2, BA-3) 244 Willette et al. (2015)
Posterior cingulate (BA-23, BA-30) 323 Pekarya, Sattin & Lloyd (2015)
Precentral gyrus (BA-4, BA-6, BA-13, BA-43, BA-44) 627 Wang et al. (2015c)
Precuneus (BA-7, BA-19, BA-31) 530 Villeneuve et al. (2015)
Sub-Gyral (Corpus, Callosum, BA-4, BA-13) 2,358 Ouyang et al. (2014)
Superior parietal lobule 21 Yamashita et al. (2014)
Superior temporal gyrus (BA-13, BA-22, BA-38, BA-39, BA-41) 462 Ramos et al. (2015)
Supramarginal gyrus (BA-40) 135 Redolfi et al. (2015)
Uncus (BA-20, BA-28, BA-34, BA-36, BA-38) 112 Bangen et al. (2014)
2015b), and subthalamic nucleus (De Reuck et al., 2014). Why are those areas not detected by our DF method? The reasons are tri-fold: (1) We only preserved the displacement field with magnitude longer than 5. Reducing the value of 5 may include more potential regions and noises. A feasible solution is to reduce from 5 to 3 and meanwhile develop robust anti-noise method. (2) Some literature used advanced imaging modalities, such as MRSI and fMRI for metabolism detection and function analysis. Therefore, we may also include these imaging-modality techniques. (3) The key-slice selection procedure may miss important regions. Hence, we will try to reduce the slice separation, although it will increase the computation burden.
Theadvantagesof displacement-field are two-fold. On one hand, it reaches excellent classification performance, which was comparable to latest approaches (Dong et al., 2015b;
Table 7 List of acronyms.
Acronym Definition
(k) (GEP) (T) SVM (kernel) (generalized eigenvalue problem) (twin) support vector machine
AD Alzheimer’s disease
ANN Artificial neural network
BA Brodmann area
BD Bhattacharyya distance
BRC Brain region cluster
CAD Computer-aided diagnosis
CC Cerebral cortex
CDR Clinical dementia rating
CSF Cerebrospinal fluid
CI Coronal index
CV Cross validation
DBM Deformation-based morphometry
DF Displacement field
DWT Discrete wavelet transform
GARCH Generalized autoregressive conditional heteroscedasticity
GEODAN Geodesic anisotropy
HC Hippocampus
ICV Inter-Class variance
IG Information gain
KNN K-nearest neighbors
MGM Modulated GM
MMSE Mini-mental state examination
MR(I) Magnetic resonance (imaging)
NBC Naive Bayes classifier
NC Normal elder controls
OASIS Open access series of imaging studies
PEC Pearson’s correlation
PNN Probabilistic neural network
PSO Particle swarm optimization
QP Quadratic programming
ROI Region of interest
RQ Rayleigh quotient
SD Standard deviation
SVD Singular value decomposition
TJM Trace of Jacobian matrix
US Undersampling
VFI Voting feature intervals
WTT Welch’st-test
CONCLUSIONS
Thecontributionsof this study consist of four points: (i) We proposed to use displacement field in the application of Alzheimer’s disease detection, and we proved its effectiveness. (ii) SVM and its two variants (GEPSVM and TSVM) were tested, and we proved TSVM performed better than SVM and GEPSVM. (iii) The proposed system achieved comparable sensitivity, specificity, and accuracy with ten state-of-the-art algorithms. (iv) The proposed computer-aided diagnosis (CAD) system can locate AD-related regions in the brain, which complies with 28 recent peer-reviewed articles.
Futureresearch direction shall center in following aspects. First, the displacement field will be generalized to 3D, so key-slice selection can be discarded. Second, we shall try to embed kernels to classifiers. Third, spectroscopy method, like extracting the quantity of Docosahexaenoic Acid (DHA) (Tan et al.), may help to increase the classification accuracy. Forth, the proposed approach might be helpful in identifying brain mechanisms underlying endogenously defensive mechanism to neuroinjury and neurodegeneration (Yuan & Hou, 2015). Fifth, the least square technique (Hamedi, Salleh & Noor, 2015) may be applied to SVM and its variants, in order to further reduce training time. Sixth, the swarm-intelligence algorithm will be introduced to help to enhance the algorithm performance (Wang et al., 2015b). Finally, the stress field calculates the stress at every point within a particular region (Petit et al., 2015). It will be tested in future research.
ADDITIONAL INFORMATION AND DECLARATIONS
Funding
This work was supported by NSFC (610011024, 61273243, 51407095), Priority Academic Program Development of Jiangsu Higher Education Institutions (PAPD), Program of Natural Science Research of Jiangsu Higher Education Institutions (13KJB460011, 14KJB520021), Jiangsu Key Laboratory of 3D Printing Equipment and Manufacturing (BM2013006), Key Supporting Science and Technology Program (Industry) of Jiangsu Province (BE2012201, BE2014009-3, BE2013012-2), Special Funds for Scientific and Tech-nological Achievement Transformation Project in Jiangsu Province (BA2013058), Nanjing Normal University Research Foundation for Talented Scholars (2013119XGQ0061, 2014119XGQ0080), and Natural Science Foundation of Jiangsu Province (BK20150982, BK20150983). The authors obtained the OASIS dataset made possible by NIH grants P50AG05681, P01 AG03991, R01 AG021910, P50 MH071616, U24 RR021382 and R01 MH56584. The funders had no role in study design, data collection and analysis, decision to publish, or preparation of the manuscript.
Grant Disclosures
The following grant information was disclosed by the authors: NSFC: 610011024, 61273243, 51407095.
Program of Natural Science Research of Jiangsu Higher Education Institutions: 13KJB460011, 14KJB520021.
Jiangsu Key Laboratory of 3D Printing Equipment and Manufacturing: BM2013006. Key Supporting Science and Technology Program (Industry) of Jiangsu Province: BE2012201, BE2014009-3, BE2013012-2.
Special Funds for Scientific and Technological Achievement Transformation Project in Jiangsu Province: BA2013058.
Nanjing Normal University Research Foundation for Talented Scholars: 2013119XGQ0061, 2014119XGQ0080).
NIH: P50AG05681, P01 AG03991, R01 AG021910, P50 MH071616, U24 RR021382, R01 MH56584.
Natural Science Foundation of Jiangsu Province: BK20150982, BK20150983.
Competing Interests
The authors declare there are no competing interests.
Author Contributions
• Yudong Zhang conceived and designed the experiments, analyzed the data, wrote the paper, prepared figures and/or tables, reviewed drafts of the paper.
• Shuihua Wang performed the experiments, contributed reagents/materials/analysis tools, wrote the paper.
Data Availability
The following information was supplied regarding data availability:
Open Access Series of Imaging Studies (OASIS):http://www.oasis-brains.org/.
Supplemental Information
Supplemental information for this article can be found online athttp://dx.doi.org/
10.7717/peerj.1251#supplemental-information.
REFERENCES
Almeida OP, Garrido GJ, Alfonso H, Hulse G, Lautenschlager NT, Hankey GJ, Flicker L. 2011.
24-month effect of smoking cessation on cognitive function and brain structure in later life.
NeuroImage55:1480–1489DOI 10.1016/j.neuroimage.2011.01.063.
´Alvarez I, G´orriz JM, Ram´ırez J, Salas-Gonzalez D, L´opez M, Segovia F, Puntonet CG, Prieto B. 2009.Alzheimer’s diagnosis using eigenbrains and support vector machines. In: Cabestany J, Sandoval F, Prieto A, Corchado J, eds.Bio-inspired systems: computational and ambient intelligence. Berlin Heidelberg: Springer, 973–980.
Anagnostopoulos CN, Giannoukos I, Spenger C, Simmons A, Mecocci P, Soininen H, Kloszewska I, Vellas B, Lovestone S, Tsolaki M. 2013.Classification models for Alzheimer’s disease detection. In: Iliadis L, Papadopoulos H, Jayne C, eds.Engineering applications of neural networks, Pt Ii, Halkidiki, 193–202.
of FDG PET as a tool for single-subject probabilistic prediction and detection of Alzheimer’s disease dementia.European Journal of Nuclear Medicine and Molecular Imaging 40:1394–1405
DOI 10.1007/s00259-013-2458-z.
Ardekani BA, Figarsky K, Sidtis JJ. 2013. Sexual dimorphism in the human corpus callosum: an mri study using the OASIS brain database.Cerebral Cortex23:2514–2520
DOI 10.1093/cercor/bhs253.
Bangen KJ, Nation DA, Clark LR, Harmell AL, Wierenga CE, Dev SI, Delano-Wood L, Zlatar ZZ, Salmon DP, Liu TT, Bondi MW. 2014.Interactive effects of vascular risk burden and
advanced age on cerebral blood flow.Frontiers in Aging Neuroscience6:Article 00159
DOI 10.3389/fnagi.2014.00159.
Brookmeyer R, Johnson E, Ziegler-Graham K, Arrighi HM. 2007.Forecasting the global burden of Alzheimer’s disease.Alzheimer’s & Dementia3:186–191DOI 10.1016/j.jalz.2007.04.381.
Cai SP, Huang LY, Zou J, Jing LL, Zhai BZ, Ji GJ, Von Deneen KM, Ren JC, Ren AF, Alzheimer’s Disease Neuroimaging Initiative. 2015.Changes in thalamic connectivity in the early and late stages of amnestic mild cognitive impairment: a resting-state functional magnetic resonance study from ADNI.PLoS ONE10:e0115573DOI 10.1371/journal.pone.0115573.
Carbonell F, Charil A, Zijdenbos AP, Evans AC, Bedell BJ, Alzheimer’s Disease Neuroimaging Initiative. 2014.Hierarchical multivariate covariance analysis of metabolic connectivity.Journal of Cerebral Blood Flow and Metabolism34:1936–1943DOI 10.1038/jcbfm.2014.165.
Chaves R, Ramirez J, Gorriz JM, Alzheimer’s Disease Neuroimaging Initiative. 2013.Integrating discretization and association rule-based classification for Alzheimer’s disease diagnosis.Expert Systems with Applications40:1571–1578DOI 10.1016/j.eswa.2012.09.003.
Chaves R, Ramirez J, Gorriz JM, Illan IA, Gomez-Rio M, Carnero C, Alzheimer’s Disease Neuroimaging Initiative. 2012. Effective diagnosis of Alzheimer’s disease by means of large margin-based methodology. BMC Medical Informatics and Decision Making
12:17DOI 10.1186/1472-6947-12-79.
Cohen AD, Klunk WE. 2014.Early detection of Alzheimer’s disease using PiB and FDG PET.
Neurobiology of Disease72:117–122DOI 10.1016/j.nbd.2014.05.001.
Collins MP, Pape SE. 2011.The potential of support vector machine as the diagnostic tool for schizophrenia: a systematic literature review of neuroimaging studies.European Psychiatry26 (Supplement 1):P03–P194DOI 10.1016/S0924-9338(11)73068-1.
Cooley SA, Cabeen RP, Laidlaw DH, Conturo TE, Lane EM, Heaps JM, Bolzenius JD, Baker LM, Salminen LE, Scott SE, Paul RH. 2015.Posterior brain white matter abnormalities in older adults with probable mild cognitive impairment. Journal of Clinical and Experimental Neuropsychology37:61–69DOI 10.1080/13803395.2014.985636.
Damodharan S, Raghavan D. 2015.Combining tissue segmentation and neural network for brain tumor detection.International Arab Journal of Information Technology12:42–52.
Das Gupta A, Tamadapu G. 2013.In-plane dynamics of membranes having constant curvature.
European Journal of Mechanics—A/Solids39:280–290DOI 10.1016/j.euromechsol.2012.12.010.
De Reuck JL, Deramecourt V, Auger F, Durieux N, Cordonnier C, Devos D, Defebvre L, Moreau C, Caparros-Lefebvre D, Leys D, Maurage CA, Pasquier F, Bordet R. 2014.Iron deposits in post-mortem brains of patients with neurodegenerative and cerebrovascular diseases: a semi-quantitative 7.0 T magnetic resonance imaging study.European Journal of Neurology21:1026–1031DOI 10.1111/ene.12432.
Dong Z, Liu A, Wang S, Ji G, Zhang Z, Yang J, Zhang Y. 2015a.Magnetic resonance brain image classification via stationary wavelet transform and generalized eigenvalue
proximal support vector machine.Journal of Medical Imaging and Health Informatics5:1–9
Dong Z, Phillips P, Wang S, Ji G, Yang J, Yuan T-F. 2015b.Detection of subjects and brain regions related to Alzheimer’s disease using 3D MRI scans based on eigenbrain and machine learning.
Frontiers in Computational Neuroscience66:1–15.
Dukart J, Mueller K, Barthel H, Villringer A, Sabri O, Schroeter ML, Alzheimer’s Disease Neuroimaging Initiative. 2013.Meta-analysis based SVM classification enables accurate detection of Alzheimer’s disease across different clinical centers using FDG-PET and MRI.
Psychiatry Research-Neuroimaging212:230–236DOI 10.1016/j.pscychresns.2012.04.007.
El-Dahshan ESA, Hosny T, Salem ABM. 2010.Hybrid intelligent techniques for MRI brain images classification.Digital Signal Processing20:433–441DOI 10.1016/j.dsp.2009.07.002.
El-Dahshan ESA, Mohsen HM, Revett K, Salem ABM. 2014.Computer-aided diagnosis of human brain tumor through MRI: a survey and a new algorithm.Expert Systems with Applications
41:5526–5545DOI 10.1016/j.eswa.2014.01.021.
Eliasova I, Anderkova L, Marecek R, Rektorova I. 2014.Non-invasive brain stimulation of the right inferior frontal gyrus may improve attention in early Alzheimer’s disease: a pilot study.
Journal of the Neurological Sciences346:318–322DOI 10.1016/j.jns.2014.08.036.
Esposito R, Mosca A, Pieramico V, Cieri F, Cera N, Sensi SL. 2013.Characterization of resting state activity in MCI individuals.PeerJ1:e135DOI 10.7717/peerj.135.
Fletcher PD, Downey LE, Golden HL, Clark CN, Slattery CF, Paterson RW, Schott JM, Rohrer JD, Rossor MN, Warren JD. 2015.Auditory hedonic phenotypes in dementia: a behavioural and neuroanatomical analysis.Cortex67:95–105DOI 10.1016/j.cortex.2015.03.021.
Goh S, Dong Z, Zhang Y, DiMauro S, Peterson BS. 2014. Mitochondrial dysfunction as a neurobiological subtype of autism spectrum disorder: evidence from brain imaging.JAMA Psychiatry71:665–671DOI 10.1001/jamapsychiatry.2014.179.
Gonzalez-Marrero I, Gimenez-Llort L, Johanson CE, Carmona-Calero EM, Castaneyra-Ruiz L, Brito-Armas JM, Castaneyra-Perdomo A, Castro-Fuentes R. 2015. Choroid plexus
dysfunction impairs beta-amyloid clearance in a triple transgenic mouse model of Alzheimer’s disease.Frontiers in Cellular Neuroscience9:Article 00017DOI 10.3389/fncel.2015.00017.
Gray KR, Wolz R, Heckemann RA, Aljabar P, Hammers A, Rueckert D, Alzheimer’s Disease Neuroimaging Initiative. 2012.Multi-region analysis of longitudinal FDG-PET for the classifi-cation of Alzheimer’s disease.NeuroImage60:221–229DOI 10.1016/j.neuroimage.2011.12.071.
Hahn K, Myers N, Prigarin S, Rodenacker K, Kurz A, F¨orstl H, Zimmer C, Wohlschl¨ager AM, Sorg C. 2013.Selectively and progressively disrupted structural connectivity of functional brain networks in Alzheimer’s disease—revealed by a novel framework to analyze edge distributions of networks detecting disruptions with strong statistical evidence.NeuroImage81:96–109
DOI 10.1016/j.neuroimage.2013.05.011.
Hamedi M, Salleh SH, Noor AM. 2015.Facial neuromuscular signal classification by means of least square support vector machine for MuCI. Applied Soft Computing 30:83–93
DOI 10.1016/j.asoc.2015.01.034.
Han PC, Caselli RJ, Baxter L, Serrano G, Yin JX, Beach TG, Reiman EM, Shi J. 2015.
Association of pituitary adenylate cyclase-activating polypeptide with cognitive decline in mild cognitive impairment due to Alzheimer disease.JAMA Neurology 72:333–339
DOI 10.1001/jamaneurol.2014.3625.
Huang XJ, Dione DP, Compas CB, Papademetris X, Lin BA, Bregasi A, Sinusas AJ, Staib LH, Duncan JS. 2014.Contour tracking in echocardiographic sequences via sparse representation and dictionary learning.Medical Image Analysis18:253–271DOI 10.1016/j.media.2013.10.012.
Jayadeva KR, Chandra S. 2007. Twin support vector machines for pattern classifi-cation. IEEE Transactions on Pattern Analysis and Machine Intelligence29:905–910
DOI 10.1109/TPAMI.2007.1068.
Jensen MM, Arvaniti M, Mikkelsen JD, Michalski D, Pinborg LH, Hartig W, Thomsen MS. 2015. Prostate stem cell antigen interacts with nicotinic acetylcholine receptors and is affected in Alzheimer’s disease. Neurobiology of Aging 36:1629–1638
DOI 10.1016/j.neurobiolaging.2015.01.001.
Kalbkhani H, Shayesteh MG, Zali-Vargahan B. 2013.Robust algorithm for brain magnetic resonance image (MRI) classification based on GARCH variances series.Biomedical Signal Processing and Control8:909–919DOI 10.1016/j.bspc.2013.09.001.
Kang K, Yoon U, Lee JM, Lee HW. 2013.Idiopathic normal-pressure hydrocephalus, cortical thinning, and the cerebrospinal fluid tap test.Journal of the Neurological Sciences334:55–62
DOI 10.1016/j.jns.2013.07.014.
Kantanen M, Kiuru-Enari S, Salonen O, Kaipainen M, Hokkanen L. 2014. Subtle neuropsychiatric and neurocognitive changes in hereditary gelsolin amyloidosis (AGel amyloidosis).PeerJ2:e493DOI 10.7717/peerj.493.
Khemchandani R, Karpatne A, Chandra S. 2011.Generalized eigenvalue proximal support vector regressor.Expert Systems with Applications38:13136–13142DOI 10.1016/j.eswa.2011.04.121.
Kodipaka S, Vemuri BC, Rangarajan A, Leonard CM, Schmallfuss I, Eisenschenk S. 2007.Kernel Fisher discriminant for shape-based classification in epilepsy.Medical Image Analysis11:79–90
DOI 10.1016/j.media.2006.10.002.
Kubota T, Ushijima Y, Nishimura T. 2006. A region-of-interest (ROI) template for three-dimensional stereotactic surface projection (3D-SSP) images: initial application to analysis of Alzheimer disease and mild cognitive impairment.International Congress Series
1290:128–134DOI 10.1016/j.ics.2005.11.104.
Lee W, Park B, Han K. 2013. Classification of diffusion tensor images for the early detection of Alzheimer’s disease. Computers in Biology and Medicine 43:1313–1320
DOI 10.1016/j.compbiomed.2013.07.004.
Lee J, Sandhu R, Tannenbaum A. 2013. Particle filters and occlusion handling for rigid 2D-3D pose tracking. Computer Vision and Image Understanding 117:922–933
DOI 10.1016/j.cviu.2013.04.002.
Liu ZY, Bai LJ, Dai RW, Zhong CG, Xue T, You YB, Tian J. 2012.Dysfunctional whole brain networks in mild cognitive impairment patients: an fMRI study. In:Medical imaging 2012: biomedical applications in molecular, structural, and functional imaging, vol. 8317, 6 pages.
Lu ZT, Yang W, Zhang MH. 2014. Robust medical image elastic registration using global optimisation strategy in frequency domain.Imaging Science Journal 62:42–47
DOI 10.1179/1743131X12Y.0000000043.
Mangasarian OL, Wild EW. 2006.Multisurface proximal support vector machine classification via generalized eigenvalues.IEEE Transactions on Pattern Analysis and Machine Intelligence
28:69–74DOI 10.1109/TPAMI.2006.17.
Miller V, Erlien S, Piersol J. 2012. Identifying dementia in MRI scans using machine learning. Available at
Montagne A, Barnes SR, Sweeney MD, Halliday MR, Sagare AP, Zhao Z, Toga AW, Jacobs RE, Liu CY, Amezcua L, Harrington MG, Chui HC, Law M, Zlokovic BV. 2015.
Blood–brain barrier breakdown in the aging human hippocampus.Neuron85:296–302
DOI 10.1016/j.neuron.2014.12.032.
Murphy MC, Huston J, Jack CR, Glaser KJ, Manduca A, Felmlee JP, Ehman RL. 2011.Decreased brain stiffness in Alzheimer’s disease determined by magnetic resonance elastography.Journal of Magnetic Resonance Imaging34:494–498DOI 10.1002/jmri.22707.
Narayan PJ, Lill C, Faull R, Curtis MA, Dragunow M. 2015.Increased acetyl and total histone levels in post-mortem Alzheimer’s disease brain.Neurobiology of Disease74:281–294
DOI 10.1016/j.nbd.2014.11.023.
Nasiri JA, Charkari NM, Mozafari K. 2014. Energy-based model of least squares twin Support Vector Machines for human action recognition.Signal Processing 104:248–257
DOI 10.1016/j.sigpro.2014.04.010.
Nazir M, Wahid F, Khan SA. 2015.A simple and intelligent approach for brain MRI classification.
Journal of Intelligent & Fuzzy Systems28:1127–1135DOI 10.3233/IFS-141396.
Ouyang X, Sun XY, Guo T, Sun QY, Chen KW, Yao L, Wu X, Guo XJ, Alzheimer’s Disease Neuroimaging Initiative. 2014.Independent component analysis of DTI data reveals white matter covariances in Alzheimer’s disease. In:Medical imaging 2014: biomedical applications in molecular, structural, and functional imaging, vol. 9038, 7 pages.
Park H. 2012.Comparison of distance measures for manifold learning: application to Alzheimer’s brain scans.Journal of the Korean Physical Society61:1148–1155DOI 10.3938/jkps.61.1148.
Pekarya AE, Sattin A, Lloyd RL. 2015. Ketamine modulates TRH and TRH-like peptide turnover in brain and peripheral tissues of male rats.Peptides 69:66–76
DOI 10.1016/j.peptides.2015.04.003.
Pennanen C, Kivipelto M, Tuomainen S, Hartikainen P, H¨anninen T, Laakso MP,
Hallikainen M, Vanhanen M, Nissinen A, Helkala E-L, Vainio P, Vanninen R, Partanen K, Soininen H. 2004.Hippocampus and entorhinal cortex in mild cognitive impairment and early AD.Neurobiology of Aging25:303–310DOI 10.1016/S0197-4580(03)00084-8.
Petibon Y, Ouyang J, Zhu X, Huang C, Reese TG, Chun SY, Li Q, El Fakhri G. 2013.
Cardiac motion compensation and resolution modeling in simultaneous PET-MR: a cardiac lesion detection study. Physics in Medicine and Biology 58:2085–2102
DOI 10.1088/0031-9155/58/7/2085.
Petit J, Castelnau O, Bornert M, Zhang FG, Hofmann F, Korsunsky AM, Faurie D, Le Bourlot C, Micha JS, Robach O, Ulrich O. 2015.Laue-DIC: a new method for improved stress field measurements at the micrometer scale. Journal of Synchrotron Radiation22:980–994
DOI 10.1107/S1600577515005780.
Pirone A, Magliaro C, Giannessi E, Ahluwalia A. 2015.Parvalbumin expression in the claustrum of the adult dog. An immunohistochemical and topographical study with comparative notes on the structure of the nucleus. Journal of Chemical Neuroanatomy64–65:33–42
DOI 10.1016/j.jchemneu.2015.02.004.
Plant C, Teipel SJ, Oswald A, B¨ohm C, Meindl T, Mourao-Miranda J, Bokde AW, Hampel H, Ewers M. 2010.Automated detection of brain atrophy patterns based on MRI for the prediction of Alzheimer’s disease.NeuroImage50:162–174DOI 10.1016/j.neuroimage.2009.11.046.
Ramos P, Santos A, Pinto NR, Mendes R, Magalhaes T, Almeida A. 2015.Anatomical regional differences in selenium levels in the human brain.Biological Trace Element Research163:89–96
Redolfi A, Manset D, Barkhof F, Wahlund LO, Glatard T, Mangin JF, Frisoni GB, Alzheimer’s Disease Neuroimaging Initiative. 2015.Head-to-head comparison of two popular cortical thickness extraction algorithms: a cross-sectional and longitudinal study. PLoS ONE
10(3):e0117692DOI 10.1371/journal.pone.0117692.
Rieck JR, Rodrigue KM, Kennedy KM, Devous MD, Park DC. 2015.The effect of beta-amyloid on face processing in young and old adults: a multivariate analysis of the BOLD signal.Human Brain Mapping36:2514–2526DOI 10.1002/hbm.22788.
Saritha M, Joseph KP, Mathew AT. 2013.Classification of MRI brain images using combined wavelet entropy based spider web plots and probabilistic neural network.Pattern Recognition Letters34:2151–2156DOI 10.1016/j.patrec.2013.08.017.
Savio A, Grana M. 2013. Deformation based feature selection for computer aided diagnosis of Alzheimer’s disease. Expert Systems with Applications 40:1619–1628
DOI 10.1016/j.eswa.2012.09.009.
Schultz SA, Larson J, Oh J, Koscik R, Dowling MN, Gallagher CL, Carlsson CM, Rowley HA, Bendlin BB, Asthana S, Hermann BP, Johnson SC, Sager M, LaRue A, Okonkwo OC. 2014.
Participation in cognitively-stimulating activities is associated with brain structure and cognitive function in preclinical Alzheimer’s disease.Brain Imaging and BehaviorEpub ahead of print.
Shao YH, Chen WJ, Zhang JJ, Wang Z, Deng NY. 2014.An efficient weighted Lagrangian twin support vector machine for imbalanced data classification.Pattern Recognition47:3158–3167
DOI 10.1016/j.patcog.2014.03.008.
Shao YH, Deng NY, Chen WJ, Wang Z. 2013.Improved generalized eigenvalue proximal support vector machine.IEEE Signal Processing Letters20:213–216DOI 10.1109/LSP.2012.2216874.
Shimoda K, Kimura M, Yokota M, Okubo Y. 2015.Comparison of regional gray matter volume abnormalities in Alzheimer’s disease and late life depression with hippocampal atrophy using VSRAD analysis: a voxel-based morphometry study.Psychiatry Research-Neuroimaging
232:71–75DOI 10.1016/j.pscychresns.2015.01.018.
Song YT, Wang JT. 2010.Overview of Chinese research on senile dementia in mainland China.
Ageing Research Reviews9:S6–S12DOI 10.1016/j.arr.2010.08.007.
Tan Y, Ren H, Shi Z, Yao X, He C, Kang JX, Wan JB, Li P, Yuan TF, Su H.Endogenous
Docosahexaenoic Acid (DHA) prevents abeta1-42 oligomer-induced neuronal injury.Molecular NeurobiologyDOI 10.1007/s12035-015-9224-0.
Tramutola A, Triplett JC, Di Domenico F, Niedowicz DM, Murphy MP, Coccia R, Perluigi M, Butterfield DA. 2015.Alteration of mTOR signaling occurs early in the progression of Alzheimer disease (AD): analysis of brain from subjects with pre-clinical AD, amnestic mild cognitive impairment and late-stage AD.Journal of Neurochemistry133:739–749
DOI 10.1111/jnc.13037.
Vandemeulebroucke J, Bernard O, Rit S, Kybic J, Clarysse P, Sarrut D. 2012.Automated segmentation of a motion mask to preserve sliding motion in deformable registration of thoracic CT.Medical Physics39:1006–1015DOI 10.1118/1.3679009.
Villeneuve S, Rabinovici GD, Cohn-Sheehy BI, Madison C, Ayakta N, Ghosh PM, La Joie R, Arthur-Bentil SK, Vogel JW, Marks SM, Lehmann M, Rosen HJ, Reed B, Olichney J, Boxer AL, Miller BL, Borys E, Jin L-W, Huang EJ, Grinberg LT, DeCarli C, Seeley WW, Jagust W. 2015. Existing Pittsburgh Compound-B positron emission tomography
thresholds are too high: statistical and pathological evaluation.Brain: A Journal of Neurology
Wang S, Dong Z, Ji G, Zhang Y. 2014.Classification of Alzheimer disease based on structural magnetic resonance imaging by kernel support vector machine decision tree.Progress in Electromagnetics Research144:171–184DOI 10.2528/PIER13121205.
Wang XL, Du MY, Chen TL, Chen ZQ, Huang XQ, Luo Y, Zhao YJ, Kumar P, Gong QY. 2015c. Neural correlates during working memory processing in major depressive disorder. Progress in Neuro-Psychopharmacology & Biological Psychiatry 56:101–108
DOI 10.1016/j.pnpbp.2014.08.011.
Wang S, Zhang Y, Dong Z, Du S, Ji G, Yan J, Yang J, Wang Q, Feng C, Phillips P. 2015a.
Feed-forward neural network optimized by hybridization of PSO and ABC for abnormal brain detection.International Journal of Imaging Systems and Technology25:153–164
DOI 10.1002/ima.22132.
Wang S, Zhang Y, Ji G, Yang J, Wu J, Wei L. 2015b.Fruit classification by wavelet-entropy and feedforward neural network trained by fitness-scaled chaotic ABC and biogeography-based optimization.Entropy17:5711–5728DOI 10.3390/e17085711.
Willette AA, Modanlo N, Kapogiannis D, Alzheimer’s Disease Neuroimaging Initiative. 2015.
Insulin resistance predicts medial temporal hypermetabolism in mild cognitive impairment conversion to Alzheimer disease.Diabetes64:1933–1940DOI 10.2337/db14-1507.
Xinyun C, Wenlu Y, Xudong H. 2011.ICA-based classification of MCI vs HC. In:Natural computation (ICNC), 2011 seventh international conference on. 1658–1662.
Xu ZJ, Qi ZQ, Zhang JQ. 2014. Learning with positive and unlabeled examples using biased twin support vector machine.Neural Computing & Applications25:1303–1311
DOI 10.1007/s00521-014-1611-3.
Yamashita K, Taniwaki Y, Utsunomiya H, Taniwaki T. 2014.Cerebral blood flow reduction associated with orientation for time in amnesic mild cognitive impairment and Alzheimer disease patients.Journal of Neuroimaging24:590–594DOI 10.1111/jon.12096.
Yang D, Deasy JO, Low DA, El Naqa I. 2007.Level set motion assisted non-rigid 3D image registration. In: Pluim JPW, Reinhardt JM, eds.Medical imaging 2007 conference,Proceedings of the society of photo-optical instrumentation engineers,vol. 6512. San Diego: SPIE,
651207–651211.
Yang G, Zhang Y, Yang J, Ji G, Dong Z, Wang S, Feng C, Wang Q. 2015.Automated classification of brain images using wavelet-energy and biogeography-based optimization.Multimedia Tools and Applications74(9):1–17DOI 10.1007/s11042-015-2649-7.
Yokoyama JS, Lee AK, Takada LT, Busovaca E, Bonham LW, Chao SZ, Tse M, He J, Schwarz CG, Carmichael OT, Matthews BR, Karydas A, Weiner MW, Coppola G, DeCarli CS, Miller BL, Rosen HJ. 2015.Apolipoprotein epsilon 4 is associated with lower brain volume in cognitively normal chinese but not white older adults. PLoS ONE 10(3):e0118338
DOI 10.1371/journal.pone.0118338.
Yoo SW, Han CE, Shin JS, Seo SW, Na DL, Kaiser M, Jeong Y, Seong JK. 2015. A network flow-based analysis of cognitive reserve in normal ageing and Alzheimer’s disease.Scientific Reports5:Article 10057DOI 10.1038/srep10057.
Yu Q, Peng Y, Mishra V, Ouyang A, Li H, Zhang H, Chen M, Liu S, Huang H. 2014.
Microstructure, length, and connection of limbic tracts in normal human brain development.
Frontiers in Aging Neuroscience6:Article 00228DOI 10.3389/fnagi.2014.00228.
Yuan TF, Machado S, Arias-Carrion O. 2014. Gut microbiota and brain function: a new target for brain diseases?CNS & Neurological Disorders-Drug Targets13:733–735
DOI 10.2174/187152731305140717104045.
Zhang YD, Dong ZC, Ji GL, Wang SH. 2014b.An improved reconstruction method for CS-MRI based on exponential wavelet transform and iterative shrinkage/thresholding algorithm.Journal of Electromagnetic Waves and Applications28:2327–2338DOI 10.1080/09205071.2014.967365.
Zhang Y, Dong Z, Ji G, Wang S. 2015a.Effect of spider-web-plot in MR brain image classification.
Pattern Recognition Letters62:14–16DOI 10.1016/j.patrec.2015.04.016.
Zhang Y, Dong Z, Phillips P, Wang S, Ji G, Yang J. 2015b.Exponential wavelet iterative shrinkage thresholding algorithm for compressed sensing magnetic resonance imaging.Information Sciences322:115–132DOI 10.1016/j.ins.2015.06.017.
Zhang Y, Dong Z, Wang S, Ji G, Yang J. 2015c.Preclinical diagnosis of Magnetic Resonance (MR) brain images via discrete wavelet packet transform with tsallis entropy and
generalized eigenvalue proximal support vector machine (GEPSVM).Entropy17:1795–1813
DOI 10.3390/e17041795.
Zhang Y, Wang S, Dong Z, Phillip P, Ji G, Yang J. 2015d.Pathological brain detection in magnetic resonance imaging scanning by wavelet entropy and hybridization of biogeography-based optimization and particle swarm optimization.Progress in Electromagnetics Research152:41–58.
Zhang Y, Wang S, Ji G, Dong Z. 2013.An MR brain images classifier system via particle swarm optimization and kernel support vector machine.The Scientific World Journal2013:Article 130134DOI 10.1155/2013/130134.
Zhang Y, Wang S, Ji G, Dong Z. 2015e.Exponential wavelet iterative shrinkage thresholding algorithm with random shift for compressed sensing magnetic resonance imaging.IEEJ Transactions on Electrical and Electronic Engineering10:116–117DOI 10.1002/tee.22059.
Zhang Y, Wang S, Phillips P, Dong Z, Ji G, Yang J. 2015f.Detection of Alzheimer’s disease and mild cognitive impairment based on structural volumetric MR images using 3D-DWT and WTA-KSVM trained by PSOTVAC.Biomedical Signal Processing and Control21:58–73
DOI 10.1016/j.bspc.2015.05.014.
Zhang Y, Wang S, Phillips P, Ji G. 2014a.Binary PSO with mutation operator for feature selection using decision tree applied to spam detection.Knowledge-Based Systems64:22–31
DOI 10.1016/j.knosys.2014.03.015.
Zhang Y, Wu L. 2012.An MR brain images classifier via principal component analysis and kernel support vector machine. Progress in Electromagnetics Research130:369–388
DOI 10.2528/PIER12061410.