BGD
5, 3825–3843, 2008Effect of elevated CO2 on plants in YNP
S. Sharma and D. G. Williams
Title Page
Abstract Introduction
Conclusions References
Tables Figures
◭ ◮
◭ ◮
Back Close
Full Screen / Esc
Printer-friendly Version
Interactive Discussion
Biogeosciences Discuss., 5, 3825–3843, 2008 www.biogeosciences-discuss.net/5/3825/2008/ © Author(s) 2008. This work is distributed under the Creative Commons Attribution 3.0 License.
Biogeosciences Discussions
Biogeosciences Discussionsis the access reviewed discussion forum ofBiogeosciences
Carbon and oxygen isotope analysis of
leaf biomass reveals contrasting
photosynthetic responses to elevated
CO
2
near geologic vents in Yellowstone
National Park
S. Sharma1and D. G. Williams1,*
1
Department of Renewable Resources, University of Wyoming, Laramie, WY, USA
*
also at: Department of Botany, University of Wyoming, Laramie, WY, USA
Received: 1 August 2008 – Accepted: 8 August 2008 – Published: 17 September 2008
Correspondence to: S. Sharma ([email protected])
BGD
5, 3825–3843, 2008Effect of elevated CO2 on plants in YNP
S. Sharma and D. G. Williams
Title Page
Abstract Introduction
Conclusions References
Tables Figures
◭ ◮
◭ ◮
Back Close
Full Screen / Esc
Printer-friendly Version
Interactive Discussion Abstract
In this study we explore the use of natural CO2emissions in Yellowstone National Park
(YNP) in Wyoming, USA to study responses of natural vegetation to elevated CO2
levels. Radiocarbon (14C) analysis of leaf biomass from a conifer (Pinus contortus; lodgepole pine) and an invasive, non-native herb (Linaria dalmatica; Dalmation
toad-5
flax) was used to trace the inputs of vent CO2and quantify assimilation-weighted CO2
concentrations experienced by individual plants near vents and in comparable loca-tions with no geologic CO2 exposure. The carbon and oxygen isotopic composition and nitrogen percent of leaf biomass from the same plants was used to investigate photosynthetic responses of these plants to naturally elevated atmospheric CO2
con-10
centrations. The coupled shifts in carbon and oxygen isotope values suggest that dalmation toadflax responded to elevated CO2 exposure by increasing stomatal
con-ductance with no change in photosynthetic capacity and lodgepole pine apparently responded by decreasing stomatal conductance and photosynthetic capacity. Lodge-pole pine saplings exposed to elevated levels of CO2likewise had reduced leaf nitrogen
15
concentrations compared to plants with no enhanced CO2exposure, further
suggest-ing that this widespread and dominant conifer down-regulated photosynthetic capacity under elevated CO2levels near geologic vents.
1 Introduction
Effects of elevated CO2 on plant photosynthesis and growth have been intensively
20
studied because of the prominent role terrestrial vegetation plays in the global carbon cycle. Unresolved is whether and to what degree photosynthesis will be stimulated and how stomatal conductance and carboxylation and photochemical capacities are likely to react to globally increased CO2levels (Ainsworth and Rogers, 2007). Free-Air
CO2Enrichment (FACE) is the preferred approach for studying effects of elevated CO2
25
con-BGD
5, 3825–3843, 2008Effect of elevated CO2 on plants in YNP
S. Sharma and D. G. Williams
Title Page
Abstract Introduction
Conclusions References
Tables Figures
◭ ◮
◭ ◮
Back Close
Full Screen / Esc
Printer-friendly Version
Interactive Discussion
straints and technical difficulties have severely limited application of FACE technology across different ecosystems and climate. Further due to cost constraints most FACE experiments are short term providing only limited opportunities to study feedbacks on community structure and soil biogeochemistry. Geologic CO2emissions at the terres-trial surface offer an alternative low cost approach for studying elevated CO2 effects
5
on plant communities growing in natural environments (Bettaraini et al., 1995; Miglietta et al., 1998; Tognetti et al., 2000). Although natural CO2 gradients established near geologic CO2vents can be confounded with other environmental factors, observations
from such systems provide an opportunity to examine effects of long-term exposure to elevated CO2to compare against results from short-term Free-Air CO2Enrichment
10
(FACE) experiments.
In this study we explore the use of natural CO2 emissions in Yellowstone National
Park (YNP) in Wyoming, USA to study responses of a native conifer (Pinus contor-tus; Lodgepole pine) and an invasive, non-native herb (Linaria dalmatica; Dalmation toadflax) to elevated CO2 levels. There are numerous cold geologic features in YNP
15
emitting large quantities of CO2 at very high concentrations (>99%) with very
mini-mal traces of H2S and CH4 and the native vegetation has been exposed to elevated levels of CO2 at these sites for generations. The CO2 emitted from geologic vents
in YNP has no 14C, whereas background air has distinguishable and stable levels of
14
CO2 incorporated into plant biomass during photosynthesis. Hence, radiocarbon
20
(14C) analysis of leaf biomass was used to trace the inputs of vent CO2 and quantify assimilation-weighted CO2concentrations experienced by individual plants near vents
and in comparable locations with no geologic CO2exposure.
Changes in plant photosynthesis associated with increased atmospheric CO2 con-centration can be detected in the13C and18O isotope composition of leaves (Farquhar
25
et al., 1989; Ehleringer et al., 1993; Scheidegger et al., 2000; Barbour, 2007). The combined13C and18O isotopic composition of leaves can be used as long-term inte-grators of plant response to elevated CO2 conditions (Grams et al., 2007). Increases
BGD
5, 3825–3843, 2008Effect of elevated CO2 on plants in YNP
S. Sharma and D. G. Williams
Title Page
Abstract Introduction
Conclusions References
Tables Figures
◭ ◮
◭ ◮
Back Close
Full Screen / Esc
Printer-friendly Version
Interactive Discussion
1. a proportional increases in stomatal conductance relative to photosynthetic CO2 demand by chloroplasts or
2. a proportional decrease in photosynthetic CO2demand by chloroplasts relative to
stomatal conductance (Scheidegger et al., 2000).
Measurements of the carbon and oxygen isotopic composition of leaf organic matter
5
can be used to investigate independent effects of photosynthetic capacity and stom-atal conductance on the ratio of internal to ambient CO2composition (ci/ca) and hence ∆13C (Scheidegger et al., 2000; Barbour, 2007; Grams et al., 2007). The combined assessment ofδ13C andδ18O and N content of collected leaf samples helped us to investigate photosynthetic responses of both plant species to naturally elevated
atmo-10
spheric CO2concentrations.
2 Methods
2.1 Leaf sampling and determination of CO2exposure
Foliage samples were collected from lodgepole pine saplings at Ochre Springs and from adult plants of the invasive, non-native forb dalmation toadflax at Mammoth
Up-15
per Terraces (Fig. 1). Plants were sampled from near low-temperature CO2 vents (“elevated” CO2 sites) and from nearby sites where CO2 exposure from vents was
minimal (“control” CO2 sites). Sampling locations were selected based on observed
atmospheric CO2 concentration values measured with a portable infra-red gas ana-lyzer (IRGA; LI 6200, LiCor Inc., Lincoln NE, USA) and from site surveys (Tereck,
20
20041). Instantaneous CO2 concentrations within plant canopies measured with the
IRGA were elevated (400–600µL/L) above background levels near the CO2vents and
1
BGD
5, 3825–3843, 2008Effect of elevated CO2 on plants in YNP
S. Sharma and D. G. Williams
Title Page
Abstract Introduction
Conclusions References
Tables Figures
◭ ◮
◭ ◮
Back Close
Full Screen / Esc
Printer-friendly Version
Interactive Discussion
were near background levels (378µL/L) at comparable locations distant from vents. The control CO2 site at Ochre Springs (44◦37′1′′N; −110◦26′12′′W) was located
ap-proximately 1600 m from the elevated CO2site (44◦36′45′′N ;−110◦24′52′′W). At
Mam-moth Upper Terraces the control site (44◦57′42′′N;−110◦42′51′′W) and elevated CO2
site (44◦57′45′′N; −110◦42′54′′W) were at distance of≈200 m from each other. Soil
5
temperature variations can potentially effect the photosynthesis and water relations in different plant communities (Schwarz et al., 1997; Dang and Cheng, 2004; Zhang and Dang, 2005). Therefore, soil temperatures were measured at all sampling sites and we noted that soil temperatures at 10 cm depth were similar (between 20 and 25◦C at midday) at both control and elevated CO2sites.
10
Five individuals of lodgepole pine were haphazardly selected for isotope sampling at each of the control and elevated CO2 sites in the Ochre Springs area. Isotopic
com-position of leaves might be effected by increased hydraulic resistance resulting from increased xylem path lengths in taller trees and longer branches (Warren and Adams, 2000) and the effective CO2exposure could also vary considerably with canopy height.
15
To reduce this variability in this study needles were sampled (from the 2006 cohort) from branches of same length at the middle crown position from 0.5 to 1 m tall trees. The light environment of leaves can also potentially affect their carbon isotope signa-ture (Lockheart et al., 1997; Grams et al., 2007). Therefore, we sampled needles only from tips of south facing branches of trees exposed to similar microhabitat conditions
20
within the forest stand. Leaves of dalmation toadflax at Mammoth Upper Terraces were collected from 5 plants growing near a point CO2emission source and from 4 toadflax
plants growing in a nearby site where atmospheric CO2 levels were similar to back-ground levels. At both the elevated and control site leaves were sampled from 4 to 5 plants growing at a distance of 3–4 m from each other along a 15m transect. Leaves
25
(10–15) were collected from 4 different stems on each plant avoiding the small leaves subtending flowers.
Quantitative exposure to CO2from the geologic emissions integrated over the growth
BGD
5, 3825–3843, 2008Effect of elevated CO2 on plants in YNP
S. Sharma and D. G. Williams
Title Page
Abstract Introduction
Conclusions References
Tables Figures
◭ ◮
◭ ◮
Back Close
Full Screen / Esc
Printer-friendly Version
Interactive Discussion
IRGA measurements of air in the plant canopy. Therefore, we used the 14C content of leaves to estimate the assimilation-weighted CO2concentration exposure. The CO2
at our sampling sites can only come from 2 sources i.e. atmosphere or the vent and therefore the sum of fractions of CO2 fixed by plant coming from the vent and normal
atmosphere should be equal to unity. Using mass balance approach, the measured
5
14
C abundance in plant material (Mp) will be equal to the sum of fractions coming
from vent and atmosphere weighted by the abundance of14C in each of these gases (van Gardingen et al., 1995). CO2emitted from the vents originates from dissolution of
carbonate sediments and therefore is highly depleted in14C (so called “dead CO2”) and
14
C contribution from vent can be taken as 0 (Bettarini et al., 1995; van Gardingen et
10
al., 1995). Simple mass-balance approach was then used to calculate the average CO2
concentration surrounding individual lodgepole pine and dalmation toadflax plants: [CO2]p=[CO2]b(Mb/Mp) (1)
where [CO2]b is the mean CO2 concentration in the normal background atmosphere
(taken to be 380 ppm). Mb and Mp are the 14C abundances (reported as fraction of
15
modern standard) in leaves growing at ambient CO2 concentrations and higher CO2 concentrations, respectively.
Carbon isotope discrimination was determined from δ13C of leaf biomass (δ13Cl) andδ13C of air surrounding the plant (δ13Cp) from (Farquhar et al., 1989):
∆13C=(δ13C
p−δ13Cl)/(1+δ13Cl/1000) (2)
20
Theδ13C of CO2 in air surrounding the plant (δ 13
Cp) will represent a mixture ofδ13C
of CO2from the vent (δ 13
Cv) and background air (δ13Cb). CO2emitted from geologic
vents at Mammoth Upper Terraces and Ochre Spring sites has δ13C values of −3.9
and−3.2‰, respectively (Werner and Brantley, 2003). Theδ13C of background
atmo-spheric CO2 was assumed to be−8‰. The assimilation-weightedδ 13
C value of CO2
BGD
5, 3825–3843, 2008Effect of elevated CO2 on plants in YNP
S. Sharma and D. G. Williams
Title Page
Abstract Introduction
Conclusions References
Tables Figures
◭ ◮
◭ ◮
Back Close
Full Screen / Esc
Printer-friendly Version
Interactive Discussion
in the air surrounding individual plants was calculated using mass-balance:
δ13Cp=δ13Cb+f(δ13Cv−δ13Cb) (3)
wheref is the fraction of CO2 contribution from the vent. The fraction of CO2
con-tributed by vent is calculated using mass balance approach:
f=(∆14Cl−∆14Cb)/(∆14Cv−∆14Cb) (4)
5
where∆14C is the relative deviation of14C activity of the sample from the oxalic Acid I standard in per mil values (after accounting for14C fractionation with aδ13C correction).
∆14Cl is the measured value of leaf samples, ∆14Cb is the measured value for 2006 atmosphere at Pt. Barrow Alaska (50‰) and∆14Cv is the assumed value for CO2from
vent (−1000‰).
10
The calculated carbon isotope discrimination was then used to estimate the influ-ence of elevated CO2 concentration on the ratio of leaf intercellular to ambient CO2
concentration (ci/ca) using the simplified model of Farquhar et al. (1989) as:
ci/ca=(∆13C−a)/(b−a) (5)
where a is the carbon isotope discrimination associated with CO2 diffusion through
15
air (−4.4‰), andb is the net discrimination associated with CO2 fixation in C3 plants
(−27‰).
2.2 Leaf isotopic and N content analyses
Whole leaf samples of dalmation toadflax and lodgepole pine needles from the 2006 growth year were dried and ground in a mill to a consistent particle size. Stable isotope
20
BGD
5, 3825–3843, 2008Effect of elevated CO2 on plants in YNP
S. Sharma and D. G. Williams
Title Page
Abstract Introduction
Conclusions References
Tables Figures
◭ ◮
◭ ◮
Back Close
Full Screen / Esc
Printer-friendly Version
Interactive Discussion
measured by online pyrolysis to CO using a Finnigan TC/EA coupled to the Finnigan Delta Plus XP isotope ratio mass spectrometer. Measurement precision was assessed by replicate analysis of samples and internal lab standards and was better than±0.1‰
forδ13C and±0.25‰ forδ18O. Theδ13C andδ18O values are reported in per mil (‰)
relative to V-PDB and V-SMOW, respectively. Radiocarbon analysis was performed
5
at the W. M. Keck AMS Laboratory at the University of California, Irvine, CA, USA. Radiocarbon concentrations are reported as fractions of the Modern Standard and
∆14C is reported following conventions of Stuiver and Polach (1977).
3 Results and discussion
The assimilation-weighted CO2 exposure of a leaf calculated from radiocarbon values
10
of leaves Eq. (1) ranged from 379–381 (control site) to 401–607 ppm (elevated site) in dalmation toadflax from the Mammoth Upper Terraces site and from 378–383 (con-trol site) to 419–482 ppm (elevated site) in lodgepole pine at the Ochre Springs site. Changes in leafδ13C values in response to variations in environmental conditions in-tegrate changes in the relative demand of CO2 by chloroplasts during photosynthesis
15
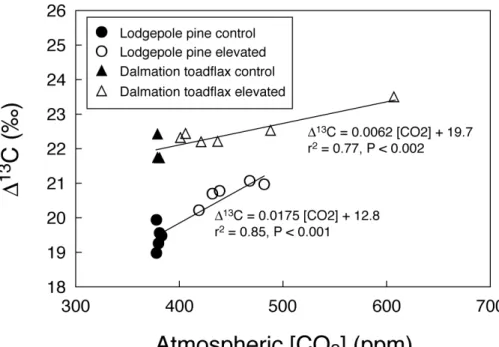
and in the supply of CO2 associated with stomatal conductance in plants (Farquhar et al., 1989; Ehleringer et al., 1993). We found that∆13C was significantly positively correlated with assimilation-weighted CO2 exposure levels (Fig. 2) for both dalmation
toadflax and lodgepole pine (dalmation toadflax, r2=0.77, P <0.002; lodgepole pine,
r2=0.85,P <0.001) indicating that elevated CO2levels caused an increase in leafci/ca.
20
The observed increase in∆13C values reflect a 13% and 17.5%increase in leafci/ca
in the case of toadflax and lodgepole pine samples, respectively.
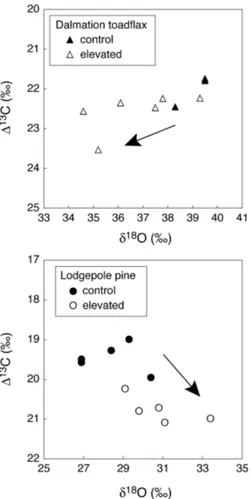
We observed a 2.4‰ decrease in δ18O of leaf biomass with increasing CO2 ex-posure in dalmation toadflax and a 2.5‰ increase inδ18O of leaf biomass along the gradient of increasing CO2 exposure in lodgepole pine (Fig. 3a and b). Because of
25
BGD
5, 3825–3843, 2008Effect of elevated CO2 on plants in YNP
S. Sharma and D. G. Williams
Title Page
Abstract Introduction
Conclusions References
Tables Figures
◭ ◮
◭ ◮
Back Close
Full Screen / Esc
Printer-friendly Version
Interactive Discussion
atmospheric vapor was similar for plants growing within control or elevated CO2sites, and the conceptual model proposed by Grams et al. (2007) can be used to understand components of the photosynthetic response of the two species. This model infers the changes in stomatal conductance,ci/ca and photosynthetic capacity of plants using a
dual carbon and oxygen isotope approach. This model is an expansion of the
concep-5
tual model proposed by Scheidegger et al. (2000) which estimates changes in leaf-to-air vapor pressure deficit from theδ18O of leaf biomass for prediction of changes that would have likely occurred in stomatal conductance. The model of Grams et al. (2007) infers stomatal conductance changes directly from δ18O of leaf cellulose bypassing the previously used relative humidity/δ18O relationship in the model of Scheidegger et
10
al. (2000). Grams et al. (2007) did not find a significant correlation betweenδ18O of leaf biomass and leaf cellulose in their study and therefore used theδ18O of leaf cellulose as the input parameter in their model. However, a reliable correlation betweenδ18O of leaf biomass and cellulose has been observed in several herbaceous and woody plants (Barbour and Farquhar, 2000; Barbour et al., 2001). We feel justified in using
15
theδ18O of leaf biomass instead ofδ18O of leaf cellulose as an input parameter in the conceptual model of Grams et al. (2007).
In case of dalmation toadflax there is an increase in ∆13C accompanied by a de-crease in δ18O of leaf biomass associated with increasing CO2 exposure (Fig. 3a).
The decrease inδ18O of leaf biomass is likely a result of an increase in stomatal
con-20
ductance. This is because higher stomatal conductance results in a higher rate of tran-spiration which cools the leaf surface and reduces the leaf intercellular vapor pressure resulting in lowerδ18O enrichment at evaporating sites. Further, due to increased tran-spiration, the convective flux of unenriched source water to evaporating sites increases, thereby reducing the enrichment of bulk leaf water (Farquhar and Lloyd, 1993). This
25
predic-BGD
5, 3825–3843, 2008Effect of elevated CO2 on plants in YNP
S. Sharma and D. G. Williams
Title Page
Abstract Introduction
Conclusions References
Tables Figures
◭ ◮
◭ ◮
Back Close
Full Screen / Esc
Printer-friendly Version
Interactive Discussion
tions from FACE sites which generally suggest increasing exposure to CO2 results in an average 22% decrease in stomatal conductance across all plant species (reviewed in Ainsworth and Rogers, 2007). However, preliminary studies in a CO2enrichment
ex-periment (http://www.phace.us) near Cheyenne, Wyoming USA (Williams, unpublished data) also confirm that dalmation toadflax shows about a 6‰ (n=2–3) decline in leaf
5
biomassδ18O values under elevated CO2conditions.
Several studies have shown that soil water savings induced by decreased stomatal conductance under elevated CO2conditions is primarily observed when moisture is
lim-iting (Field et al., 1997; Wullschleger et al., 2002). However, when soil water availability is high several plant species show higher stomatal conductance and are insensitive to
10
elevated CO2 conditions (Mooney et al., 1983; Knapp et al., 1996; Schomp, 2007). We hypothesize that since dalmation toadflax maintains deeper maximal rooting depth and greater root mass density in deep soil layers compared to other co-existing native species it has access to surplus moisture stored in deeper soil layers under elevated CO2conditions (Schomp, 2007). Due to this more favorable plant water status it shows
15
higher stomatal conductance under elevated CO2conditions.
A strikingly different pattern was observed in lodgepole pine. Here an increase in
∆13C was accompanied by an increase in δ18O of leaf biomass with increasing CO2
exposure (Fig. 3b). The increase inδ18O of leaf biomass is likely a result of decreased stomatal conductance. The decreased stomatal conductance should result in a
de-20
crease in ci/ca if photosynthetic CO2 demand is unchanged. However, we observed
an increase in ci/ca in lodgepole pine exposed to elevated CO2 levels likely due to
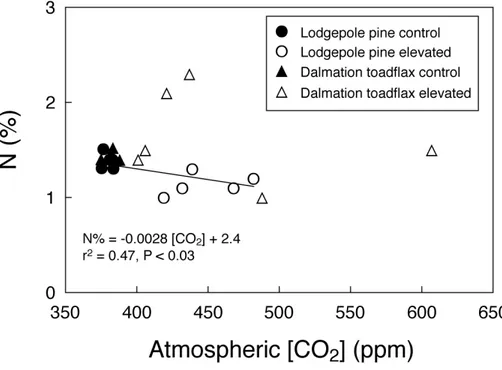
decreased photosynthetic capacity. The N concentration of plant leaves is positively correlated with photosynthetic capacity (Field and Mooney, 1986), as most of the N in leaves is used for synthesis of photosynthetic enzymes, and in particular Rubisco
25
(Shangguan et al., 2000). The N concentration of lodgepole pine with an increase in atmospheric CO2 concentration (r
2
=0.47;P <0.03) (Fig. 4). This decrease in leaf N% at elevated CO2might be an additional indicator of decreased photosynthetic capacity
BGD
5, 3825–3843, 2008Effect of elevated CO2 on plants in YNP
S. Sharma and D. G. Williams
Title Page
Abstract Introduction
Conclusions References
Tables Figures
◭ ◮
◭ ◮
Back Close
Full Screen / Esc
Printer-friendly Version
Interactive Discussion
N and∆13C in dalmation toadflax (Fig. 4). Therefore we can infer that photosynthetic capacity of lodgepole pine decreases under higher CO2 concentrations. Our result
again contradicts the results obtained from FACE sites which frequently show that el-evated CO2stimulates photosynthesis in C3plants, with trees showing the largest net
increase in photosynthesis with increasing CO2 exposure (reviewed in Nowak et al.,
5
2004 ; Ainsworth and Long, 2005).
Acclimation or down regulation of photosynthesis is likely to occur in ecological sit-uations where nutrient conditions are low or nitrogen is limiting (Stitt and Krapp, 1999; Sinclair et al., 2000). Nonetheless, even if down regulation is observed photosynthesis is often stimulated in long-term experiments even after 7–10 years of FACE (Nowak
10
et al., 2004). The sampled lodgepole pine stand in this study most likely has been exposed to elevated CO2levels since centuries. We hypothesize that decreased pho-tosynthetic capacity observed in our case could be due to severe reduction in plant available nitrogen in this forest stand due to phenomenon known as progressive nitro-gen limitation (PNL). PNL develops because elevated CO2leads to N immobilization by
15
plants and microbes which deplete soils of N, causing slower rates of N mineralization progressively reducing the mineral N available for plant uptake in the long term (Gill et al., 2002; Zak et al., 2000; Luo et al., 2004).
In this study, the combined use of 14C, δ13C and δ18O values of leaf biomass provided useful insight into the photosynthetic response of a native conifer and a
20
non-native forb to elevated CO2 conditions in Yellowstone National Park. The non-native forb, dalmation toadflax, responded by increasing stomatal conductance with no change in photosynthetic capacity, and the native lodgepole pine by decreasing stom-atal conductance and photosynthetic capacity under elevated atmospheric CO2. The results from our study are in contrast to those from studies conducted in various FACE
25
sites, emphasizing the importance of long-term, high resolution ecosystem-scale CO2
BGD
5, 3825–3843, 2008Effect of elevated CO2 on plants in YNP
S. Sharma and D. G. Williams
Title Page
Abstract Introduction
Conclusions References
Tables Figures
◭ ◮
◭ ◮
Back Close
Full Screen / Esc
Printer-friendly Version
Interactive Discussion Acknowledgements. We thank J. Cable and P. Koenig for field assistance. The project was
funded and supported by a Faculty Development grant from the University of Wyoming Re-search Office and the National Science Foundation – EPSCoR grant EPS-0447681. Radiocar-bon analyses were performed at W. M. Keck AMS Lab at the University of California, Irvine, CA, USA.
5
References
Ainsworth, E. A. and Long, S. P.: What have we learned from fifteen years of Free Air Carbon Dioxide Enrichment (FACE)? A Meta-analytic review of the responses of photosynthesis, canopy properties and plant production to rising CO2, New Phytol., 165, 351–372, 2005. Ainsworth, E. A. and Rogers, A.:The response of photosynthesis and stomatal conductance to 10
rising [CO2]: mechanisms and environmental interactions, Plant Cell Environ., 30, 258–270, 2007.
Barbour, M. M. and Farquhar, G. D.: Relative humidity- and ABA-induced variation in carbon and oxygen isotope ratios of cotton leaves, Plant Cell Environ., 23, 473–485, 2000.
Barbour, M. M., Andrews, T. J., and Farquhar, G. D.: Correlations between oxygen isotope 15
ratios of wood constituents of Quercus and Pinus samples from around the world, Aust. J. Plant Physiol., 28, 335–348, 2001.
Barbour, M. M.: Stable oxygen isotope composition of plant tissue: a review, Funct. Plant Biol., 34, 83–94, 2007.
Bettarini, I., Calderoni, G., Miglietta, F., Raschi, A., and Ehleringer, J.: Isotopic carbon discrim-20
ination and leaf nitrogen content ofErica arboreaL. along a CO2concentration gradient in a CO2spring in Italy, Tree Physiol., 15, 327–332, 1995.
Dang, Q. L. and Cheng, S.: Effects of soil temperature on ecophysiological traits in seedlings of four boreal tree species, Forest Ecol. Manag., 194, 379–387, 2004.
Ehleringer, J. R., Hall, A. E., and Farquhar, G. D.: Stable Isotopes and Plant Carbon-Water 25
Relations, Elsevier, New York, USA, 1993.
Farquhar, G. D., Ehleringer, J. R., and Hubick, K. T.: Carbon isotope discrimination and photo-synthesis, Annu. Rev. Plant Phys., 40, 503–537, 1989.
BGD
5, 3825–3843, 2008Effect of elevated CO2 on plants in YNP
S. Sharma and D. G. Williams
Title Page
Abstract Introduction
Conclusions References
Tables Figures
◭ ◮
◭ ◮
Back Close
Full Screen / Esc
Printer-friendly Version
Interactive Discussion
Water Relations, edited by: Ehleringer, J. R., Hall, A. E., and Farquhar, G. D., Academic Press, San Diego, CA, USA, 47–70, 1993.
Field, C. and Mooney, H. A.: The photosynthesis - nitrogen relationship in wild plants, in: On the Economy of Plant Form and Function, edited by: Givnish, T. J., Cambridge University Press, New York, NY, USA, 25–55, 1986.
5
Field, C. B., Lund, C. P., Chiariello, N. R., and Mortimer, B. E.: CO2effects on the water budget of grassland microcosm communities, Glob. Change Biol., 3, 197–206, 1997.
Gill, R. A., Polley, H. W., Johnson, H. B., Anderson, L. J., Maherali, H., and Jackson, R. B.: Nonlinear grassland responses to past and future atmospheric CO2,, Nature, 417, 279–282, 2002.
10
Grams, T. E. E., Kozovitis, A. R., Haberele, K. H., Matyssek, R., and Dawson, T. E.: Combining
δ13C and δ18O analyses to unravel competition, CO2 and O3 effects on the physiological performance of different-aged trees, Plant Cell Environ., 30, 1023–1034, 2007.
Knapp, A. K., Hamerlynck, E. P., Ham, J. M., and Owensby, C. E.: Responses in stomatal conductance to elevated CO2in 12 grassland species that differ in growth form, Plant Ecol., 15
125, 31–41, 1996.
Lockheart, M. J., Van Bergen, P. F., and Evershed, R. P.: Variations in the stable carbon isotope compositions of individual lipids from the leaves of modern angiosperms: implications for the study of higher land plant-derived sedimentary organic matter, Org. Geochem., 26, 137–153, 1997.
20
Luo, Y., Currie, W., Dukes, J., Finzi, A., Hartwig, U., Hungate, B., McMurtrie, R., Oren, R., Parton, W., Pataki, D., Shaw, M., Zak, D., and Field, C.: Progressive nitrogen limitation of ecosystem responses to rising atmospheric carbon dioxide, BioScience, 54, 731–739, 2004. Miglietta, F., Bettarini, I., Raschi, A., K ¨orner, C., and Vaccari, F. P.: Isotope discrimination and
photosynthesis of vegetation growing in the Bossoleto CO2spring, Chemosphere, 36, 771– 25
776, 1998.
Morgan, J. A., Pataki, D. E., K ¨orner, C., Clark, H., Del Grosso, S. J., Grunzweig, J. M., Knapp, A. K., Knippert, J. B., Nowak, R. S., Parton, W. J., Polley, H. W., and Shaw, M. R.: Water rela-tions in grassland and desert ecosystems exposed to elevated atmospheric CO2, Oecologia, 140, 11–25, 2004.
30
BGD
5, 3825–3843, 2008Effect of elevated CO2 on plants in YNP
S. Sharma and D. G. Williams
Title Page
Abstract Introduction
Conclusions References
Tables Figures
◭ ◮
◭ ◮
Back Close
Full Screen / Esc
Printer-friendly Version
Interactive Discussion
atmospheric – do photosynthetic and productivity data from FACE experiments support early predictions?, New Phytol., 162, 253–280, 2004.
Pataki, D. E., Ellsworth, D. W., King, J. S., Leavitt, S. W., Lin, G., Pendall, E., Siegwolf, R., van Kessel, C., and Ehleringer, J. R.: Tracing changes in ecosystem function under elevated CO2, Bioscience, 53, 805–818, 2003.
5
Scheidegger, Y., Saurer, M., Bahn, M., and Siegwolf, R.: Linking stable oxygen and carbon isotopes with stomatal conductance and photosynthetic capacity: a conceptual model, Oe-cologia, 125, 350–357, 2000.
Schomp, J. M.: Rising atmospheric CO2 concentrations and plant invasion in the northern mixed-grass prairie: an ecophysiological perspective, M.S. thesis, University of Wyoming, 10
Laramie, WY, USA, 2007
Schwarz, P. A., Fahey, T. J., and Dawson, T. E.: Seasonal soil temperature effects on photo-synthesis in red spruce (Picea rubens) saplings, Tree Physiol., 17, 187–194, 1997.
Shangguan, Z. P., Shao, M. A., and Dyckmans, J.: Nitrogen nutrition and water stress effects on leaf photosynthetic gas exchange and water use efficiency in winter wheat, Environ. Exp. 15
Bot., 44, 141–149, 2000.
Sinclair, T. R., Pinter Jr., P. J., Kimball, B. A., Adamsen, F. J., LaMorte, R. L., Wall, G. W., Hun-saker, D. J., Adam, N., Brooks, T. J., Garcia, R. L., Thompson, T., Leavitt, S., and Matthias, A.: Leaf nitrogen concentration of wheat subjected to elevated [CO2] and either water or N deficits, Agr. Ecosyst. Environ., 79, 53–60, 2000.
20
Stitt, M. and Krapp, A.: The interaction between elevated carbon dioxide and nitrogen nutrition: the physiological and molecular background, Plant, Cell Environ., 22, 583–621, 1999. Stuiver, M. and Polach, H. A.: Reporting of14C data, Radiocarbon, 19, 355–363, 1977. Sullivan, P. F. and Welker, J. M.: Variation in leaf physiology of Salix arctica within and across
ecosystems in the High Arctic: test of a dual isotope (∆13C and∆18O) conceptual model, 25
Oecologia, 151, 372–386, 2007.
Tognetti, R., Minnocci, A., Pe ˜nuelas, J., Raschi, A., and Jones, M. B.: Comparative field water relations of three Mediterranean shrub species co-occurring at a natural CO2vent, J. Exp. Bot., 51, 1135–1146, 2000.
van Gardingen, P. R., Grace, J., Harkness, D. D., Miglietta, F., and Raschi, A.: Carbon dioxide 30
emissions at an Italian mineral spring: measurements of average CO2concentration and air temperature, Agr. Forest Meteorol., 73, 17–27, 1995.
BGD
5, 3825–3843, 2008Effect of elevated CO2 on plants in YNP
S. Sharma and D. G. Williams
Title Page
Abstract Introduction
Conclusions References
Tables Figures
◭ ◮
◭ ◮
Back Close
Full Screen / Esc
Printer-friendly Version
Interactive Discussion
of Pinus pinaster, Tree Physiol., 20, 637–643, 2000.
Werner, C. and Brantley, S.: CO2emissions from the Yellowstone volcanic systems, Geochem. Geophys. Geosys., 4, 1–27, 2003.
Wullschleger, S. D., Tschaplinski, T. J., and Norby, R. J.: Plant water relations at elevated CO2 – implications for water-limited environments, Plant Cell Environ., 25, 319–331, 2002. 5
Zak, D. R., Pregitzer, K. S., King, J. S., and Holmes, W. E.: Elevated atmospheric CO2, fine roots and the response of soil microorganisms: a review and hypothesis, New Phytol., 147, 201–222, 2000.
Zhang, S. and Dang, Q. L.: Effects of soil temperature and elevated atmospheric CO2 concen-tration on gas exchange, in vivo carboxylation and chlorophyll fluorescence in jack pine and 10
BGD
5, 3825–3843, 2008Effect of elevated CO2 on plants in YNP
S. Sharma and D. G. Williams
Title Page
Abstract Introduction
Conclusions References
Tables Figures
◭ ◮
◭ ◮
Back Close
Full Screen / Esc
Printer-friendly Version
Interactive Discussion
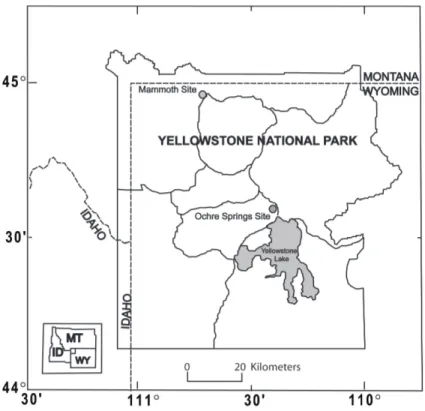
Fig. 1.Map of Yellowstone National Park showing the Ochre Spring and Mammoth Hot Springs
BGD
5, 3825–3843, 2008Effect of elevated CO2 on plants in YNP
S. Sharma and D. G. Williams
Title Page
Abstract Introduction
Conclusions References
Tables Figures
◭ ◮
◭ ◮
Back Close
Full Screen / Esc
Printer-friendly Version
Interactive Discussion
Fig. 2. Correlation between carbon isotope discrimination (∆13C) and average flux-weighted
BGD
5, 3825–3843, 2008Effect of elevated CO2 on plants in YNP
S. Sharma and D. G. Williams
Title Page
Abstract Introduction
Conclusions References
Tables Figures
◭ ◮
◭ ◮
Back Close
Full Screen / Esc
Printer-friendly Version
Interactive Discussion
Fig. 3. Correlation between 13C discrimination (∆13C) and the δ18O of bulk leaf material in
BGD
5, 3825–3843, 2008Effect of elevated CO2 on plants in YNP
S. Sharma and D. G. Williams
Title Page
Abstract Introduction
Conclusions References
Tables Figures
◭ ◮
◭ ◮
Back Close
Full Screen / Esc
Printer-friendly Version
Interactive Discussion
Fig. 4. Nitrogen concentrations of leaf biomass show different relationships over gradients of