ACPD
11, 13575–13616, 2011Source apportionment of
carbonaceous aerosol
J. Genberg et al.
Title Page
Abstract Introduction
Conclusions References
Tables Figures
◭ ◮
◭ ◮
Back Close
Full Screen / Esc
Printer-friendly Version Interactive Discussion
Discussion
P
a
per
|
Dis
cussion
P
a
per
|
Discussion
P
a
per
|
Discussio
n
P
a
per
|
Atmos. Chem. Phys. Discuss., 11, 13575–13616, 2011 www.atmos-chem-phys-discuss.net/11/13575/2011/ doi:10.5194/acpd-11-13575-2011
© Author(s) 2011. CC Attribution 3.0 License.
Atmospheric Chemistry and Physics Discussions
This discussion paper is/has been under review for the journal Atmospheric Chemistry and Physics (ACP). Please refer to the corresponding final paper in ACP if available.
Source apportionment of carbonaceous
aerosol in southern Sweden
J. Genberg1, M. Hyder2, K. Stenstr ¨om1, R. Bergstr ¨om3,4, D. Simpson5,6, E. Fors1, J. ˚A. J ¨onsson2, and E. Swietlicki1
1
Department of Physics, Lund University, P.O. Box 118, 22100, Lund, Sweden
2
Department of Chemistry, Lund University, P.O. Box 124, 22100, Lund, Sweden
3
Department of Chemistry, University of Gothenburg, 41296, Gothenburg, Sweden
4
Swedish Meteorological and Hydrological Institute, 60176, Norrk ¨oping, Sweden
5
EMEP MSC-W, Norwegian Meteorological Institute, P.O. Box 43, 0313, Oslo, Norway
6
Department of Earth & Space Sciences, Chalmers University of Technology, 41296, Gothenburg, Sweden
Received: 8 April 2011 – Accepted: 18 April 2011 – Published: 4 May 2011
Correspondence to: J. Genberg ([email protected])
ACPD
11, 13575–13616, 2011Source apportionment of
carbonaceous aerosol
J. Genberg et al.
Title Page
Abstract Introduction
Conclusions References
Tables Figures
◭ ◮
◭ ◮
Back Close
Full Screen / Esc
Printer-friendly Version Interactive Discussion
Discussion
P
a
per
|
Dis
cussion
P
a
per
|
Discussion
P
a
per
|
Discussio
n
P
a
per
|
Abstract
A one-year study was performed at the Vavihill background station in southern Sweden to estimate the anthropogenic contribution to the carbonaceous aerosol. Weekly sam-ples of the particulate matter PM10 were collected on quartz filters, and the amounts of organic carbon, elemental carbon, radiocarbon (14C) and levoglucosan were
mea-5
sured. This approach enabled source apportionment of the total carbon in the PM10 fraction using the concentration ratios of the sources. The sources considered in this study were emissions from the combustion of fossil fuels and biomass, as well as bio-genic sources. During the summer, the carbonaceous aerosol mass was dominated by compounds of biogenic origin (82 %), which are associated with biogenic primary and
10
secondary organic aerosols. During the winter months, biomass combustion (38 %) and fossil fuel combustion (33 %) were the main contributors to the carbonaceous aerosol. Elemental carbon concentrations in winter were about twice as large as during summer, and can be attributed to biomass combustion, probably from domestic wood burning. The contribution of fossil fuels to elemental carbon was stable throughout
15
the year, although the fossil contribution to organic carbon increased during the winter. Thus, the organic aerosol originated mainly from natural sources during the summer and from anthropogenic sources during the winter. The result of this source apportion-ment was compared with results from the EMEP model. The model and measureapportion-ments were generally consistent for total atmospheric organic carbon, however, the
contribu-20
tion of the sources varied substantially. E.g. the biomass burning contributions of OC were underestimated by the model by a factor of 8.2 compared to the measurements.
1 Introduction
Aerosol particles are known to have adverse effects on human health (Dockery et al., 1993) by affecting not only the respiratory tract, but also the cardiovascular organs
25
ACPD
11, 13575–13616, 2011Source apportionment of
carbonaceous aerosol
J. Genberg et al.
Title Page
Abstract Introduction
Conclusions References
Tables Figures
◭ ◮
◭ ◮
Back Close
Full Screen / Esc
Printer-friendly Version Interactive Discussion
Discussion
P
a
per
|
Dis
cussion
P
a
per
|
Discussion
P
a
per
|
Discussio
n
P
a
per
|
(Andreae et al., 2004). Aerosol composition must, therefore, be taken into considera-tion when modelling changes in the Earth’s climate. However, it is not known in detail how human activities affect aerosol composition, or the degree to which they can alter the climate.
According to aerosol mass spectrometry measurements performed in Europe, the
or-5
ganic aerosol (OA) constitutes a considerable fraction of the submicron particle mass, corresponding to between 30 and 60 % of the aerosol mass, depending on location and season (Jimenez et al., 2009). The large fraction of organic compounds in aerosol particles motivates studies of these compounds because of their adverse effects on our environment. Also, the sources of these particles are highly uncertain and variable
10
(Gelencs ´er et al., 2007; May et al., 2009). Organic aerosols originate mainly from three sources: combustion of fossil fuels, biomass burning and biogenic sources. All these sources can contribute to both primary and secondary organic aerosols (POAs and SOAs). Biogenic POAs consist of pollen and plant debris, fungal spores and microor-ganisms. Biogenic SOAs originate from volatile organic compounds (VOCs) emitted by
15
plants, e.g. monoterpenes. The emission of biogenic VOCs is related to the growing season and temperature, and is significantly greater during the warmer months of the year (Zemankova and Brechler, 2010). Primary fossil-fuel-based emissions from traffic and industry contribute to organic aerosols, as do secondary particles arising from the emission of fossil-based VOCs. Biomass burning, e.g. forest fires, is common during
20
dry periods and is a large contributor to aerosol particles globally (Crutzen and An-dreae, 1990) and occasionally in Nordic areas (Saarikoski et al., 2008). The burning of biomass for domestic heating is also a major source of particles, especially in South Asia (Gustafsson et al., 2009), but also in some European cities e.g. Zurich (Switzer-land), where approximately 65 % of the winter carbonaceous aerosol has been found to
25
ACPD
11, 13575–13616, 2011Source apportionment of
carbonaceous aerosol
J. Genberg et al.
Title Page
Abstract Introduction
Conclusions References
Tables Figures
◭ ◮
◭ ◮
Back Close
Full Screen / Esc
Printer-friendly Version Interactive Discussion
Discussion
P
a
per
|
Dis
cussion
P
a
per
|
Discussion
P
a
per
|
Discussio
n
P
a
per
|
The carbonaceous aerosol consists of numerous compounds with different chemical and physical properties. The total carbon content (TC) is divided into organic car-bon (OC) and elemental carcar-bon (EC). The organic carcar-bon fraction includes organic molecules and polymers, e.g., cellulose, alkanes and organic acids, which do not ab-sorb visible light. EC consists of compounds with graphite-like structures formed during
5
combustion, e.g. char and soot, which can absorb light (P ¨oschl, 2005). This means that EC has important climate impact, as light-absorbing particles in the atmosphere lead to a warmer climate (Ramanathan and Carmichael, 2008; Menon et al., 2002). The split of combustion products into OC and EC is, however, not clear as they form a con-tinuum from OC to EC (Masiello, 2004). With higher combustion temperatures, carbon
10
compounds generally become more light absorbing and less reactive, all properties of EC. Numerous methods of separating OC from EC by thermal analysis have been proposed (Cachier et al., 1989; Fung, 1990). These methods utilise the difference in thermal stability between OC and EC. However, during the analysis, some organic compounds char due to heating and form “false” EC. This can be corrected for by
mon-15
itoring the transmission of a laser beam through the filter sample during heating. The NIOSH protocol (Birch and Cary, 1996) uses this transmission method which is also the basis for the protocol developed within the EU-funded project EUSAAR (European Supersites for Atmospheric Aerosol Research) (Cavalli et al., 2010).
Radiocarbon (14C) is a powerful tracer for modern carbon. With a half-life of 5730 yr,
20
14
C is depleted in fossil fuels while present at traceable amounts in carbon from con-temporary sources. The amount of14C in a sample can therefore be used to determine the fractions of carbon with modern and fossil origin. However, the method is compli-cated by the release of14C from detonations of thermonuclear weapons in the 1950s and 1960s (the bomb effect, Levin and Hesshaimer, 2000), as well as dilution of
at-25
ACPD
11, 13575–13616, 2011Source apportionment of
carbonaceous aerosol
J. Genberg et al.
Title Page
Abstract Introduction
Conclusions References
Tables Figures
◭ ◮
◭ ◮
Back Close
Full Screen / Esc
Printer-friendly Version Interactive Discussion
Discussion
P
a
per
|
Dis
cussion
P
a
per
|
Discussion
P
a
per
|
Discussio
n
P
a
per
|
burning carbonaceous aerosol contain14C, it is difficult to separate these two sources by relying solely on carbon isotope measurements. The tracer molecule levoglucosan can however be used to determine whether the particles originate from the burning of biomass, as it is formed when cellulose is heated to above 300◦
C. For the purpose of this study, it was considered to be atmospherically stable, although this is still being
5
debated (Locker, 1988; Fraser and Lakshmanan, 2000; Hoffmann et al., 2010).
In this study, 51 aerosol samples collected in southern Sweden over one year were analysed to determine the concentrations of 14C, levoglucosan, EC and OC. These measurements were combined to provide the first full-year source apportionment of the carbonaceous aerosol in Sweden. The measurement based source
apportion-10
ment results for OC were compared with corresponding results from the EMEP MSC-W chemical transport model. This is an important step to evaluate how well the OA models and their input data represent the measurements.
2 Methods
2.1 Sampling
15
The sampling site Vavihill is a EUSAAR and EMEP (European Monitoring and Evalua-tion Programme) background staEvalua-tion situated in southern Sweden (56◦01′N, 13◦09′E, 172 m a.s.l.). The station is not close to any large local pollution sources, although the distances to the densely populated areas of Malm ¨o, Copenhagen and Helsingborg, west to southwest of the station, are only 45, 50 and 25 km, respectively. Continental
20
Europe in the south also influences the air at Vavihill, whereas air masses from the north and northeast are generally clean (Kristensson et al., 2008).
Samples were collected weekly between April 2008 and April 2009. The PM10 frac-tion was collected on 47 mm quartz filters (Pall Tissuquartz™, binder-free) using an aerosol flow of 38 L min−1. The filters were baked at 900◦C for 4 h prior to sampling.
25
ACPD
11, 13575–13616, 2011Source apportionment of
carbonaceous aerosol
J. Genberg et al.
Title Page
Abstract Introduction
Conclusions References
Tables Figures
◭ ◮
◭ ◮
Back Close
Full Screen / Esc
Printer-friendly Version Interactive Discussion
Discussion
P
a
per
|
Dis
cussion
P
a
per
|
Discussion
P
a
per
|
Discussio
n
P
a
per
|
refrigerator (+8◦C) or a freezer (−30◦C). Samples were generally analysed for OC
and EC within 12 weeks of sampling. 14C and levoglucosan analyses were conducted within two years of sampling.
Most of the samples were collected using the EUSAAR sampling train, consisting of two filters in series following a VOC denuder in order to remove VOCs. Some samples
5
were collected without the use of the denuder and therefore the OC values had to be corrected for positive artefacts due to adsorbed VOCs. Samples collected with the denuder were not corrected for positive or negative artefacts since the back-filter loadings were close to that of the field blanks, indicating that the artefacts were low. These back-filter results also demonstrate that storage of the filters did not lead to any
10
significant positive artefacts. Two tests were performed at Vavihill to determine the denuder efficiency in order to estimate positive artefacts; one in February 2008 and one in August 2008. Samples were collected simultaneously in three sampling lines: one with both a denuder and a Teflon filter in front of two quartz filters, one with only a Teflon filter in front of two quartz filters, and one with two quartz filters without a denuder
15
or a Teflon filter. The results from these samples were in this study used to evaluate the magnitude of the positive artefacts on samples collected without a denuder.
2.2 OC/EC analysis
OC/EC analyses were conducted on a 0.5 cm2 area of the filter using a DRI Model 2001 OC/EC Carbon Analyzer (Atmoslytic, Calabasas, CA, USA). The organic and
20
elemental carbon fractions were separated according to a novel method developed within the framework of the EUSAAR project called the EUSAAR 2 protocol. This was developed to reduce measurement uncertainty in aerosol samples from background sites around Europe (Cavalli et al., 2010). According to the EUSAAR protocol, the filter sample is heated in helium in four steps to 650◦C. The filter is then left to cool to
25
ACPD
11, 13575–13616, 2011Source apportionment of
carbonaceous aerosol
J. Genberg et al.
Title Page
Abstract Introduction
Conclusions References
Tables Figures
◭ ◮
◭ ◮
Back Close
Full Screen / Esc
Printer-friendly Version Interactive Discussion
Discussion
P
a
per
|
Dis
cussion
P
a
per
|
Discussion
P
a
per
|
Discussio
n
P
a
per
|
value, i.e. the value of the start of the analysis, the carbon left on the filter is regarded as EC.
2.3 14C determination
The 14C content in the aerosol samples was analysed using accelerator mass spec-trometry. Prior to analysis, the carbon was extracted using a newly implemented
5
graphitisation system optimised for µg-sized samples (Genberg et al., 2010). Briefly, the sample is combusted in vacuum using CuO as oxidation agent. The CO2formed is cryogenically purified and mixed with H2 in a small-volume reduction reactor, and thereafter heated to 600◦C. In the reaction, the CO2 is transformed into pure graphite on a heated iron catalyst. The14C/12C ratio in the graphite is analysed using the 250 kV
10
single-stage accelerator mass spectrometer at Lund University (Skog, 2007; Skog et al., 2010) and expressed as fraction modern (F14C) (Reimer et al., 2004). A F14C value of 1.0 is equivalent to the hypothetical concentration of14C in atmospheric carbon from 1950 when human influences are not taken into account. The true atmospheric14C concentration has however been altered due to emissions of fossil CO2(Suess effect)
15
and formation of14C from thermonuclear weapons (bomb effect).
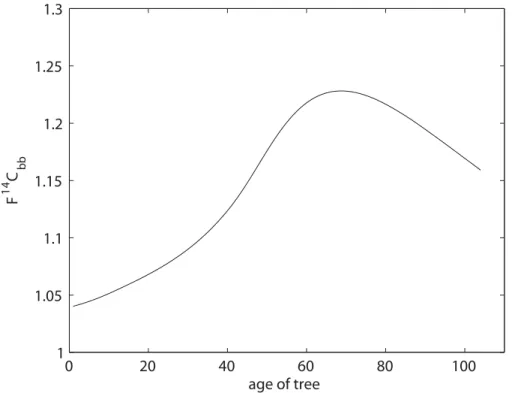
Due to the Suess and bomb effect F14C values had to be deduced for the different modern sources of carbon (biogenic and biomass). For biogenic emissions a value of F14C=1.04 was used, taken from measurements performed by Levin in 2007 (Levin, 2008). It is complicated to determine the F14C of biomass burning (F14Cbb) since the
20
trees used as firewood in Sweden today were growing during the 1960s, when the amount of14C in the atmosphere was up to twice that of today (Levin and Hesshaimer, 2000). We used the method described by Lewis et al. (2004) to model the amount of14C accumulated in trees. The method uses the Chapman–Richards growth model (Richards, 1959) to simulate the growth of the tree, and atmospheric 14C
concentra-25
ACPD
11, 13575–13616, 2011Source apportionment of
carbonaceous aerosol
J. Genberg et al.
Title Page
Abstract Introduction
Conclusions References
Tables Figures
◭ ◮
◭ ◮
Back Close
Full Screen / Esc
Printer-friendly Version Interactive Discussion
Discussion
P
a
per
|
Dis
cussion
P
a
per
|
Discussion
P
a
per
|
Discussio
n
P
a
per
|
2.4 Levoglucosan analysis
Levoglucosan was analysed using the method of Zdrahal et al. (2002) with some mod-ifications. A filter sample, 1 cm2, was further divided into small pieces and placed in a 50 mL conical Pyrex flask. Fifteen mL of a solvent mixture of dichloromethane and methanol (3:1) was added to the flask. Extraction was carried out for 45 min in a
Bran-5
son 3200 sonicator (Branson, Danbury, CT, USA). The extract was collected, and two separate aliquots of 10 mL of the dichloromethane:methanol mixtures were added for re-extraction for 30 and 15 min. The extract was pooled and concentrated to dryness by evaporation at 60◦C under a gentle stream of N2. Dichloromethane (CH2Cl2) was added to the solid material remaining, to a volume of 1 mL.
10
Fifty µL of the extract solution and 5 µL DTE (1,4-dithioerythritol, 0.5 µg mL−1, 99 %
pure, Sigma-Aldrich) were placed in a gas chromatography vial and evaporated to dry-ness under a stream of nitrogen at 60◦C. Thirty µL pyridine (99.5 % purity, Acros Organ-ics) and 10 µL N-methyl-N-(trimethylsilyl)trifluoroacetamide (MSTFA,≥98 % excluding
trimethylsilyl chloride, Acros Organics) containing 1 % trimethylsilyl chloride was added
15
to the vial. The vial was sealed with a screw cap with Teflon septa. Derivatisation was carried out at 80◦C for one hour, after which the sample was allowed to cool to room temperature. The solution containing derivatised levoglucosan was evaporated to dry-ness at 60◦C under a continuous flow of nitrogen, and thereafter dissolved in 50 µL dichloromethane containing 5 µg mL−11-phenyldodecane (97 % Acros Organics,
inter-20
nal standard).
Samples were analysed using an Agilent 6890 series gas chromatograph with an Agilent 5973 network mass detector. The column used was Varian VF-1ms (30 m×0.32 mm ID 0.25). The injection volume was 2 µL, and splitless injection was used. The inlet temperature was 280◦C and constant flow mode was used. The gas
25
ACPD
11, 13575–13616, 2011Source apportionment of
carbonaceous aerosol
J. Genberg et al.
Title Page
Abstract Introduction
Conclusions References
Tables Figures
◭ ◮
◭ ◮
Back Close
Full Screen / Esc
Printer-friendly Version Interactive Discussion
Discussion
P
a
per
|
Dis
cussion
P
a
per
|
Discussion
P
a
per
|
Discussio
n
P
a
per
|
of 30◦
C min−1 (Hsu et al., 2007). The MSD transfer line temperature was 280◦ C, the MS source temperature was 250◦C, and the MS quadropole temperature was 180◦C. Levoglucosan was identified by comparison with the mass spectrum and retention time of standards, and quantified using selected-ion monitoring. The amount of levoglu-cosan was quantified usingm/z=217, and 1-phenyldodecane (internal standard) using
5
m/z=246. Standards were prepared using 99 % pure 1,6-anhydro-β-glucopyranose (Alfa Aesar).
2.5 Source apportionment method
To model the origin of the carbon fractions, the carbon was assumed to originate from one of three sources: biogenic emissions, biomass burning and combustion of fossil
10
fuels. These are the same sources as those used by Szidat et al. (2006). The total carbon (TC) content is divided into OC and EC:
TC=EC+OC (1)
EC is determined as the sum of elemental carbon arising from biomass burning (ECbb) and fossil fuel combustion (ECff):
15
EC=ECff+ECbb (2)
ECbb is calculated using the measured levoglucosan concentration (lev) and the esti-mated ratio of ECbb/lev:
ECbb=lev·ECbb
lev =lev·
EC OC
bb
lev OCbb
(3)
The ratio ECbb/lev is determined using two ratios from earlier studies (Sect. 2.6):
20
ACPD
11, 13575–13616, 2011Source apportionment of
carbonaceous aerosol
J. Genberg et al.
Title Page
Abstract Introduction
Conclusions References
Tables Figures
◭ ◮
◭ ◮
Back Close
Full Screen / Esc
Printer-friendly Version Interactive Discussion
Discussion
P
a
per
|
Dis
cussion
P
a
per
|
Discussion
P
a
per
|
Discussio
n
P
a
per
|
OC is separated into three sources: biomass burning (OCbb), non-fossil OC (OCbio) and OC originating from fossil fuels (OCff):
OC=OCbb+OCbio+OCff (4)
OCbb includes primary particles emitted from forest fires and agricultural clearing, as well as domestic wood burning and is based on the formation of levoglucosan when
5
cellulose is heated during the combustion. OCbio in this study includes both primary and secondary biogenic particles, as well as secondary particles formed from other non-fossil sources, i.e. SOA originating from biomass burning.
OCbb is calculated using the levoglucosan levels and the lev/OCbbratio, which yields the organic primary particle emission from biomass burning:
10
OCbb=lev
lev
OCbb (5)
Since levoglucosan is not an ideal quantitative tracer, and the lev/OCbb ratio is uncer-tain, as will be discussed in Sect. 2.6, the value of OCbb was limited in two ways in the calculations. Firstly, it was not allowed to exceed the total OC. Secondly, it was limited by the radiocarbon measurement in order not to introduce so much OCbb that
15
the14C level could not be balanced by OCff. The maximum amount of OC originating from biomass burning (OCbbmax) corresponds to the amount of OC needed to allocate all14C in the OC fraction to biomass burning:
OCbb
max=OC·
F14COC F14C
bb
(6)
F14COC is calculated from the measured 14C concentration in the sample (F14CTC),
20
OC/EC measurements, and the levoglucosan value:
F14COC=F 14
CTC·TC−F14CEC·EC
ACPD
11, 13575–13616, 2011Source apportionment of
carbonaceous aerosol
J. Genberg et al.
Title Page
Abstract Introduction
Conclusions References
Tables Figures
◭ ◮
◭ ◮
Back Close
Full Screen / Esc
Printer-friendly Version Interactive Discussion
Discussion
P
a
per
|
Dis
cussion
P
a
per
|
Discussion
P
a
per
|
Discussio
n
P
a
per
|
In Eq. (7), F14CECis determined by the relative contribution of biomass burning to EC:
F14CEC=F14Cbb·ECbb
EC (8)
F14Cbb is the14C concentration in wood smoke, modelled using the method described by Lewis et al. (2004) as described above (Sect. 2.3). The value of F14COCis, however, close to the value of F14CTCsince OC is the dominant contributor to the total carbon.
5
OCbio is calculated by balancing the 14C content which was not attributed to OCbb (Eq. 5):
OCbio=OC·F
14
COC−OCbb·F14Cbb F14C
bio
(9)
F14Cbio is the 14C concentration of the atmosphere and is set to 1.04 (Levin, 2008). The remaining OC is considered to originate from fossil fuels (OCff) and is obtained by
10
subtraction (Eq. 4).
2.6 Sensitivity analysis
Some of the variables in Eqs. (1–9) are measured and some are taken from the liter-ature, all with uncertainties. To evaluate the effect of the uncertainties of the different variables on the outcome of source apportionment, a random sampling model (McKay
15
et al., 1979) inspired by the Latin hypercube sampling method (Gelencs ´er et al., 2007) was used. All variables were allowed to vary within a set distribution, and calculations were performed with 3000 random sets of variables. The median value was considered the best estimate since the mean value may be affected by the use of limitations in the calculations (Eqs. 3 and 5).
20
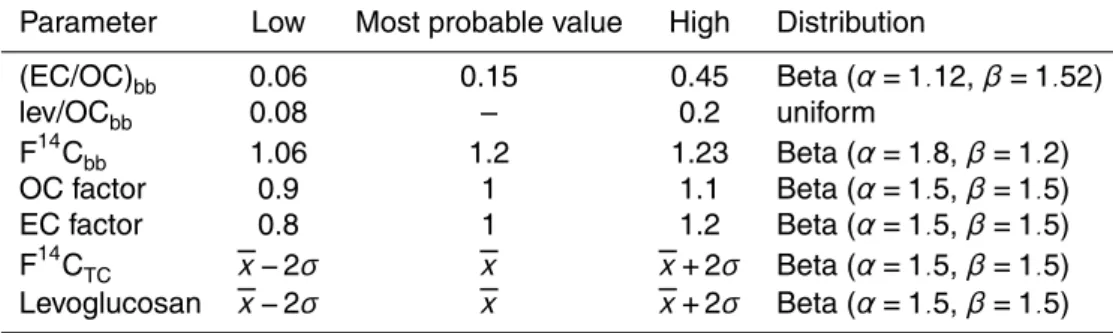
The measurements of14C concentration (F14C) and levoglucosan used in the equa-tions were allowed to vary by ±2 standard deviations in a broad beta distribution (α=1.5,β=1.5). OC and EC measurements were varied by ±10 and 20 %,
ACPD
11, 13575–13616, 2011Source apportionment of
carbonaceous aerosol
J. Genberg et al.
Title Page
Abstract Introduction
Conclusions References
Tables Figures
◭ ◮
◭ ◮
Back Close
Full Screen / Esc
Printer-friendly Version Interactive Discussion
Discussion
P
a
per
|
Dis
cussion
P
a
per
|
Discussion
P
a
per
|
Discussio
n
P
a
per
|
resulting from biomass combustion was modelled according to Lewis et al. (2004), as described in Sect. 2.3. In Sweden, forests are normally clear cut at an age of 60 to 80 yr, rendering an F14Cbb value of 1.21 to 1.23 for the majority of the fire wood. However, fire wood used for domestic burning (which normally has less effective com-bustion) may be derived from thinning of the forest, which provides younger firewood
5
(20–30 yr), and therefore lower F14Cbb values (1.06 to 1.09). To cover this variation in age a broad beta distribution of F14Cbb was used (α=1.8,β=1.2). This distribu-tion slightly favours the higher values to emphasize the higher values as most of the firewood used belongs to the older category.
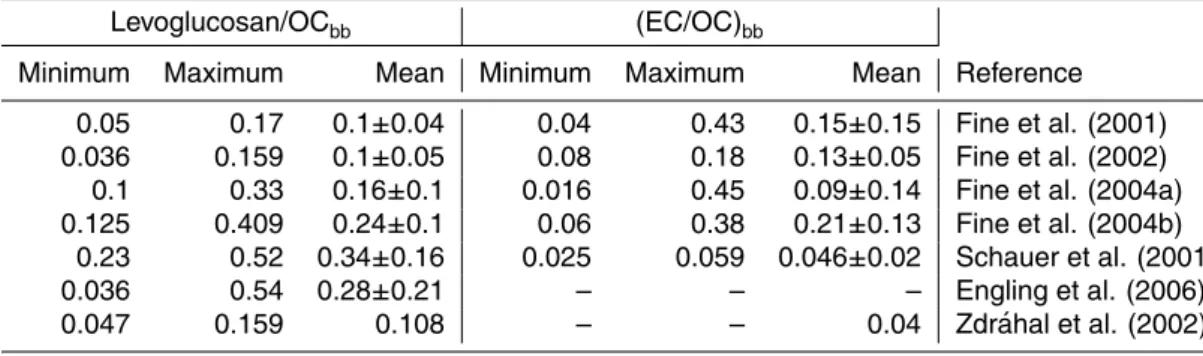
The ratios of levoglucosan to OCbb and ECbbto OCbbare dependent on the type of
10
wood being burnt and the burning conditions (Oros and Simoneit, 2001a, b), which vary in the south of Sweden (and throughout Europe). Both ratios have been investigated for numerous types of wood fuels used in the US (Fine et al., 2001, 2002, 2004a, b; En-gling et al., 2006). The results from these studies, together with the results presented by Zdr ´ahal et al. (2002) are presented in Table 1. The values reported by Zdr ´ahal et al.
15
are from measurements in Brazil during the dry season, where most of the particulate carbon is presumed to originate from biomass burning.
Similar investigations have been performed in order to determine the best values for these ratios. Szidat (2006) concluded that suitable values of the levoglucosan/OCbb and (EC/OC)bb ratios were 0.15±0.09 and 0.16±0.05, respectively, while Gelencs ´er
20
et al. (2007) used 0.08–0.167 for levoglucosan/OCbb and 0.07–1.0 for (EC/OC)bb. Puxbaum et al. (2007) used 0.136 for levoglucosan/OCbbratio after having undertaken an extensive literature survey. The ratios and distributions used in the present study for the sensitivity analysis are presented in Table 2. A uniform distribution between 0.08 and 0.2 was used as the value for the levoglucosan/OCbb ratio, which covers most of
25
ACPD
11, 13575–13616, 2011Source apportionment of
carbonaceous aerosol
J. Genberg et al.
Title Page
Abstract Introduction
Conclusions References
Tables Figures
◭ ◮
◭ ◮
Back Close
Full Screen / Esc
Printer-friendly Version Interactive Discussion
Discussion
P
a
per
|
Dis
cussion
P
a
per
|
Discussion
P
a
per
|
Discussio
n
P
a
per
|
(Table 1, 0.06–0.45) were used in a broad beta distribution (α=1.12,β=1.52), which slightly favours the lower values with a maximum probability of 0.15.
2.7 Source apportionment model of OC
The calculated sources based on measurements were compared with modelled sources apportionment of OC from the same time periods. A recently developed
par-5
ticulate carbonaceous matter (PCM) version of the EMEP MSC-W chemical transport model (Simpson et al., 2007, 2011) was used. The EMEP PCM model includes an organic aerosol scheme based on the Volatility Basis Set (VBS) approach (Donahue et al., 2006).
The emitted fossil fuel POA is distributed over different volatilities (9-bin VBS) and
10
partitions between the gas and particulate phases. The emissions are assumed to be accompanied by emissions of low-vapour pressure (that is, partitioning) gases, which are currently not captured in either the POA or the VOC inventories. Following Shri-vastava et al. (2008) the total emissions of condensable material (including POA) are assumed to amount to 2.5 times the POA inventory.
15
Both POA and anthropogenic SOA undergo gas phase reactions with OH (aging) and each reaction leads to a shift of the reacting OA to a lower volatility bin (kOH-POA=
4×10⁻¹¹cm3molecule−1s−1,kOH-ASOA=10−11cm3molecule−1s−1, based on Murphy and Pandis, 2009).
Primary organic aerosol emissions were taken from the EUCAARI anthropogenic
20
carbonaceous aerosol emission inventory (Visschedijk et al., 2009). Other anthro-pogenic emissions are taken from the standard EMEP emission inventory (Mareckova et al., 2009). Biogenic emissions of isoprene and monoterpenes are based on Guen-ther et al. (1993) and Simpson et al. (1999). A background concentration of 0.5 µg m−3 of biogenic OC is included in the model. This represents sources of OC not directly
in-25
ACPD
11, 13575–13616, 2011Source apportionment of
carbonaceous aerosol
J. Genberg et al.
Title Page
Abstract Introduction
Conclusions References
Tables Figures
◭ ◮
◭ ◮
Back Close
Full Screen / Esc
Printer-friendly Version Interactive Discussion
Discussion
P
a
per
|
Dis
cussion
P
a
per
|
Discussion
P
a
per
|
Discussio
n
P
a
per
|
3 Results and discussion
3.1 Positive artefact correction
Most of the samples analysed in this study were collected with a denuder in front of two quartz filters. This set-up was considered artefact-free in this study, despite the fact that some positive artefacts have been found during the EUSAAR project (Putaud et
5
al., 2010). The denuder tests conducted at Vavihill indicate a denuder efficiency of 90 to 95 %. The results from parts of the Vavihill denuder tests are presented in Table 3. The back quartz filter loading on the line without a Teflon filter corresponds well to the loading of the back filter behind Teflon collected simultaneously. This demonstrates that the positive artefact is not affected by the Teflon filter. Samples where denuders were
10
not used were corrected by using the carbon found on the back filter in accordance with the results of tests carried out in the winter and summer of 2008 (Table 3). Cheng et al. (2009), found that correcting by a factor of one times the amount of carbon on the back filter was inadequate compared with a denuded quartz filter sample. In this study a correction factor of 2.16 was used. However, the measurements range from 1.85
15
to 2.61 (and one outlier at 3.84 according to Grubb’s test (P <0.05)). No significant difference was observed between the two seasons, thus all the samples were corrected using the same factor. The correction was only conducted on the OC values and not to the corresponding F14C values. The F14C of the positive artefacts were assumed to be equal to the F14C of the OC fractions.
20
3.2 OC/EC results
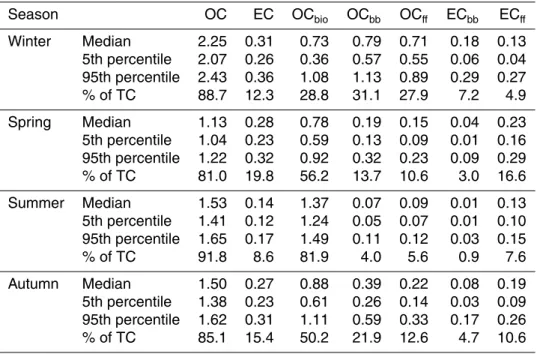
The filter analyses of OC and EC show that both fractions increased in concentration during winter compared with the summer (Fig. 2). The seasons were determined by fitting a line to daily mean temperature. Summer and winter were determined as the period where the line was above 10◦C and below 0◦C, respectively (Table 4). Spring
25
ACPD
11, 13575–13616, 2011Source apportionment of
carbonaceous aerosol
J. Genberg et al.
Title Page
Abstract Introduction
Conclusions References
Tables Figures
◭ ◮
◭ ◮
Back Close
Full Screen / Esc
Printer-friendly Version Interactive Discussion
Discussion
P
a
per
|
Dis
cussion
P
a
per
|
Discussion
P
a
per
|
Discussio
n
P
a
per
|
EC in the winter was twice that in the summer (0.15 µg m−3 vs. 0.3 µg m−3), which is
significant (P <0.001). The amount of OC was higher during the winter (P <0.1), and the top value was recorded at the beginning of February 2009 (4.4 µg OC m−3). As can be seen in Fig. 2, the EC concentration increased already in October, and remained stable throughout the autumn and most of the winter. The OC concentration, on the
5
other hand, was fairly stable before it peaked in a few samples collected in January and February 2009.
3.3 14C and levoglucosan results
The concentration of14C in the organic aerosol during the summer was generally high, as can be seen in Fig. 3a. A 14C concentration between 0.9 and 1.0, expressed as
10
F14C, means that most of the carbon is of modern origin, i.e. biogenic sources or biomass burning. The simultaneously low levoglucosan concentrations (2–12 ng m−3) (Fig. 3b) imply that the effect of biomass burning was very low, from which it can be concluded that biogenic sources dominated during the summer. The amounts of lev-oglucosan in the summer were lower compared to summer measurements in Norway
15
(Yttri et al., 2007, 2011).
During the winter months, the amount of levoglucosan in the air peaked at more than ten times the concentration found during the summer. At the same time, the14C content in TC decreased to between 0.7 and 0.8 expressed as F14C. These two observations suggest that the influence of both fossil fuel and biomass burning is increased during
20
winter. The wintertime concentrations of levoglucosan at Vavihill are similar to what has been reported for Norwegian urban samples collected during the winter (Yttri et al., 2011) but low compared to urban background samples (Yttri et al., 2009).
3.4 Best estimate source apportionment
The calculations were performed 3000 times for each filter sample, as explained in
25
ACPD
11, 13575–13616, 2011Source apportionment of
carbonaceous aerosol
J. Genberg et al.
Title Page
Abstract Introduction
Conclusions References
Tables Figures
◭ ◮
◭ ◮
Back Close
Full Screen / Esc
Printer-friendly Version Interactive Discussion
Discussion
P
a
per
|
Dis
cussion
P
a
per
|
Discussion
P
a
per
|
Discussio
n
P
a
per
|
those simulations. Then discussing seasonal concentrations the mean of the given season’s medians are used. The results outlined above (Sects. 3.2 and 3.3) are con-firmed by the best estimates, as can be seen in Fig. 4 where the seasonal sources of OC and EC are presented. The results of the sensitivity analysis are presented in Figs. 5 and 6, and will be discussed further in Sect. 3.5.
5
3.4.1 Biomass burning contribution to TC
Biomass burning only contributes slightly to the organic aerosol during the summer (<5 %), while it is the major contributor during the winter, accounting for an average of 38 % of TC (Fig. 4 and Table 5). The absolute contribution of biomass burning to TC is on average about 1 µg m−3during winter (Table 5). This is low compared to results from
10
Norwegian suburban and urban background stations (Yttri et al., 2009), the Hungarian continental site K-Puszta (May et al., 2009) and the Portuguese site Aveiro (Gelencs ´er et al., 2007).
3.4.2 Fossil contribution to TC
The contribution to the carbonaceous aerosol from fossil fuels is lower during the
sum-15
mer than in the winter, while EC resulting from fossil fuel combustion is rather stable throughout the year (Table 5). This leads to a varying OC/EC ratio of the fossil carbon from approximately 1 in the summer to>5 in the winter. This could be explained by the lower temperature in the winter altering the gas-particle equilibrium and thus suggests that a larger portion of the fossil OC during winter is secondary aerosol. It could also
20
indicate a seasonal change in fossil fuel sources of the organic aerosol over the year. In this study, no method to distinguish between different fossil sources was applied.
The determination of fossil influence on TC is relying on the14C concentration of the sample. The lower F14C found in the winter cannot be interpreted as anything else but increased influence by fossil fuels.
ACPD
11, 13575–13616, 2011Source apportionment of
carbonaceous aerosol
J. Genberg et al.
Title Page
Abstract Introduction
Conclusions References
Tables Figures
◭ ◮
◭ ◮
Back Close
Full Screen / Esc
Printer-friendly Version Interactive Discussion
Discussion
P
a
per
|
Dis
cussion
P
a
per
|
Discussion
P
a
per
|
Discussio
n
P
a
per
|
3.4.3 Biogenic contribution to TC
OCbio is, as expected, higher during summer than in winter. In the summer, 82 % of the total carbon in the organic aerosol is of non-fossil origin, and is due to SOA from biogenic VOCs and primary particles, e.g. pollen. However, even in the coldest months, the model attributes on average 29 % of TC to biogenic sources. There may be several
5
reasons why biogenic OC is found during the winter when most plants in Sweden are dormant. One reason could be long-range transport of biogenic SOAs or VOCs from the European continent, where VOCs are emitted during the winter months. However, the winter emission of monoterpene in central Europe is estimated to be only about 20 % of the summer peak (Zemankova and Brechler, 2010), and therefore emissions
10
alone cannot fully explain why the biogenic organic aerosol in southern Sweden during the winter is one third of the summer concentration. Increased condensation may be a factor, with colder temperature driving the semivolatile organic compounds (SVOCs) into the particle phase. Such a possibility was demonstrated by (Simpson et al., 2007) but as noted there, there are too few measurements to verify or falsify such effects.
15
Another explanation could be that the source apportionment method used here does not separate secondary OC form by precursors emitted by biomass burning from non-anthopogenic sources of OCbio. Some of the carbon, which according to the model originates from biogenic sources, may thus be SOA formed from VOCs emitted by the burning of wood or biofuels e.g. ethanol combustion. This would further increase the
20
effect of biomass burning on the organic aerosol mass loading during the winter.
3.4.4 Results of the sensitivity analysis
Figure 5 shows the results of the sensitivity analyses for four samples representing the four seasons. Each source of carbon in the sample is illustrated as a probability distribution. The lines represent the contribution of each of the sources to TC in that
25
ACPD
11, 13575–13616, 2011Source apportionment of
carbonaceous aerosol
J. Genberg et al.
Title Page
Abstract Introduction
Conclusions References
Tables Figures
◭ ◮
◭ ◮
Back Close
Full Screen / Esc
Printer-friendly Version Interactive Discussion
Discussion
P
a
per
|
Dis
cussion
P
a
per
|
Discussion
P
a
per
|
Discussio
n
P
a
per
|
most uncertain parameters, lev/OCbb and (EC/OC)bb, are being used (Table 2). Both these parameters are dependent on the burning conditions and the type of biomass in question, as discussed in Sect. 2.6. The highly uncertain source apportionment of EC can be seen in the winter sample in Fig. 5a where fossil sources are estimated to contribute to between 0 to almost 100 % of EC. The use of levoglucosan as a tracer
5
for biomass combustion is also affected by its atmospheric stability. In a recent pub-lication, the modelled chemical half-life for levoglucosan was found to be between 72 and 84 h in winter conditions (Hoffmann et al., 2010). This estimate is lower than val-ues reported earlier (Locker, 1988; Fraser and Lakshmanan, 2000), which indicates a further uncertainty in source apportionment based on levoglucosan. More reliable
10
data would be obtained if14C analyses could be performed on the pure EC fractions of the samples. In this study, the OC and EC were not separated prior to14C analysis, although this has been done in earlier studies (Szidat et al., 2004, 2006). Separating OC and EC has the advantage that the EC resulting from biomass burning is not de-pendent on the levoglucosan values. It also allows the OC from biomass burning to
15
be calculated from both levoglucosan values and the (OC/EC)bb ratio. The consider-able uncertainty in source apportionment during periods with high levoglucosan values demonstrates the importance of separating OC and EC prior to14C analysis. However, no reliable technique for this separation was available at the time of this study. During periods of low levoglucosan concentrations, e.g. the summer sample in Fig. 5c, the
20
source apportionment uncertainty is much smaller, which shows the low uncertainty in the non-biomass burning related factors used in the calculations.
Figure 6 shows the result of the total sensitivity analysis where the best estimates (median values) are presented as filled diamonds and the error bars represent 5th and 95th percentiles of the simulation results. As shown in Fig. 5, the uncertainties of all
25
ACPD
11, 13575–13616, 2011Source apportionment of
carbonaceous aerosol
J. Genberg et al.
Title Page
Abstract Introduction
Conclusions References
Tables Figures
◭ ◮
◭ ◮
Back Close
Full Screen / Esc
Printer-friendly Version Interactive Discussion
Discussion
P
a
per
|
Dis
cussion
P
a
per
|
Discussion
P
a
per
|
Discussio
n
P
a
per
|
3.5 Model comparison
The calculated sources of OC were compared with results from the EMEP PCM model (Fig. 7). The modelled total OC and the measurements of OC coincide well allthough the model tends to underestimate the OC, especially for winter and autumn (Fig. 7a).
The model underestimates the biomass burning OC by a factor of about eight
com-5
pared to the measurements, as an average for the whole year (Fig. 7b). This large underestimation is especially important for the winter samples where levoglucosan lev-els, and thus biomass burning OC, are high. The underestimation can be due to large-scale problems in the emission inventory or to some local wood-burning activities near the measurement site, which are not captured in the regional scale EMEP model. The
10
biofuel emission factors, used in the emission inventory, are much lower for Sweden than for the neighbouring countries (Nielsen et al., 2010). This discrepancy can partly explain the model’s underestimation of total OC during winter and autumn.
Similar problems, with too low modelled biomass burning OC, were found by Simp-son et al. (2007) for other sites in Europe. Like SimpSimp-son et al. (2007), we have
in-15
vestigated the possible importance of improving the wood-burning emission estimate by making a simple rescaling of the modelled biomass burning OC, using the yearly average ratio between observed and modelled concentrations (i.e. increasing the mod-elled biomass burning OC by a factor of 8.2), and looked at the impact on total OC (Fig. 8). Without rescaling, the model underestimates total OC by about 27 % and the
20
correlation coefficient between observed and modelled OC is low (r=0.36). Rescaling the modelled biomass burning OC leads to a small bias for total OC (+0.2 %) and also better correlation (r =0.59). This suggests that improvements in the national wood burning emission inventory may be an important step towards more accurate mod-elling of carbonaceous aerosol. Measurements at other sites, and higher resolution
25
modelling, are needed to determine if the emission estimates are too low in general or if it is a local scale problem.
ACPD
11, 13575–13616, 2011Source apportionment of
carbonaceous aerosol
J. Genberg et al.
Title Page
Abstract Introduction
Conclusions References
Tables Figures
◭ ◮
◭ ◮
Back Close
Full Screen / Esc
Printer-friendly Version Interactive Discussion
Discussion
P
a
per
|
Dis
cussion
P
a
per
|
Discussion
P
a
per
|
Discussio
n
P
a
per
|
systematically overestimated fossil OC compared to the measurements (Fig. 7c). How-ever for most of the winter and some autumn samples the fossil OC is underestimated. It should be noted that although14C measurements from a filter are precise, the possi-bility of contamination with “hot-carbon” (carbon containing much higher concentration than found in the atmosphere) exists close to nuclear installations, facilities for
inciner-5
ation of low-level radioactive waste and anthropogenic activities using14C as a tracer, and this would lead to an overestimation of the biogenic sources (Bench et al., 2007; Stenstr ¨om et al., 2010). Contamination of the samples to imply a higher fossil influ-ence is only possible if large amounts of fossil carbon were added to the samples, which would appear as elevated TC values. A more likely explanation for the incorrect
10
seasonal variation of the model fossil OC is that the emissions of primary OC may be overestimated in summer and under-estimated in winter. Given the paucity of experi-mental verification of such emissions, and the myriad and seasonally differing sources of OC, such uncertainties are not surprising.
In summer the modelled biogenic contributions to OC, which are generally the largest
15
fraction of TC, are reasonably well correlated with observations, but the model under-predicts biogenic OC by up to a factor of about two (Fig. 7d). This level of agreement is well within the uncertainties of the emissions of BVOC (Simpson et al., 1999; Rinne et al., 2009). In this comparison the model’s biogenic SOA and background OC is considered to be biogenic OC. Most of the model background OC is assumed to
orig-20
inate from primary biogenic particles, but it also includes particles emitted from the ocean and wild fires. For winter and autumn, the correlation between the model and the measurements of biogenic OC is very low (r=0.08). This is probably partly due to the very simplified model treatment of the background OC, which dominates the models biogenic OC during these periods. The discrepancy may also be related to
25
ACPD
11, 13575–13616, 2011Source apportionment of
carbonaceous aerosol
J. Genberg et al.
Title Page
Abstract Introduction
Conclusions References
Tables Figures
◭ ◮
◭ ◮
Back Close
Full Screen / Esc
Printer-friendly Version Interactive Discussion
Discussion
P
a
per
|
Dis
cussion
P
a
per
|
Discussion
P
a
per
|
Discussio
n
P
a
per
|
4 Conclusions
The sources of carbonaceous aerosol particles in background air in southern Sweden change significantly with the seasons. During summer, the total carbon is dominated by biogenic sources of OC, while fossil fuel combustion is the predominant source of EC. In winter, OC and EC originate mainly from biomass burning, as well as fossil fuel
5
combustion. These findings are similar to those found in earlier studies. Gelencs ´er et al. (2007) reported similar results for the low altitude sites K-Puszta (Hungary) and Aveiro (Portugal), although those summer aerosols were not as dominated by biogenic sources as at Vavihill. Just as for Vavihill, the winter samples collected at K-Puszta and Aveiro were dominated by biomass burning. The fractions are similar at the continental
10
and Swedish sites, although the TC mass is substantially higher at the continental sites. The present study shows that the sources of carbonaceous aerosols in southern Sweden are similar to those at other low altitude sites in Europe. This study adds a full year of source apportionment of carbonaceous aerosols at a part of Europe where such data are previously unavailable.
15
Comparison between the measurements and the EMEP model showed good agree-ment for total OC, except for the winter period. However, the model and measureagree-ment do not agree to which extent the individual sources of OC contribute. Biomass burn-ing is a large source durburn-ing winter accordburn-ing to the measurements, with contributions about eight times larger than that suggested by the model. This indicates a strong
un-20
derestimation of some Swedish and possibly international biomass burning emissions. When the biomass burning contribution in the model was scaled to fit the measured OCbb concentration, the total OC estimation was significantly improved as well. Fossil sources are also underestimated by the model during winter while they are overes-timated during summer. More work is needed to resolve the remaining discrepancy
25
ACPD
11, 13575–13616, 2011Source apportionment of
carbonaceous aerosol
J. Genberg et al.
Title Page
Abstract Introduction
Conclusions References
Tables Figures
◭ ◮
◭ ◮
Back Close
Full Screen / Esc
Printer-friendly Version Interactive Discussion
Discussion
P
a
per
|
Dis
cussion
P
a
per
|
Discussion
P
a
per
|
Discussio
n
P
a
per
|
Acknowledgements. This work was supported by The Swedish Research Council “Formas”,
The Swedish Clean Air Program (SCARP), the EU I3 project EUSAAR, Lund University Cen-tre for Studies of Carbon Cycle and Climate Interactions (LUCCI), the EU 6th Framework Pro-gramme EUCAARI project (contract 036833-2), as well as by Cooperative ProPro-gramme for Mon-itoring and Evaluation of the Long-Range Transmission of Air Pollutants in Europe (EMEP) and
5
The Royal Physiographic Society in Lund.
References
Andreae, M. O., Rosenfeld, D., Artaxo, P., Costa, A. A., Frank, G. P., Longo, K. M., and Silva-Dias, M. A. F.: Smoking Rain Clouds over the Amazon, Science, 303, 1337–1341, 2004. Bench, G., Fallon, S., Schichtel, B., Malm, B., and McDade, C.: Relative contributions of fossil
10
and contemporary carbon sources to PM 2.5 aerosols at nine Interagency Monitoring for Protection of VIsual Environments (IMPROVE) network sites, J. Geophys. Res.-Atmos., 112, D10205, doi:10.1029/2006JD007708, 2007.
Bergstr ¨om, R., Simpson, D., Denier van der Gon, H., Prevot, A., and Yttri, K. E.: Improvements in modelling Secondary Organic Aerosols with the EMEP model: Experiments with the VBS
15
Approach, to be submitted to Atmos. Chem. Phys., 2011.
Birch, M. E. and Cary, R. A.: Elemental carbon-based method for monitoring occupational exposures to particulate diesel exhaust, Aerosol Sci. Technol., 25, 221–241, 1996.
Cachier, H., Bremond, M.-P., and Buat-M ´enard, P.: Determination of atmospheric soot carbon with a simple thermal method, Tellus B, 41B, 379–390,
doi:10.1111/j.1600-20
0889.1989.tb00316.x, 1989.
Cavalli, F., Viana, M., Yttri, K. E., Genberg, J., and Putaud, J.-P.: Toward a standardised thermal-optical protocol for measuring atmospheric organic and elemental carbon: the EU-SAAR protocol, Atmos. Meas. Tech., 3, 79–89, doi:10.5194/amt-3-79-2010, 2010.
Cheng, Y., He, K. B., Duan, F. K., Zheng, M., Ma, Y. L., and Tan, J. H.: Positive sampling artifact
25
of carbonaceous aerosols and its influence on the thermal-optical split of OC/EC, Atmos. Chem. Phys., 9, 7243–7256, doi:10.5194/acp-9-7243-2009, 2009.
Crutzen, P. J. and Andreae, M. O.: Biomass Burning in the Tropics: Impact on Atmospheric Chemistry and Biogeochemical Cycles, Science, 250, 1669–1678, doi:10.1126/science.250.4988.1669, 1990.
ACPD
11, 13575–13616, 2011Source apportionment of
carbonaceous aerosol
J. Genberg et al.
Title Page
Abstract Introduction
Conclusions References
Tables Figures
◭ ◮
◭ ◮
Back Close
Full Screen / Esc
Printer-friendly Version Interactive Discussion
Discussion
P
a
per
|
Dis
cussion
P
a
per
|
Discussion
P
a
per
|
Discussio
n
P
a
per
|
Dockery, D. W., Pope, C. A., Xu, X., Spengler, J. D., Ware, J. H., Fay, M. E., Ferris, B. G., and Speizer, F. E.: An Association between Air Pollution and Mortality in Six U.S. Cities, New England Journal of Medicine, 329, 1753–1759, doi:10.1056/NEJM199312093292401, 1993.
Donahue, N. M., Robinson, A. L., Stanier, C. O., and Pandis, S. N.: Coupled partitioning,
5
dilution, and chemical aging of semivolatile organics, Environ. Sci. Technol., 40, 2635–2643, doi:10.1021/es052297c, 2006.
Engling, G., Carrico, C. M., Kreidenweis, S. M., Collett Jr., J. L., Day, D. E., Malm, W. C., Lincoln, E., Min Hao, W., Iinuma, Y., and Herrmann, H.: Determination of levoglucosan in biomass combustion aerosol by high-performance anion-exchange chromatography with pulsed
am-10
perometric detection, Atmos. Environ., 40, 299–311, doi:10.1016/j.atmosenv.2005.12.069, 2006.
Fine, P. M., Cass, G. R., and Simoneit, B. R. T.: Chemical characterization of fine particle emissions from fireplace combustion of woods grown in the northeastern United States, Environ. Sci. Technol., 35, 2665–2675, 2001.
15
Fine, P. M., Cass, G. R., and Simoneit, B. R. T.: Organic compounds in biomass smoke from residential wood combustion: Emissions characterization at a continental scale, J. Geophys. Res.-Atmos., 107, 8349, doi:10.1029/2001JD000661, 2002.
Fine, P. M., Cass, G. R., and Simoneit, B. R. T.: Chemical Characterization of Fine Particle Emissions from the Fireplace Combustion of Wood Types Grown in the Midwestern and
20
Western United States, Environmental Engineering Science, 21, 387–409, 2004a.
Fine, P. M., Cass, G. R., and Simoneit, B. R. T.: Chemical characterization of fine particle emissions from the wood stove combustion of prevalent United States tree species, Environ. Eng. Sci., 21, 705–721, 2004b.
Fraser, M. P. and Lakshmanan, K.: Using levoglucosan as a molecular marker for the
long-25
range transport of biomass combustion aerosols, Environ. Sci. Technol., 34, 4560–4564, 2000.
Fung, K.: Particulate Carbon Speciation by MnO2 Oxidation, Aerosol Sci. Technol., 12, 122–
127, 1990.
Gelencs ´er, A., May, B., Simpson, D., S ´anchez-Ochoa, A., Kasper-Giebl, A., Puxbaum, H.,
30
ACPD
11, 13575–13616, 2011Source apportionment of
carbonaceous aerosol
J. Genberg et al.
Title Page
Abstract Introduction
Conclusions References
Tables Figures
◭ ◮
◭ ◮
Back Close
Full Screen / Esc
Printer-friendly Version Interactive Discussion
Discussion
P
a
per
|
Dis
cussion
P
a
per
|
Discussion
P
a
per
|
Discussio
n
P
a
per
|
Genberg, J., Stenstr ¨om, K., Elfman, M., and Olsson, M.: Development of Graphitization of µg-Sized Samples at Lund University, Radiocarbon, 52, 1270–1276, 2010.
Glasius, M., Ketzel, M., W ˚ahlin, P., Jensen, B., Mønster, J., Berkowicz, R., and Palmgren, F.: Impact of wood combustion on particle levels in a residential area in Denmark, Atmos. Environ., 40, 7115–7124, doi:10.1016/j.atmosenv.2006.06.047, 2006.
5
Guenther, A. B., Zimmerman, P. R., Harley, P. C., Monson, R. K., and Fall, R.: Isoprene and monoterpene rate variability: model evaluations and sensitivity analyses, J. Geophys. Res. Atmos., 98, 12609–12617, 1993.
Gustafsson, ¨O., Krusa, M., Zencak, Z., Sheesley, R. J., Granat, L., Engstrom, E., Praveen, P. S., Rao, P. S. P., Leck, C., and Rodhe, H.: Brown Clouds over South Asia: Biomass or Fossil
10
Fuel Combustion?, Science, 323, 495–498, doi:10.1126/science.1164857, 2009.
Hedberg Larsson, E., Johansson, C., Johansson, L., Swietlicki, E., and Brorstr ¨om-Lund ´en, E.: Is Levoglucosan a Suitable Quantitative Tracer for Wood Burning? - Comparison with Re-ceptor Modeling on Trace Elements in Lycksele, Sweden, in, J. Air Waste Manage., 56(12), 1669–1678, 2006.
15
Hoffmann, D., Tilgner, A., Iinuma, Y., and Herrmann, H.: Atmospheric Stability of Levoglu-cosan: A Detailed Laboratory and Modeling Study, Environ. Sci. Technol., 44, 694–699, doi:10.1021/es902476f, 2010.
Hsu, C.-L., Cheng, C.-Y., Lee, C.-T., and Ding, W.-H.: Derivatization procedures and determination of levoglucosan and related monosaccharide anhydrides in
atmo-20
spheric aerosols by gas chromatography-mass spectrometry, Talanta, 72, 199–205, doi:10.1016/j.talanta.2006.10.018, 2007.
Jimenez, J. L., Canagaratna, M. R., Donahue, N. M., Prevot, A. S. H., Zhang, Q., Kroll, J. H., DeCarlo, P. F., Allan, J. D., Coe, H., Ng, N. L., Aiken, A. C., Docherty, K. S., Ulbrich, I. M., Grieshop, A. P., Robinson, A. L., Duplissy, J., Smith, J. D., Wilson, K. R., Lanz, V. A., Hueglin,
25
C., Sun, Y. L., Tian, J., Laaksonen, A., Raatikainen, T., Rautiainen, J., Vaattovaara, P., Ehn, M., Kulmala, M., Tomlinson, J. M., Collins, D. R., Cubison, M. J., Dunlea, J. E., Huffman, J. A., Onasch, T. B., Alfarra, M. R., Williams, P. I., Bower, K., Kondo, Y., Schneider, J., Drewnick, F., Borrmann, S., Weimer, S., Demerjian, K., Salcedo, D., Cottrell, L., Griffin, R., Takami, A., Miyoshi, T., Hatakeyama, S., Shimono, A., Sun, J. Y., Zhang, Y. M., Dzepina, K., Kimmel,
30
ACPD
11, 13575–13616, 2011Source apportionment of
carbonaceous aerosol
J. Genberg et al.
Title Page
Abstract Introduction
Conclusions References
Tables Figures
◭ ◮
◭ ◮
Back Close
Full Screen / Esc
Printer-friendly Version Interactive Discussion
Discussion
P
a
per
|
Dis
cussion
P
a
per
|
Discussion
P
a
per
|
Discussio
n
P
a
per
|
2009.
Kristensson, A., Dal Maso, M., Swietlicki, E., Hussein, T., Zhou, J., Kerminen, V. M., and Kulmala, M.: Characterization of new particle formation events at a background site in Southern Sweden: relation to air mass history, Tellus B, 60, 330–344, doi:10.1111/j.1600-0889.2008.00345.x, 2008.
5
Levin, I. and Hesshaimer, V.: Radiocarbon – a unique tracer of global carbon cycle dynamics, Radiocarbon, 42, 69–80, 2000.
Levin, I., Hammer, S., Kromer, B., and Meinhardt, F.: Radiocarbon observations in atmospheric CO2: Determining fossil fuel CO2 over Europe using Jungfraujoch observations as
back-ground, Sci. Total Environ., 391, 211–216, doi:10.1016/j.scitotenv.2007.10.019, 2008.
10
Lewis, C. W., Klouda, G. A., and Ellenson, W. D.: Radiocarbon measurement of the biogenic contribution to summertime PM-2.5 ambient aerosol in Nashville, TN, Atmos. Environ., 38, 6053–6061, doi:10.1016/j.atmosenv.2004.06.011, 2004.
Locker, H. B.: The use of levoglucosan to assess the environmental impact of residential wood-burning on air quality, Other Information: Thesis (Ph.D), Hanover, NH (US); Dartmouth
Col-15
lege, 147 pp., 1988.
Mareckova, K., Wankmueller, R., Anderl, M., Poupa, S., and Wieser, M.: Inventory Review 2009. Emission Data reported under the LRTAP Convention and NEC Directive. Stage 1 and 2 review. Status of gridded data and LPS dataISBN 978-3-99004-038-6, 2009.
Masiello, C. A.: New directions in black carbon organic geochemistry, Mar. Chem., 92, 201–
20
213, doi:10.1016/j.marchem.2004.06.043, 2004.
May, B., Wagenbach, D., Hammer, S., Steier, P., Puxbaum, H., and Pio, C.: The anthropogenic influence on carbonaceous aerosol in the European background, Tellus B, 61, 464–472, 2009.
McKay, M. D., Beckman, R. J., and Conover, W. J.: A Comparison of Three Methods for
Select-25
ing Values of Input Variables in the Analysis of Output from a Computer Code, Technomet-rics, 21, 239–245, 1979.
Menon, S., Hansen, J., Nazarenko, L., and Luo, Y.: Climate effects of black carbon aerosols in China and India, Science, 297, 2250–2253, 2002.
Murphy, B. N. and Pandis, S. N.: Simulating the Formation of Semivolatile Primary and
Sec-30
ondary Organic Aerosol in a Regional Chemical Transport Model, Environ. Sci. Technol., 43, 4722–4728, doi:10.1021/es803168a, 2009.
ACPD
11, 13575–13616, 2011Source apportionment of
carbonaceous aerosol
J. Genberg et al.
Title Page
Abstract Introduction
Conclusions References
Tables Figures
◭ ◮
◭ ◮
Back Close
Full Screen / Esc
Printer-friendly Version Interactive Discussion
Discussion
P
a
per
|
Dis
cussion
P
a
per
|
Discussion
P
a
per
|
Discussio
n
P
a
per
|
M., Sjodin, ˚A., Makela, K., and Mikkola-Pusa, J.: Review, improvement and harmonisation of the Nordic particulate matter air emission inventories, National environmental research institute, Aarhus NERI Technical Report no. 809, 77, 2010.
Oros, D. R. and Simoneit, B. R. T.: Identification and emission factors of molecular tracers in organic aerosols from biomass burning Part 1. Temperate climate conifers, Appl. Geochem.,
5
16, 1513–1544, doi:10.1016/s0883-2927(01)00021-x, 2001a.
Oros, D. R. and Simoneit, B. R. T.: Identification and emission factors of molecular tracers in organic aerosols from biomass burning Part 2. Deciduous trees, Appl. Geochem., 16, 1545– 1565, doi:10.1016/s0883-2927(01)00022-1, 2001b.
Pope III, C. A., Burnett, R. T., and Thun, M. J.: Lung Cancer, Cardiopulmonary Mortality, and
10
Long-term Exposure to Fine Particulate Air Pollution, JAMA: Journal of the American Medical Association, 287, 1132–1142, 2002.
P ¨oschl, U.: Atmospheric aerosols: Composition, transformation, climate and health effects, Angew. Chem.-Int. Edit., 44, 7520–7540, doi:10.1002/anie.200501122, 2005.
Putaud, J.-P., Cavalli, F., Alastuey, A., Bourcier, L., Ceburnis, D., Dˇzumbov ´a, L., Fors, E.,
Gen-15
berg, J., Hoffer, A., Kiss, G., Schwarz, J., Sellegri, K., Viana, M., and Yttri, K. E.: Determi-nation and mitigation of artifacts in sampling particulate organic carbon across Europe, IAC, Helsinki, 2010.
Puxbaum, H., Caseiro, A., Sanchez-Ochoa, A., Kasper-Giebl, A., Claeys, M., Gelencser, A., Legrand, M., Preunkert, S., and Pio, C.: Levoglucosan levels at background sites in Europe
20
for assessing the impact of biomass combustion on the European aerosol background, J. Geophys. Res.-Atmos., 112, D23S05, doi:10.1029/2006JD008114, 2007.
Ramanathan, V. and Carmichael, G.: Global and regional climate changes due to black carbon, Nature Geosci., 1, 221–227, 2008.
Reimer, P. J., Brown, T. A., and Reimer, R. W.: Discussion: Reporting and Calibration of
Post-25
Bomb 14C Data, Radiocarbon, 46, 1299–1304, 2004.
Richards, F. J.: A Flexible Growth Function for Empirical Use, J. Exp. Bot., 10, 290–300, doi:10.1093/jxb/10.2.301, 1959.
Rinne, J., B ¨ack, J., and Hakola, H.: Biogenic volatile organic compound emissions from Eurasian taiga: Current knowledge and future directions, Boreal Environ. Res., 14, 807–
30
826, 2009.
ACPD
11, 13575–13616, 2011Source apportionment of
carbonaceous aerosol
J. Genberg et al.
Title Page
Abstract Introduction
Conclusions References
Tables Figures
◭ ◮
◭ ◮
Back Close
Full Screen / Esc
Printer-friendly Version Interactive Discussion
Discussion
P
a
per
|
Dis
cussion
P
a
per
|
Discussion
P
a
per
|
Discussio
n
P
a
per
|
Water Air Soil Pollut., 191, 265–277, doi:10.1007/s11270-008-9623-1, 2008.
Schauer, J. J., Kleeman, M. J., Cass, G. R., and Simoneit, B. R. T.: Measurement of Emissions from Air Pollution Sources. 3. C1-C29 Organic Compounds from Fireplace Combustion of Wood, Environ. Sci. Technol., 35, 1716–1728, doi:10.1021/es001331e, 2001.
Shrivastava, M. K., Lane, T. E., Donahue, N. M., Pandis, S. N., and Robinson, A.
5
L.: Effects of gas particle partitioning and aging of primary emissions on urban and regional organic aerosol concentrations, J. Geophys. Res.-Atmos., 113(16), D18301, doi:10.1029/2007jd009735, 2008.
Simpson, D., Winiwarter, W., B ¨orjesson, G., Cinderby, S., Ferreiro, A., Guenther, A., Hewitt, C. N., Janson, R., Khalil, M. A. K., Owen, S., Pierce, T. E., Puxbaum, H., Shearer, M., Skiba,
10
U., Steinbrecher, R., Tarras ´on, L., and ¨Oquist, M. G.: Inventorying emissions from Nature in Europe, J. Geophys. Res. Atmos., 104D, 8113–8152, 1999.
Simpson, D., Yttri, K. E., Klimont, Z., Kupiainen, K., Caseiro, A., Gelencs ´er, A., Pio, C., Puxbaum, H., and Legrand, M.: Modeling carbonaceous aerosol over Europe: Analysis of the CARBOSOL and EMEP EC/OC campaigns, J. Geophys. Res. Atmos., 112, 1–26, 2007.
15
Simpson, D., Benedictow, A., Berge, H., Bergstr ¨om, R., Fagerli, H., Gauss, M., Jonson, J., Nyri, A., Semeena, V., Tsyro, S., Valdebenito, A., and Wind, P.: The EMEP MSC-W Chemical Transport model I: Model documentation, to be submitted to Atmos. Chem. Phys., 2011. Skog, G.: The single stage AMS machine at Lund University: Status report, Nuclear
Instru-ments and Methods in Physics Research Section B, Beam Interactions with Materials and
20
Atoms, 259, 1–6, doi:10.1016/j.nimb.2007.01.190, 2007.
Skog, G., Rundgren, M., and Sk ¨old, P.: Status of the Single Stage AMS machine at Lund University after 4 years of operation, Nuclear Instruments and Methods in Physics Research Section B, Beam Interactions with Materials and Atoms, 268, 895–897, doi:10.1016/j.nimb.2009.10.058, 2010.
25
Stenstr ¨om, K., Skog, G., Nilsson, C. M., Hellborg, R., Leide Svegborn, S., Georgiadou, E., and Mattsson, S.: Local variations in 14C – how is bomb-pulse dating of human cells and tissues affected?, Nuclear Instruments & Methods in Physics Research Section B, B268, 1299–1302, 2010.
Stuiver, M. and Quay, P. D.: Atmospheric14C changes resulting from fossil fuel CO2 release
30
and cosmic ray flux variability, Earth Planet. Sci. Lett., 53, 349–362, doi:10.1016/0012-821x(81)90040-6, 1981.