www.nat-hazards-earth-syst-sci.net/10/1403/2010/ doi:10.5194/nhess-10-1403-2010
© Author(s) 2010. CC Attribution 3.0 License.
and Earth
System Sciences
Power law relationship between parameters of earthquakes and
precursory electrical phenomena revisited II
E. Dologlou
Solid State Section, Department of Physics, University of Athens, Panepistimiopolis, Zografos, 157 84 Athens, Greece Received: 15 April 2010 – Revised: 4 June 2010 – Accepted: 7 June 2010 – Published: 1 July 2010
Abstract. The credibility of the power law relation, re-ported by Dologlou (2009) between the stress drop of an earthquake and the lead time of the preceded Seismic Elec-tric Signal, SES, has been checked through additional new data from 9 June 2008 to 7 April 2010. Three earthquakes with Mw≥5.5 have been found in Greece during this
pe-riod. A critical exponentα (e.g. 0.328) has been obtained which compares very well with the one reported (α=0.332) by Dologlou (2009). The stability of this exponent might imply that critical dynamic processes, of mechanical (earth-quakes) and also of electromagnetic (SES) sense dominate the pre focal area when the SES signal of the impending earthquake is emitted.
1 Introduction
The last 3 decades low frequency (<1 Hz) variations of the earth’s electric field, known as seismic electric signals (SES), have been monitored at different stations in Greece and were found to precede large earthquakes (Varotsos and Alexopou-los, 1984a, b; Varotsos and Lazaridou, 1991; Varotsos et al., 1993). A fundamental feature of the SES signal is the lead time1t, which is the time difference between the detection of the SES and the occurrence of the associated earthquake and varies from some hours to some weeks (Varotsos and Alexopoulos, 1984 a, b; Varotsos et al., 1996).
Recently, the introduction of a new time domain, termed natural time (Varotsos et al., 2002; 2003a, b, 2005), al-lowed the identification of the time of the impending earth-quake with accuracy of the order of one week (Varotsos et al., 2006a, b). As for the epicentral area it is estimated on the basis of the so called SES selectivity which states that a SES station can be sensitive to some specific seismic areas
Correspondence to:E. Dologlou ([email protected])
while remains inactive to some others even at closer distances (Varotsos and Lazaridou, 1991; Varotsos et al., 1993; Sarlis et al., 1999)
A brief description of the physical mechanism of the SES generation is given below: The various materials that exist in the Earth’s crust contain intrinsic lattice defects (Varot-sos and Alexopoulos, 1978, 1979, 1984c) e.g. anion Frenkel in alkaline earth fluorides (Varotsos, 1976, 2007), vacancies in metals (Varotsos and Alexopoulos, 1982), Schotcky de-fects in ionic crystals. Beyond these dede-fects, however, extrin-sic also defects are formed for charge compensation reasons (Kostopoulos et al., 1975; Varotsos et al., 1978) particularly in ionic solids (Varotsos and Alexopoulos, 1981) when are doped with aliovalent impurities. A portion of these defects are attracted by the nearby impurities, thus forming electric dipoles the orientation of which can change by means of a defect migration according to the relation
τ=(λν)−1exp(g/ kT ) (1) where T denotes the temperature, λ the number of jump paths accessible to jumping species with an attempt fre-quencyνandgthe Gibbs energy for the (re)orientation pro-cess. Pressure affects the value ofg(Varotsos, 1977; Varot-sos and Alexopoulos, 1978) as expressed by
v=(dg/dP )T (2) wherev denotes the migration or the activation volume in general (Varotsos et al., 1998) Thus, if v<0 (Varotsos and Alexopoulos, 1980), an increase of pressure results in a de-crease of the relaxation timeτ. When the pressure reaches a critical valueP=Pcra transient current, arising from a
coop-erative (re)orientation of dipoles, is emitted with a relaxation timeτ (Pcr)following relation:
bv kT = −
1
τ (Pcr)
Let us now examine the dynamical processes which are de-veloping in the prefocal area. Before an earthquake, the pre-seismic volume is subjected to an increasing tectonic stress which affects the thermodynamic parameters of this migra-tion (Varotsos, 1977) and may cause a gradual decrease of their relaxation time. When the stress reaches acriticalvalue the dipoles in the rocks in the pre-seismic area, change ori-entation cooperatively and a transient signal (Varotsos and Alexopoulos, 1986; Varotsos, 2005) is emitted. This signal constitutes the SES activity and it is characterized by critical dynamics.
The amplitudeE=1V /Lof the SES, where 1V is the potential difference between to points on the ground at a dis-tanceLmeasured by two buried electrodes, is related to the magnitudeMof the forthcoming earthquake by the experi-mental formula:
logE=aM+b (4)
wherea≈0.3–0.4 andbis a site constant. Equation (4) is a power law relation that is reminiscent of the theory of critical phenomena (Varotsos and Alexopoulos, 1984 a, b; Varotsos, 2005).
Alternatively, Ishido and Mizutani (1981) suggested the electrokinetic effect for the SES generation, in terms of criti-cality, which leads to an exponent of 0.3–0.4 for critical phe-nomena (Surkov et al., 2002) while Sornette et al. (1989) consider that fracture processes are described by a power law relation with critical exponent values of 0.33 and 0.47 for 2 and 3 dimensions, respectively.
Possible relations between properties of earthquakes and characteristics of precursory SES signals have been investi-gated in a series of articles. Recently, (Dologlou, 2008, 2009) a power law relation between the stress drop of the earth-quake, which is the difference between the stress state at a point on a fault before and after the occurrence of the earth-quake (Kanamori and Anderson, 1975), and the lead time of the associated SES has been found with an exponent falling within the range of values for critical phenomena.
In this work we check the validity of this relation by means of additional new data and we examine the degree of stability of the critical exponent value.
2 Data and analysis
In a previous paper (Dologlou, 2009) we referred to large shallow (depth<40 km) earthquakes in Greece for which Brune’s stress drop (Brune, 1970, 1971) values were either reported or derived by using a special technique based on the dimensions of the aftershock area and seismic moment (Ki-ratzi et al., 1991). Here, we deal with the largest events that occurred recently in Greece, i.e., after the Andravida case (on 8 June 2008). Three earthquakes with Mw≥5.5 were
found in the area (36–41)N , (19–25)E from 9 June 2008 to 6 April 2010; the first earthquake occurred in Ionian sea on
16 February 2009 at 23:16 UTC withMw=5.5 and
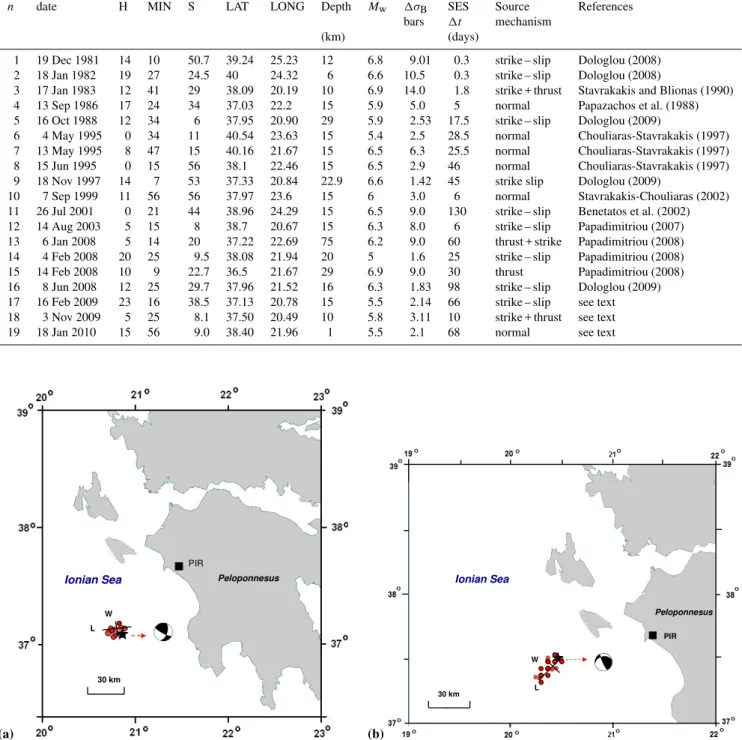
epicen-ter 37.13N, 20.78E (event no. 17 in Table 1) and was pre-ceded by a SES activity recorded at PIR station (Fig. 1a) on 12 December 2008 with a lead time1t=66 days; the second earthquake with Mw=5.8 took place on 3 November 2009
at 05:25 UTC with epicenter 37.5N, 20.49E (event no. 18 in Table 1) and was preceded by a SES activity detected at PIR station (Fig. 1b) on 24 October 2009 with a lead time
1t=10 days. At last, on 18 January 2010 at 15:56 UTC a third earthquake withMw=5.5 (event no. 19 in Table 1)
oc-curred in Central Greece (38.39N 21.90E), close to the town of Nafpaktos, and caused moderate damage in the village of Efpalion (Fig. 1c). This event was also preceded by a SES activity recorded at PAT station on 11 November 2009 with a lead time1t=68 days.
The Brune’s stress drop values for these earthquakes were calculated through the formula of Hanks and Wyss (1972):
1σB=0.44Mo/r3 (5)
whereMois the seismic moment and r the radius for a cir-cular fault derived fromP andSteleseismic waves displace-ment spectra. The estimation of the radiusr, was obtained by the application of the aftershock area technique (Kiratzi, 1991) as it is described in details by Dologlou (2009). The definition of the dimensions of the aftershock area requires a rich aftershock sequence which was not in all cases available by USGS. Thus, in order to overcome this obstacle and en-rich the number of aftershocks, we combined the USGS data with additional ones reported by the European Mediterranean Seismological Center, EMSC (http://www.emsc-csem.org) which by being closer to Greece is able to locate the small magnitude events (Mw>3). All aftershocks of the three
main shocks withMw>3 reported either by USGS or EMSC
for the periods, 16 February 2009 (23:17) to 30 March 2009, 3 November 2009 (05:26) to 31 December 2009, and 18 January 2010 (15:57) to 28 February 2010, respectively, are shown in separate maps in Fig. 1. In each map, the black star denotes the main shock, the beach ball repre-sents its CMT focal mechanism (http://earthquake.usgs.gov/ earthquakes/eqarchives/sopar/). For events 18 and 19 the fo-cal mechanisms were taken from NOA (National Observa-tory of Athens) because there are not available USGS yet. At last, black square shows the location of the SES detec-tion stadetec-tion. The aftershock areaS=L×W, where Lis the length andW the width in km, is well defined from the dis-tribution of aftershocks. The radiusris calculated from the equationS=π r2. Concerning the seismic momentMo, two
Table 1.The updated version of the table reported by Dologlou (2009) including 3 new earthquakes in Ionian Sea and Central Greece (events no. 17, 18, and 19). All 19 earthquakes are presented with available stress drop values and precursory SES signals in Greece from 1981 to 2010, along with their dates, epicentres, depths, moment magnitudesMw, stress drop values (1σB), SES lead times1tand mechanism type
(strike-slip, normal or thrust). Events are numbered in chronological order and references for the stress drop values are given in the last column.
n date H MIN S LAT LONG Depth Mw 1σB SES Source References
bars 1t mechanism
(km) (days)
1 19 Dec 1981 14 10 50.7 39.24 25.23 12 6.8 9.01 0.3 strike – slip Dologlou (2008) 2 18 Jan 1982 19 27 24.5 40 24.32 6 6.6 10.5 0.3 strike – slip Dologlou (2008)
3 17 Jan 1983 12 41 29 38.09 20.19 10 6.9 14.0 1.8 strike + thrust Stavrakakis and Blionas (1990) 4 13 Sep 1986 17 24 34 37.03 22.2 15 5.9 5.0 5 normal Papazachos et al. (1988) 5 16 Oct 1988 12 34 6 37.95 20.90 29 5.9 2.53 17.5 strike – slip Dologlou (2009)
6 4 May 1995 0 34 11 40.54 23.63 15 5.4 2.5 28.5 normal Chouliaras-Stavrakakis (1997) 7 13 May 1995 8 47 15 40.16 21.67 15 6.5 6.3 25.5 normal Chouliaras-Stavrakakis (1997) 8 15 Jun 1995 0 15 56 38.1 22.46 15 6.5 2.9 46 normal Chouliaras-Stavrakakis (1997) 9 18 Nov 1997 14 7 53 37.33 20.84 22.9 6.6 1.42 45 strike slip Dologlou (2009)
10 7 Sep 1999 11 56 56 37.97 23.6 15 6 3.0 6 normal Stavrakakis-Chouliaras (2002) 11 26 Jul 2001 0 21 44 38.96 24.29 15 6.5 9.0 130 strike – slip Benetatos et al. (2002) 12 14 Aug 2003 5 15 8 38.7 20.67 15 6.3 8.0 6 strike – slip Papadimitriou (2007) 13 6 Jan 2008 5 14 20 37.22 22.69 75 6.2 9.0 60 thrust + strike Papadimitriou (2008) 14 4 Feb 2008 20 25 9.5 38.08 21.94 20 5 1.6 25 strike – slip Papadimitriou (2008) 15 14 Feb 2008 10 9 22.7 36.5 21.67 29 6.9 9.0 30 thrust Papadimitriou (2008) 16 8 Jun 2008 12 25 29.7 37.96 21.52 16 6.3 1.83 98 strike – slip Dologlou (2009) 17 16 Feb 2009 23 16 38.5 37.13 20.78 15 5.5 2.14 66 strike – slip see text 18 3 Nov 2009 5 25 8.1 37.50 20.49 10 5.8 3.11 10 strike + thrust see text 19 18 Jan 2010 15 56 9.0 38.40 21.96 1 5.5 2.1 68 normal see text
(a)
L W
30 km
PIR
Peloponnesus
Ionian Sea
(b)
30 km
W
L
Peloponnesus Ionian Sea
PIR
Fig. 1. Map of Western Greece, with the distribution (forming a cluster) of all reported by USGS or EMSC aftershocks withMw≥3 (red
Table 2. The date, the magnitudeMwand the seismic momentMoof event no. 17 along with the range of values in the dimensions of the
aftershock area L and W, the corresponding calculated values for1σB, the critical exponentαand the associated correlation coefficientR.
Mean values are given in the last row.
Date Mw Mo(1024dyn.cm) L (km) W (km) 1σB(bars) α R
16 Feb 2009 5.5 2.2 18–20 8–10 3.1–1.9 0.328–0.332 0.80–0.83 1.7 18–20 8–10 2.41–1.47 0.324–0.341 0.82–0.83 Mean value 1.95 19 9 2.14 0.331±0.01 >0.80
Table 3. The date, the magnitudeMwand the seismic moment of event no. 18 along with the range of values in the dimensions of the
aftershock area L and W, the corresponding calculated values for1σB, the critical exponentαand the associated correlation coefficientR.
Mean values are given in the last row.
Date Mw Mo(1024dyn.cm) L (km) W (km) 1σB(bars) α R
3 Nov 2009 5.8 8 26–28 10–12 4.67–3.18 0.329–0.328 0.82–0.80 5.7 5 26–28 10–12 2.92–1.98 0.328–0.327 0.82–0.80 Mean value 6.5 27 11 3.11 0.328±0.01 0.81
L W
20 km PAT
Peloponnesus
Central Greece
Efpalion
(c)
Fig. 1.Continued.
depths, moment magnitudesMw, stress drop values (1σB),
SES lead times1t and mechanism type (strike-slip, normal or thrust). Events are numbered in chronological order and references for the stress drop values are given in the last col-umn. The lead times,1t, for the events no. (1–16) are taken from the papers quoted by Dologlou (2009) while for the un-der study three recent events (no. 17, 18, and 19) from Varot-sos et al. (2009a, b).
A power law relation with an exponentαis found between the stress drop1σBvalues and the lead time1tof their
pre-cursory SES of all “non thrust” earthquake (Table 1). Event
no. 11 is excluded from this relation for reasons explained in detail by Dologlou et al. (2008). This event had an unusual long lead time and occurred in a specific region of small crust thickness (Le Pichon et al., 1984) and high heat flow rate (Jongsma, 1974).
The date, the magnitudeMwand the seismic momentMo
along with the range of values in the dimensionsLandW
of the aftershock area, the corresponding calculated values for1σB, the critical exponentαand the associated
correla-tion coefficientRfor events 17, 18, and 19 are presented in Tables 2, 3, and 4, respectively. Their mean values are also given in the last row.
3 Discussion
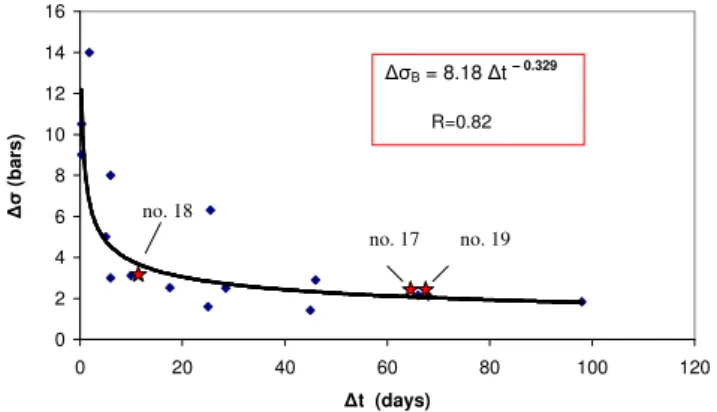
The following power law relation 1σB=8.181t−0.329
be-tween the stress drop1σBvalues (in bars) of all “non thrust”
earthquakes and the lead time1t (in s) of their precursory SES listed in Table 1 is obtained (see plot in Fig. 2) with an exponentα=0.329 falling within the range value (0.3–0.4) empirically determined by Varotsos and Alexopoulos (1984). The dynamics of earthquakes of thrust mechanism which oc-cur in zones of high stress accumulation, like subduction or collision zones, differ significantly from those of strike-slip or normal type mechanisms. Probably this fact could ten-tatively justify the observation that when thrust type earth-quakes are included in the above power law relation the value of the exponentαis strongly violated.
Table 4. The date, the magnitudeMwand the seismic moment of event no. 19 along with the range of values in the dimensions of the
aftershock area L and W, the corresponding calculated values for1σB, the critical exponentαand the associated correlation coefficientR.
Mean values are given in the last row.
Date Mw Mo(1024dyn.cm) L (km) W (km) 1σB(bars) α R
18 Jan 2010 5.5 2.1 16–18 9–11 2.97–1.85 0.314–0.332 0.80–0.82 5.4 1.7 16–18 9–11 2.41–1.49 0.322–0.341 0.81–0.82 Mean value 1.9 17 10 2.1 0.328±0.02 0.81
exponentαwhich remains almost the same with the reported one (α=0.332) by Dologlou (2009). This implies that this relation is quite robust and probably reveals that underlying critical dynamic processes govern the pre focal area when the SES of the forthcoming earthquake is emitted.
Considering now the range value of the dimensionLand
Wfor each event (Tables 2, 3, and 4) we notice that the expo-nentαspans between the values 0.32–0.34 with a correlation coefficientR>0.80 in all cases and thus, remaining within the critical value range.
We will now discuss whether an interrelation between lead time and stress drop can be physically understood. The sim-ilar critical exponents in fracture processes (Sornette et al., 1989) and in the experimental Eq. (4) (Varotsos, 2005) prob-ably implies that upon the emission of the SES, the pre fo-cal area enters into a critifo-cal stage. As the tectonic stress increases, the pre-seismic volume evolves to the critical ap-proach of the main-shock and long range correlations emerge in the area. The lead time1t between the emission of the SES and the earthquake is given by
1t=(Pfr−Pcr)/b (6)
(wherePfr is the critical stress for earthquake occurrence).
Since Pfr>Pcr is always positive, 1t becomes shorter for
rapid stress increase (largerb). During the last preparatory stage of a given earthquake when in general power law pro-cesses prevail, b value may change with time. From Eqs. (1) and (3) it can be shown (Varotsos et al., 1993) that
dPcr/db(Pcr)=τ (Pcr) (7)
which reflects that dPcr/db(Pcr)is always positive. Hence,
for larger values ofb, the critical pressurePcrbecomes also
larger. Then the numerator of the right hand side of Eq. (6) becomes smaller leading to the conclusion that an increase in the b value causes a two-fold decrease in the lead time and vice versa. For different earthquakes, in the same geo-tectonic area, ifPfrmay approximately be assumed constant
but the corresponding b values (and therefore the Pcrvalues)
may be larger or smaller, reflecting – from Eq. (6) – smaller or larger1t values will result, respectively. The question is whether a similar situation can be expected for the in-terconnection between1t and the stress drop1σ, because from physical point of view, stress drop is a quantity different
0 2 4 6 8 10 12 14 16
0 20 40 60 80 100 120
t (days)
(
b
a
rs
)
= 8.18 t – 0.329
R=0.82
no. 18
no. 17 no. 19
Fig. 2.The plot of the relation between the stress drop and the lead time of all “non thrust” earthquakes, which are listed in Table 1. Event no. 11 is excluded. The new events no. 17, 18, and 19 are marked with stars. The derived power law equation along with the corresponding correlation coefficient R are displayed on the top of the diagram.
from (Pfr−Pcr). The precise value of this difference is still
unknown, thus making difficult at this stage any attempt to-wards explaining why a power law of the form1σB∝1t−α
describes the experimental data although, such power laws are expected since we are dealing with critical processes. 4 Conclusions
Edited by: M. E. Contadakis
Reviewed by: two anonymous referees
References
Benetatos, C., Roumelioti, Z., Kiratzi, A., and Melis, N.: Source parameters of the M 6.5 Skyros island (North Aegean Sea) earth-quake of July 26, 2001, Ann. Geophys.-Italy, 45, 513–526, 2002. Brune, J. : Tectonic stress and the spectra of seismic shear waves,
J.Geophys. Res., 75, 4997–5009, 1970.
Brune, J. N.: Correction, J. Geophys. Res., 76, p. 5002, 1971. Chouliaras, G. and Stavrakakis, G.: Seismic source parameters
from a new dial-up seismological network in Greece, Pure Appl. Geophys., 150, 91–111, 1997.
Dologlou, E.: Power law relationship between parameters of earth-quakes and precursory electrical phenomena, Nat. Hazards Earth Syst. Sci., 8, 977–983, doi:10.5194/nhess-8-977-2008, 2008. Dologlou, E.: Power law relationship between parameters of
earth-quakes and precursory electrical phenomena revisited, Nat. Haz-ards Earth Syst. Sci., 9, 17–23, doi:10.5194/nhess-9-17-2009, 2009.
Dologlou, E., Hadjicontis, V., and Mavromatou, C.: Electri-cal precursors of earthquakes in Aegean Sea during the last decade (1997-2007), Nat. Hazards Earth Syst. Sci., 8, 123–128, doi:10.5194/nhess-8-123-2008, 2008.
Hanks, T. and Wyss, M.: The use of body wave spectra in the de-termination of seismic source parameters, B. Seismol. Soc. Am., 62, 561–589, 1972.
Ishido, T. and Mizutani, H.: Experimental and theoretical basis of electrokinetic phenomena in rock-water systems and its applica-tions to geophysics, J. Geophys. Res., 86, 1763–1775, 1981. Jongsma, D.: Heat Flow in the Aegean Sea, Geophys. J. Int., 37(3),
337–346, 1974.
Kanamori, H. and Anderson, D. L.: Theoretical basis of some em-pirical relations in seismology, B. Seismol. Soc. Am., 65, 1073– 1095, 1975.
Kiratzi, A. A., Wagner, G. S., and Langston, C. A.: Source Param-eters of Some Large Earthquakes in Nortern Aegean Determined by Body Waveform Inversion, Pure Appl. Geophys., 135, 515– 527, 1991.
Kiratzi, A. A., Karakaisis, G. F., Papadimitriou, E. E., and Pa-pazachos, B. C.: Seismic-Source Parameter Relations for Earth-quakes in Greece, Pure Appl. Geophys., 123, 27–41, 1985. Kostopoulos, D., Varotsos, P., and Mourikis, S.: Conductivity of
crystalline NaI, Can. J. Phys., 53, 1318–1320, 1975.
Le Pichon, X., Lyberis, N., and Alvarez, F.: Subsidence history of North Aegean through, in: The geological evolution of the Eastern Mediterranean, edited by: Dixon, J. E. and Robertson, A. H., Blackwell Scientif. Pub., Oxford, Geol. Soc. London, Sp. Publ. No. 17, 727–741, 1984.
Papazachos, B., Kiratzi, A., Karakostas, B., Panagiotopoulos, D., Scordilis, E., and Mountrakis, D.: Surface Fault Traces, Fault Plane Solution and Spatial Distribution of the Aftershocks of the September 13, 1986 Earthquake of Kalamata (Southern Greece), Pure Appl. Geophys., 126, 55–68, 1988.
Sarlis, N., Lazaridou,M., Kapiris, P., and Varotsos, P.: Numerical model of the selectivity effect and the1V/L criterion, Geophys. Res. Lett., 26, 3245–3248, 1999.
Sornette, D., Lagier, M., Roux, S., and Hansen, A.: Critical piezo-electricity in percolation, J. Phys. France, 50, 2201–2216, 1989. Stavrakakis, G. and Blionas, S.: Eastern Mediterranean Region Based on an Iterative Maximum Entropy Technique, Pure Appl. Geophys., 132, 679–698, 1990.
Stavrakakis, G., Chouliaras, G., and Panopoulou, G.: Seis-mic Source Parameters for the ML=5.4 Athens Earthquake (7 September 1999) from a New Telemetric Broad Band Seismo-logical Network in Greece, Nat. Hazards, 27, 47–60, 2002. Surkov, V., Uyeda, S., Tanaka, H., and Hayakawa, M.: Fractal
Prop-erties of medium and seismoelectric phenomena, J. Geodynam-ics, 33, 477–487, 2002.
Varotsos, P.: Comments on the formation entropy of a Frenkel de-fect in BaF2 and CaF2, Phys. Rev. B-Solid St., 13, p. 938, 1976. Varotsos, P. A.: Temperature and pressure dependence of defect for-mation volume in ionic crystals, J. Phys. Lett.-Paris, 38, L455– L458, 1977.
Varotsos, P.: On the temperature variation of the bulk modulus of mixed alkali halides, Phys. Status Solidi-B, 99, K93–K96, 1980. Varotsos, P. A.: The Physics of Seismic Electric Signals, TerraPub,
Tokyo, 2005.
Varotsos, P.: Comparison of models that interconnect point defect parameters, J. Appl. Phys., 101, article 123503, 8 pp., 2007. Varotsos, P. A. and Mourikis, S.: Difference in conductivity
be-tween LiD and LiH crystals, Phys. Rev. B, 10, 5220–5224, 1974. Varotsos, P. and Miliotis, D.: New aspects on the dielectric proper-ties of the alkali halides with divalent impuriproper-ties, J. Phys. Chem. Solids, 35, 927–930, 1974.
Varotsos, P. and Alexopoulos, K.: Estimation of the migration en-thalpy and entropy for cation vacancy motion in alkali halides with the NaCl-type structure, Phys. Rev. B, 15, 2348–2351, 1977.
Varotsos, P. and Alexopoulos, K.: The curvature in conductivity plots of silver halides as a consequence of anharmonicity, J. Phys. Chem. Solids, 39, 759–761, 1978.
Varotsos, P. and Alexopoulos, K.: On the possibility of the enthalpy of a Schottky defect decreasing with increasing temperature, J. Phys. C-Solid State, 12, L761–L764, 1979.
Varotsos, P. and Alexopoulos, K.: Negative activation volumes of defects in solids, Phys. Rev. B, 21, 4898–4899, 1980.
Varotsos, P. and Alexopoulos, K.: Decisive importance of the bulk modulus and the anharmonicity in the calculation of migration and formation volumes, Phys. Rev. B, 24, 904–910, 1981. Varotsos, P. and Alexopoulos, K.: Current methods of lattice defect
analysis using dilatometry and self diffusion. Critical Review and proposals, Phys. Stat. Solidi B, 110, 9–31, 1982.
Varotsos, P. and Alexopoulos, K. : Physical properties of the vari-ations of the electric field of the earth preceding earthquakes, I, Tectonophysics, 110, 73–98, 1984a.
Varotsos, P. and Alexopoulos, K.: Physical properties of the vari-ations of the electric field of the earth preceding earthquakes, II. Determination of epicentre and magnitude, Tectonophysics, 110, 99–125, 1984b.
Varotsos, P. and Alexopoulos, K.: Connection between the forma-tion volume and formaforma-tion Gibbs energy in noble gas solids, Phys. Rev. B, 30, 7305–7306, 1984c.
Varotsos, P. and Lazaridou, M.: Latest aspects of earthquake pre-diction in Greece based on seismic electric signals, I, Tectono-physics, 188, 321–347, 1991.
Varotsos, P., Ludwig W. and Alexopoulos, K.: Calculation of the formation volume of vacancies in solids, Phys. Rev. B, 18, 2683– 2691, 1978.
Varotsos, P., Alexopoulos, K., and Lazaridou M.: Latest aspects of earthquake earthquake prediction in Greece based on Seismic Electric Signals II, Tectonophysics, 224, 1–37, 1993.
Varotsos, P. A., Sarlis, N. V., and Skordas, E. S.: Long-range corre-lations in the electric signals that precede rupture, Phys. Rev. E, 66, article 011902, 7 pp., 2002.
Varotsos, P. A., Sarlis, N. V., and Skordas, E. S.: Long-range corre-lations in the electric signals that precede rupture: further inves-tigations, Phys. Rev. E, 67, article 021109, 13 pp., 2003a. Varotsos, P., Sarlis, N., and Skordas, E.: Attempt to distinguish
electric signals of a dichotomous nature, Phys. Rev. E, 68, arti-cle 031106, 7 pp., 2003b.
Varotsos, P. A., Sarlis, N. V., and Skordas, E. S.: Detrended fluctuation analysis of the magnetic and electric field vari-ations that precede rupture, CHAOS, 19, article 023114, arXiv:cond mat: 0904.2465v8, 7 pp., 14 November 2009a. Varotsos, P., Alexopoulos, K., Lazaridou, M., and Nagao, T.:
Earth-quake predictions issued in Greece by seismic electric signals since February 6, 1990, Tectonophysics, 224, 269–288, 1993.
Varotsos, P., Eftaxias, K., Vallianatos, F., and Lazaridou, M.: Basic principles for evaluating an earthquake prediction method, Geo-phys. Res. Lett., 23, 1295–1298, 1996.
Varotsos, P., Sarlis, N., Lazaridou, M., and Kapiris, P.: Transmis-sion of stress induced electric signals in dielectric media, J. Appl. Phys., 83, 60–70, 1998.
Varotsos, P. A., Sarlis, N. V., Skordas, E. S., and Lazaridou, M.: Natural entropy fluctuations discriminate similar looking elec-tric signals emitted from systems of different dynamics, Phys. Rev. E, 71, article 011110, 11 pp., 2005.
Varotsos, P. A., Sarlis, N. V., Skordas, E. S., and Lazaridou, M. S.: The fluctuations, under time reversal, of the natural time and the entropy distinguish similar looking electric signals of differ-ent dynamics, J. Appl. Phys., 103, article 014906, 12 pp., 2008; arXiv:cond mat: 0707.3074v3, 5 February 2009, arXiv:cond mat: 0707.3074v4, 20 February 2009b.
Varotsos, P., Sarlis, N., Skordas, E., Tanaka, H., and Lazaridou, M.: Entropy of seismic electric signals: analysis in natural time under time reversal, Phys. Rev. E, 73, article 031114, 8 pp., 2006a. Varotsos, P., Sarlis, N., Skordas, E., Tanaka, H., and Lazaridou, M.: