© Author(s) 2009. This work is distributed under the Creative Commons Attribution 3.0 License.
and Earth
System Sciences
Power law relationship between parameters of earthquakes and
precursory electrical phenomena revisited
E. Dologlou
Solid State Section, Department of Physics, University of Athens, Panepistimiopolis, Zografos 157 84 Athens, Greece Received: 7 October 2008 – Revised: 1 December 2008 – Accepted: 1 December 2008 – Published: 7 January 2009
Abstract. The power law relation between the stress drop of “non thrust” earthquakes and the lead time of precursory Seismic Electric Signals (SES), obtained by Dologlou (2008a), has been tested by using additional data from the most recent earthquake that occurred on 8 June 2008, in Andravida, NW. Peloponnesus, Greece and from two other destructive earthquakes that occurred in the past in Ionian sea. A critical exponentα=0.33 is derived which is close to the one (e.g. 0.29) reported by Dologlou (2008a). The above preliminary result strengthens the hypothesis that probably signatures of criticality are present in the earth-quake preparation and precursory SES processes and that both phenomena are governed by same physics.
1 Introduction
Low frequency (<1 Hz) transient changes of the electrotel-luric field, the so called Seismic Electric Signals (SES), have been monitored at different sites in Greece since 1981 and were found to precede large earthquakes (Varotsos and Alex-opoulos, 1984a, b; Varotsos et al., 1986). The SES signals are characterized by some features as: the selectivity, which states that a SES station can be sensitive to specific seismic areas at long distances and inactive to some others at shorter distances; the lead time,1t, which is the time difference be-tween the SES detection and the earthquake occurrence with a lead time span of few months (Varotsos and Alexopoulos, 1984a, b, 1987; Varotsos et al., 1993). To distinguish the SES signal from artificial noise the criterion1V /L=constant is applied, where1V is the potential difference between two points on the ground at a distanceLmeasured by a pair of buried electrodes (Varotsos and Alexopoulos, 1984a; Sarlis
Correspondence to: E. Dologlou
et al., 1999; Varotsos et al., 1998, 2003). (This distinc-tion is alternatively achieved by using the criteria based on a new time domain, termed the “natural time”, see Varotsos et al. (2004) and references therein). The quantity1V /Lis the SES amplitudeEwhich is connected to the magnitudeM of the impending earthquake by the experimental formula:
logE=αM+b (1)
wherea≈0.3−0.4 andbis a site constant. This in fact is a power law relation that is reminiscent of the theory of critical phenomena (Varotsos and Alexopoulos, 1984a, b; Varotsos, 2005).
Before an earthquake, the pressure increases in the future focal area and produces changes in various physical prop-erties like porosity, conductivity (Varotsos, 1981), dielectric constant (Varotsos, 1978, 1980), etc. In addition, it affects the relaxation time of electric dipoles which are formed in an ionic solid between introduced aliovalent impurities (Varot-sos and Miliotis, 1974) and vacancies created for charge compensation (Varotsos and Mourikis, 1974; Kostopoulos et al., 1975). This relaxation time,τ, is given by the equation
τ =(λν)−1exp(g/ kT ) (2)
whereνis the attempt frequency for a jump to a number of λaccessible paths (Varotsos and Alexopoulos, 1980a, 1981) in the vacancy vicinity,T is the temperature andgthe Gibbs energy for the orientation process.
As the pressure increases the relaxation time becomes significantly smaller, provided that the migration volume v=(dg/dP)T (Varotsos et al., 1982, 1999) or the activation
(Varotsos and Alexopoulos, 1980b) is negative, and when the pressure reaches a critical value, Pcr, a transient
cur-rent is emitted due to the cooperative re-orientation of dipoles (Varotsos and Alexopoulos, 1986).
L W
PIR
Peloponnesus
Andravida
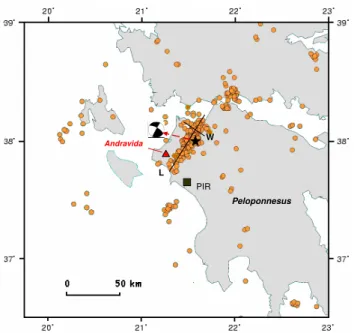
Fig. 1a. Map of Western Greece, with the distribution (forming a
cluster) of all reported by USGS aftershocks withMw≥3 (a) for Andravida earthquake (8 June 2008) for the period 8 June 2008 to 20 September 2008 (b) for Strofades earthquake (18 November 1997) for the period 18 November 1997 to 31 May 1998 and (c) for Killini earthquake (16 October 1988) for the period 16 October 1988 to 1 March 1989. The epicentres of the corresponding main shocks are presented by stars and their focal mechanisms by a lower hemisphere projection with black and white quadrants for compres-sion and dilatation, respectively (beach ball). Representative after-shock areas of lengthLand widthWfor all cases are marked. Black squares denote the position of the SES station of PIR and IOA and red triangles the cities of Andravida and Killini.
leads to an exponent of 0.3–0.4 for critical phenomena (Surkov et al., 2002). Alternatively, Sornette et al. (1989) support the hypothesis that fracture processes exhibit criti-cal behavior expressed by a power law relation with criticriti-cal exponent values of 0.33 and 0.47 for 2 and 3 dimensions, respectively.
In previous papers by Dologlou (2008a, b) a power law relation with fractal critical exponent has been obtained be-tween the earthquake stress drop and the SES lead time. Stress drop is an earthquake parameter which basically re-flects the difference between two states of stress at a point on a fault before and after rupture (Kanamori and Anderson, 1975).
It is of great interest and the purpose of the present work to check the validity of this relation by using additional data from three destructive earthquakes which occurred in Greece, the first in Andravida on 8 June 2008, the second in Strofades on 18 November 1997 and the third in Killini on 16 October 1988.
Fig. 1b. Continued.
2 Data and analysis
In previous papers (Dologlou, 2008a, b) we referred to earth-quakes for which Brune’s stress drop values have been re-ported in literature. In this work, in order to extend our data set, we tried to overcome the lack of published stress drop values for some events by using an indirect method based on the aftershock area (Kiratzi et al., 1991). This technique can be only applied to strong and shallow earthquakes (i.e. M>5.8 depth<40 km) since a rich aftershock sequence is re-quired to well define the aftershock area. Thus, earthquakes of considerable depth such as the two large events which oc-curred in Greece on 8 January 2006 withMw=6.7 and depth
h=66 km in Kithira and on 6 January 2008 withMw=6.2 and
h=75 km in Leonidio, can not be treated with this method. On 8 June 2008 at 12:25 UTC an earthquake of magnitude Mw=6.3 occurred in Andravida (37.9 N 21.5 E) NW of
Pelo-ponnesus, Greece (Fig. 1a) and caused severe damage and human losses. It was preceded by a SES activity recorded at PIR station (Fig. 1a) on 29 February 2008 which was pub-lished on 29 May 2008 (Sarlis et al., 2008). The lead time of this event was1t=98 days. Additionally on 18 November, 1997 at 14:07 UTC a strong earthquake ofMw=6.6 occurred
near Strofades island (37.33 N 20.84 E) in Ionian sea and it was preceded by a SES activity at IOA station on 4 October 1997 with1t=45 days. Furthermore, on 16 October 1988 at 12:34 UTC a damaging earthquake ofMw=5.9 occurred near
Table 1. The updated version of the table reported by Dologlou (2008a) including Andravida, Strofades and Killini cases (events no. 16, 9
and 5). All 16 earthquakes are presented with available stress drop values and precursory SES signals in Greece from 1981 to 2008, along with their dates, epicentres, depths, moment magnitudesMw , stress drop values (1σB), SES station, SES lead times1tand mechanism type (strike-slip, normal or thrust). Events are numbered in chronological order and references for the stress drop values are given in the last column.
n yy mm dd H min S Lat Long Depth Mw 1σB SES Source References
(km) bars 1t(days) mechanism
1 81 12 19 14 10 50.7 39.24 25.23 12 6.8 9.01 0.3 strike-slip Dologlou (2008a)
2 82 01 18 19 27 24.5 40 24.32 6 6.6 10.5 0.3 strike-slip Dologlou (2008a)
3 83 01 17 12 41 29 38.09 20.19 10 6.9 14.0 1.8 strike+thrust Stavrakakis and Blionas (1990)
4 86 09 13 17 24 34 37.03 22.2 15 5.9 5.0 5 normal Papazachos et al. (1988)
5 88 10 16 12 34 06 37.95 20.90 29 5.9 2.53 17.5 strike-slip see text
6 95 05 04 0 34 11 40.54 23.63 15 5.4 2.5 28.5 normal Chouliaras-Stavrakakis (1997)
7 95 05 13 8 47 15 40.16 21.67 15 6.5 6.3 25.5 normal Chouliaras-Stavrakakis (1997)
8 95 06 15 0 15 56 38.1 22.46 15 6.5 2.9 46 normal Chouliaras-Stavrakakis (1997)
9 97 11 18 14 7 53 37.33 20.84 22.9 6.6 1.42 45 strike slip see text
10 99 09 07 11 56 56 37.97 23.6 15 6 3.0 6 normal Stavrakakis-Chouliaras (2002)
11 01 07 26 0 21 44 38.96 24.29 15 6.5 9.0 130 strike-slip Benetatos et al. (2002)
12 03 08 14 5 15 8 38.7 20.67 15 6.3 8.0 6 strike-slip Papadimitriou (2007)
13 08 01 06 5 14 20 37.22 22.69 75 6.2 9.0 60 thrust+strike Papadimitriou (2008)
14 08 02 04 20 25 9.5 38.08 21.94 20 5 1.6 25 strike-slip Papadimitriou (2008)
15 08 02 14 10 9 22.7 36.5 21.67 29 6.9 9.0 30 thrust Papadimitriou (2008)
16 08 06 08 12 25 29.7 37.96 21.52 16 6.3 1.83 98 strike-slip see text
Since stress drop values for these events were not avail-able in literature, the Brune’s stress drop (Brune, 1970, 1971) has been calculated using the formula by Hanks and Wyss (1972):
1σB=0.44Mo/r3 (3)
whereMois the seismic moment andr the radius for a
cir-cular fault derived fromP andSteleseismic waves displace-ment spectra. In our case, the radius r is estimated from the dimensions of the aftershock area according to Kiratzi et al. (1991) for the three events as follows:
All aftershocks of Andravida, Strofades and Killini earth-quakes with Mw≥3 reported by USGS for the periods, 8
June 2008 (12:30) to 20 September 2008, 18 November 1997 (14:07) to 31 May 1998 and 16 October 1988 (12:34) to 1 March 1989, respectively are shown on three separate maps in Figs. 1a,b, and c, along with their main shock epi-centres, denoted by a star and their focal mechanisms pre-sented by a beach ball. From the distribution of the af-tershock epicentres, which forms a well defined cluster, an area S=L×W with lengthL and width W is estimated in all cases (Fig. 1a, b, c). For Andravida event the range of values for L and W, due to estimation error, is con-sidered as (60–70) km and (18–22) km, for Strofades earth-quake (80–90) km and (30–38) km and for Killini (35–40) and (8–12), respectively . The radius r is obtained from the relationS=π r2. Two slightly different seismic moment values M01=3.9×1025dyn. cm M02=3.1×1025dyn. cm are
I o n i a n S e a
IOA
G R E E C E
L W
Killini
Table 2. The date, the magnitudeMwand the seismic moment of Andravida earthquake along with the range of values in the dimensions of the aftershock areaLandW, and the corresponding calculated values for1σB. Mean values are given in the last row.
Date Mw Mo (1025dyn. cm) L(km) W(km) 1σB(bars)
yy mm dd
08 06 08 6.3 3.9 60–70 18–22 2.6–1.58
3.1 60–70 18–22 2.14–1.26
Mean value 3.5 65 20 1.83
w
L
Athens
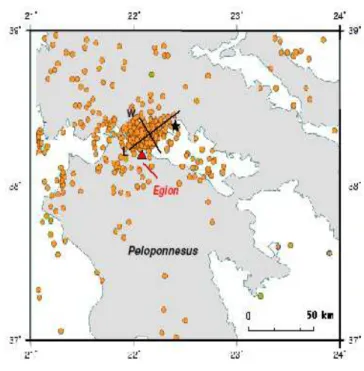
Fig. 2a. Map of central Greece with the distribution (forming a
cluster) of the all reported by USGS aftershocks withMw≥3 (a) for Athens earthquake (7 September 1999) for the period 7 September 1999 to 7 September 2000 and (b) for Egion earthquake (15 June 1995) for the period 15 June 1995 to 15 June 1996. The epicentres of the corresponding main shocks are presented by stars. Represen-tative aftershock areas of lengthLand widthWfor both cases are marked. Red triangles denote the position of the cities of Athens and Egion, respectively.
reported for Andravida by USGS while for Strophades and Killini events the seismic moment is 9×1025dyn. cm and 7.5×1024dyn. cm, respectively. The stress drop1σB is
cal-culated through Eq. (3) in all cases (Tables 2, 3 and 4). The critical exponent α in the power law relation between the stress drop and the lead time is derived from the list (Ta-ble 1) of1σBand1tvalues of all “non thrust” earthquakes,
included the Andravida, Strofades and Killini events. It is difficult to give an explanation why earthquakes of thrust type mechanism do not obey the power law relationship. A very tentative suggestion could be the fact that geodynamics of thrust mechanism are quite different from those of other
Fig. 2b. Continued.
mechanisms (i.e., normal, strike-slip). Earthquakes of thrust type usually occur in collision or subduction zones which are characterized by high accumulation of strain.
Table 1 is the updated version of the table reported by Dologlou (2008a) by adding Andravida, Strofades and Killini earthquakes (events no. 16, no. 9 and no. 5), and in-cludes all sixteen earthquakes numbered in chronological or-der along with their seismic parameters (dates, epicentres, depths, moment magnitudesMw), source mechanism
(strike-slip, normal or thrust type), stress drop1σB and SES lead
Table 3. The date, the magnitudeMwand the seismic moment of Strofades earthquake along with the range of values in the dimensions of the aftershock areaLandW, and the corresponding calculated values for1σB. Mean values are given in the last row.
Date Mw Mo (1025dyn. cm) L(km) W(km) 1σB(bars)
yy mm dd
97 11 18 6.6 9 80–90 30–38 1.88–1.10
Mean value 85 34 1.42
Table 4. The date, the magnitudeMw and the seismic moment of Killini earthquake along with the range of values in the dimensions of the aftershock areaLandW, the corresponding calculated values for1σB, the critical exponentαand associated correlation coefficientR. Mean values are given in the last row.
Date Mw Mo (1025dyn. cm) L(km) W(km) 1σB(bars) α R
yy mm dd
88 10 16 5.9 0.75 35–40 8–12 3.9–1.77 0.32–0.34 0.80–0.79
Mean value 37.5 10 2.53 0.33±0.1 0.80
Table 5. Date, epicenters, magnitudeMw, seismic moment Mo, range of values in the dimensions of the aftershock areaLandW, corre-sponding calculated values for1σB, mean value1σBmeanand reported1σBfor Egion and Athens earthquakes.
EQ Date Lon (N) Lat (E) Mw Mo L(km) W(km) 1σB 1σBmean 1σB
yy mm dd (1025dyn. cm) (calclulated) (bars) (reported)
(bars) (bars)
Egion 95 06 15 38.4 22.3 6.5 6 45–50 25–30 3.9–2.5 3.2 2.9
Athens 99 09 07 38.1 23.6 6 1.1 20–35 20–25 3.4–1.05 2.2 3.0
The value range for the estimated dimensionsLandWand the corresponding calculated stress drop1σBfor Andravida,
Strofades and Killini events, are given in Tables 2, 3 and 4, respectively. The derived critical exponentαwith the asso-ciated correlation coefficient are shown in Table 4. A mean value ofαwith its error is also inserted.
Event no. 11 is excluded from the present paper for the same reasons referred by Dologlou (2008a) and thoroughly discussed by Dologlou et al. (2008). Briefly, this earthquake, with an unusual long lead time, occurred in an area which is characterized by specific structural features such as small thickness of the crust (Le Pichon et al., 1984) and high heat flow rate (Jongsma, 1974).
3 Discussion
In order to check the compatibility between the reported Brune’s stress drop values and those derived by using the dimensions of the aftershock area we tested two well known
for the severe casualties and victims cases, the Athens earth-quake on 7 September 1999 and the Egion earthearth-quake on 15 June 1995.
The USGS seismic moment value for the fist event was Mo1=1.1×1025dyn. cm and for the second
Mo2=6×1025dyn. cm. The space distribution of all reported
by USGS aftershocks withMw≥3 for the period 7
Septem-ber 1997 to 7 SeptemSeptem-ber 2000, for Athens earthquake and from 15 June 1995 to 15 June 1996, for Egion (Fig. 2a, b), define the corresponding areas with dimensions L andW. In a similar way to Andravida Strofades and Killini cases, we calculated the stress drop for the upper and the lower limit of the value range ofLandW, for both events, as well as their mean value1σBmeanand the results along with the
reported Brune’s stress drop values are given in Table 5. A comparison between the reported and calculated 1σB for
B = 8.33 t-0.33
R=0.80
0 2 4 6 8 10 12 14 16
0 20 40 60 80 100 120
t (days)
B
(b
a
rs
)
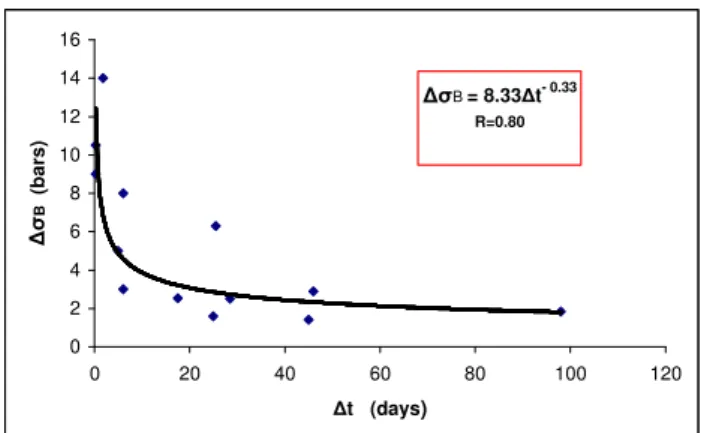
Fig. 3. The plot of the relation between the stress drop and the lead
time of all “non thrust” earthquakes, including the Andravida, Stro-fades and Killini data, which are listed in Table 1. Event no. 11 is excluded. The derived power law equation along with the corre-sponding correlation coefficientR are displayed on the top of the diagram.
derived power law relation between the stress drop and the lead time values of all “non thrust” earthquakes, (except event no. 11), listed in Table 1, is given by the formula:
1σB=8.331t−0.33 (4)
which is close to the one obtained by Dologlou (2008a). Ad-ditionally, is notable from Table 4 that even when the value range ofLandWis considered, the critical exponentαis not considerably affected and varies within the limits 0.32–0.34 with a correlation coefficientR>0.79 in all cases.
The following comment might be worthwhile to be added. After the SES recording, upon studying the order parameter of seismicity defined in the natural time domain (Varotsos et al., 2005), the time-window of an impending main shock can be shortened to a few days. Since this parameter is just the power spectrum in natural time (for frequencies close to zero) of the seismicity evolving in the area suspected for the occurrence of the main shock, on the basis of SES prop-erties, it might reveal a deep interconnection between the lead time and seismological parameters confirming the above mentioned power law relation of Eq. (3) between1σB and
1t.
4 Conclusions
New data from the destructive Andravida, Strofades and Killini earthquakes were used to test the credibility of the obtained by Dologlou (2008a) critical exponent α=0.29 in the power law relation between the stress drop and the precursory SES lead time for “non thrust” earthquakes. The new derived critical exponent valueα=0.33, after including the Andravida, Strofades and Killini events, with correlation coefficientR=0.80, is close to the previous one reported by Dologlou (2008a). This experimental result strengthens the
hypothesis that signatures of criticality might be present in the SES generation and the earthquake preparation indicat-ing that probably both processes are governed by the same physics. The accumulation of additional data in the future will check the degree of the validity of these preliminary findings.
Edited by: M. Contadakis
Reviewed by: S. Uyeda and another anonymous referee
References
Benetatos, C., Roumelioti, Z., Kiratzi, A., and Melis, N.: Source parameters of theM6.5 Skyros island (North Aegean Sea) earth-quake of July 26, 2001, Ann. Geophys., 45, 513–526, 2002, http://www.ann-geophys.net/45/513/2002/.
Brune, J.: Tectonic stress and the spectra of seismic shear waves, J. Geophys. Res., 75, 4997–5009, 1970.
Brune, J. N.: Correction, J. Geophys. Res., 76, 5002, 1971. Chouliaras, G. and Stavrakakis, G.: Seismic source parameters
from a new dial-up seismological network in Greece, Pure Appl. Geophys., 150, 91–111, 1997.
Dologlou, E.: Power law relationship between parameters of earth-quakes and precursory electrical phenomena, Nat. Hazards Earth Syst. Sci., 8, 977–983, 2008,
http://www.nat-hazards-earth-syst-sci.net/8/977/2008/.
Dologlou, E.: Possible relationship between Seismic Electric Sig-nals (SES) lead time and earthquake stress drop, Proc. Jpn. Acad., Ser. B, 84, 117–122, 2008b.
Dologlou, E., Hadjicontis, V., and Mavromatou, C.: Electrical pre-cursors of earthquakes in Aegean Sea during the last decade (1997–2007), Nat. Hazards Earth Syst. Sci., 8, 123–128, 2008, http://www.nat-hazards-earth-syst-sci.net/8/123/2008/.
Hanks, T. and Wyss, M.: The use of body wave spectra in the deter-mination of seismic source parameters, Bull. Seism. Soc. Am., 62, 561–589, 1972.
Ishido, T. and Mizutani, H.: Experimental and theoretical basis of electrokinetic phenomena in rock-water systems and its applica-tions to geophysics, J. Geophys. Res., 86, 1763–1775, 1981. Jongsma, D.: Heat Flow in the Aegean Sea, Geophys. J. Int., 37(3),
337–346, 1974.
Kanamori, H. and Anderson, D.: Theoretical basis of some empir-ical relations in seismology, Bull. Seism. Soc. Am., 65, 1073– 1095, 1975.
Kiratzi, A. A., Wagner, G. S., and Langston, C. A.: Source Pa-rameters of Some Large Earthquakes in Nortern Aegean Deter-mined by Body Waveform Inversion, Pure Appl. Geophys. (PA-GEOPH), 135, 515–527, 1991.
Kiratzi, A. A., Karakaisis, G. F., Papadimitriou, E. E., and Pa-pazachos, B. C.: Seismic-Source Parameter Relations for Earth-quakes in Greece, Pure Appl. Geophys. (PAGEOPH), 123, 27– 41, 1985.
Kostopoulos, D., Varotsos, P., and Mourikis, S.: Conductivity of crystalline NaI, Can. J. Phys., 53, 1318–1320, 1975.
A. H., Geol. Soc. London, SP. Publ. No. 17, Blackwell Scientif. Pub., Oxford, 727–741, 1984.
Mizutani, H., Ishido, T., Yokokura, T., and Ohnishi, S.: Electroki-netic phenomena associated with earthquakes, Geophys. Res. Lett., 3, 365–368, 1976.
Papazachos, B., Kiratzi, A., Karakostas, B., Panagiotopoulos, D., Scordilis, E., and Mountrakis, D.: Surface Fault Traces, Fault Plane Solution and Spatial Distribution of the Aftershocks of the September 13, 1986 Earthquake of Kalamata (Southern Greece), Pure Appl. Geophys. (PAGEOPH), 126, 55–68, 1988.
Sarlis, N., Lazaridou, M., Kapiris, P., and Varotsos, P.: Numerical model of the selectivity effect and the1V /Lcriterion, Geophys. Res. Lett., 26, 3245–3248, 1999.
Sarlis, N., Skordas, E., Lazaridou, M., and Varotsos, P.: Investiga-tion of the seismicity after the initiaInvestiga-tion of a Seismic Electric Sig-nal activity until the main shock arXiv:cond mat /0802.3329v4, 2008.
Sornette, D., Lagier, M., Roux, S., and Hansen, A.:Critical piezo-electricity in percolation, J. Physique, 50, 2201–2216, 1989. Stavrakakis, G. and Blionas, S.: Eastern Mediterranean Region
Based on an Iterative Maximum Entropy Technique, Pure Appl. Geophys. (PAGEOPH), 132, 679–698, 1990.
Stavrakakis, G., Chouliaras, G., and Panopoulou, G.: Seis-mic Source Parameters for the ML=5.4 Athens Earthquake (7 September 1999) from a New Telemetric Broad Band Seismo-logical Network in Greece, Nat. Hazards, 27, 47–60, 2002. Surkov, V., Uyeda, S., Tanaka, H., and Hayakawa, M.: Fractal
Prop-erties of medium and seismoelectric phenomena, J. Geodyn., 33, 477–487, 2002.
Varotsos, P. A.: An estimate of the pressure dependence of the di-electric constant in alkali halides, Phys. Status Solidi B, 90, 339– 343, 1978.
Varotsos, P.: Determination of the dielectric constant of alkali halide mixed crystals, Phys. Status Solidi B, 100, 133-138, 1980. Varotsos, P.: Determination of the composition of the maximum
conductivity or diffusivity in mixed alkali halides, J. Phys. Chem. Solids, 42, 405–407, 1981.
Varotsos, P. A.: The Physics of Seismic Electric Signals, TerraPub, Tokyo, ISBN:4-88704-136-5, 2005.
Varotsos , P. A. and Mourikis, S. : Difference in conductivity be-tween LiD and LiH crystals, Phys. Rev. B, 10, 5220–5224, 1974. Varotsos, P. and Miliotis, D.: New aspects on the dielectric proper-ties of the alkali halides with divalent impuriproper-ties, J. Phys. Chem. Solids, 35, 927–930, 1974.
Varotsos, P. and Alexopoulos, K. : Migration entropy for the bound fluorine motion in alkaline earth fluorides, J. Phys. Chem. Solids, 41, 443–446, 1980a.
Varotsos, P. and Alexopoulos, K.: Negative activation volumes of defects in solids, Phys. Rev. B, 21, 4898–4899, 1980b.
Varotsos, P. and Alexopoulos, K. : Migration parameters for the bound fluorine motion in alkaline earth fluorides, II, J. Phys. Chem. Solids, 42, 409–410, 1981.
Varotsos, P. and Alexopoulos, K.: Physical properties of the vari-ations of the electric field of the earth preceding earthquakes, I, Tectonophysics, 110, 73–98, 1984a.
Varotsos, P. and Alexopoulos, K.: Physical properties of the varia-tions of the electric field of the earth preceding earthquakes, II, Determination of epicentre and magnitude, Tectonophysics, 110, 99–125, 1984b.
Varotsos, P. and Alexopoulos, K.: Thermodynamics of Point De-fects and their Relation with the Bulk Properties, edited by: Amelinckx, S., Gevers, R., and Nihoul, J., North Holland, Ams-terdam 1986.
Varotsos, P. and Alexopoulos, K.: Physical properties of the varia-tions in the electric field of the earth preceding earthquakes, III, Tectonophysics, 136, 335–339, 1987.
Varotsos, P., Alexopoulos, K., and Nomicos, K.: Comments on the pressure variation of the Gibbs energy for bound and unbound defects, Phys. Status Solidi B, 111, 581–590, 1982.
Varotsos, P., Alexopoulos, K., and Lazaridou M.: Latest aspects of earthquake prediction in Greece based on Seismic Electric Sig-nals, II, Tectonophysics, 224, 1–37, 1993.
Varotsos, P., Sarlis, N., and Lazaridou, M.: Interconnection of the defect parameters and stress induced electric signals in ionic crystals, Phys. Rev. B, 59, 24–27, 1999.
Varotsos, P., Sarlis, N., and Skordas, E.: Electric fields that “arrive” before the time-derivative of the magnetic field prior to major earthquakes, Phys. Rev. Lett., 91, 148501, doi:10.1103/PhysRevLett.91.148501, 2003.
Varotsos, P., Sarlis, N., and Skordas, E.: Seismic Electric Signals and 1/f noise in natural time , arXiv:cond mat: 0711.3766v1, 23 November 2007.
Varotsos, P., Sarlis, N., and Skordas, E.: Seismic Electric Signals and 1/f noise in natural time, arXiv:cond mat:0711.3766v3, 1 February 2008.
Varotsos, P., Alexopoulos, K., Nomicos, K., and Lazaridou, M.: Earthquake prediction and electric signals, Nature (London), 322, p. 120, 1986.
Varotsos, P., Sarlis, N., Lazaridou, M., and Kapiris, P.: Transmis-sion of stress induced electric signals in dielectric media, J. Appl. Phys., 83, 60–70, 1998.
Varotsos, P. A., Sarlis, N. V., Skordas, E. S., and Lazaridou, M. S.: Entropy in the natural time-domain, Phys. Rev. E., 70, 011106, doi: 10.1103/PhysRevE.70.011106, 2004.