RISCOS E BENEF´ICIOS NA EXPLORA ¸C ˜AO DE RECURSOS POR CUPINS (INSECTA: ISOPTERA)
Tese apresentada `a Universidade Fede-ral de Vi¸cosa, como parte das exigˆencias do Programa de P´os-gradua¸c˜ao em Ento-mologia, para obten¸c˜ao do t´ıtulo de Doc-tor Scientiae.
VI ¸COSA
RISCOS E BENEF´ICIOS NA EXPLORA ¸C ˜AO DE RECURSOS POR CUPINS (INSECTA: ISOPTERA)
Tese apresentada `a Universidade Fede-ral de Vi¸cosa, como parte das exigˆencias do Programa de P´os-gradua¸c˜ao em Ento-mologia, para obten¸c˜ao do t´ıtulo de Doc-tor Scientiae.
APROVADA: 06 de julho de 2009
Prof. Carlos Ernesto Gon¸calves Reynaud Schaefer
Prof. Carlos Frankl Sperber .
Prof. Ronaldo Reis J´unior .
Prof. Simon Luke Elliot (Co-orientador)
Dedicat´
oria
Ao Nithin Mathews,
sempre presente!
De tudo resta o trajeto.
E o apredizado deixado por cada encontro, Cadapedra, cadacurva, cada a l v o r a d a.
Agradecimentos
Agrade¸co aos meus pais Ruth e Aloisio por tudo, sempre amorosos e confiantes!
Agrade¸co aos meus sogros, Moms e Pappa, todo o carinho, dedica¸c˜ao e apoio.
Minha gratid˜ao ao Nithin, meu amor, meu amigo e meu esteio! Aquele que esteve presente em tudo, nas coletas, nas an´alises e nas revis˜oes dos textos. Incans´avel em me lembrar a cada dia de que eu seria capaz de concluir essa jornada.
Aos amigos Dj´u, Eric, Fred, Cris, Amanda e Ronaldo, muito obrigada pelo carinho e aten¸c˜ao.
Agrade¸co ao professor Johan Billen pela acolhida generosa, pela oportu-nidade preciosa e pela quase surpresa!
Agrade¸co aos colegas e amigos do Laborat´orio de Entomologia da Uni-versidade Cat´olica de Leuven, Lien e Eric, Wim, An, Am`elie, Uli e Tom pela acolhida e por toda a experiˆencia cultural que vivi entre maio de 2007 e maio de 2008. A An agrade¸co especialmente por providenciar os cortes necess´a-rios `a microscopia de varredura. E a Lien e An por desvendarem pra mim todos mist´erios das t´ecnicas de seccionamento e por in´umeras vezes salvarem minhas lˆaminas, sempre esquecidas no “heating plate”.
`
A Iracenir Andrade dos Santos pela gentil colabora¸c˜ao na identifica¸c˜ao das formigas.
estagi´arios que passaram pelo labor´atorio colaborando com a coletas de dados entre outros: Jos´e Hil´ario, Juliana e Raul.
Aos queridos prof. Eraldo R. Lima e Nerilda, pela amizade e carinho. Ao prof. Ronaldo Reis-Jr, agrade¸co por sempre estar disposto a discutir e aconselhar sobre quest˜oes estat´ıticas, contribu´ındo de maneira fundamental para a realiza¸c˜ao desse trabalho.
Mais uma vez exponho minha gratid˜ao ao prof. Og F. F. DeSouza. Um mestre paciente e acess´ıvel, mas rigoroso. Agrade¸co-o ainda por confiar no meu trabalho e por me ensinar entre outros, a contar as palavras em uma frase!
`
A coordena¸c˜ao do programa de p´os-gradua¸c˜ao em Entomologia pela ex-celˆencia, e `a D. Paula e `a Miriam pela cortesia e eficiˆencia.
Biografia
Teresa Telles Gon¸calves Mathews, filha de Ruth Helena Telles da Silva e Aloisio Antˆonio Gon¸calves, nasceu em Belo Horizonte, Minas Gerais, em 06 de dezembro de 1978.
Em julho de 2003, graduou-se em Engenharia Florestal, pela Universidade Federal de Lavras (UFLA), Lavras-MG. Durante o per´ıodo de gradua¸c˜ao, de 1999 a 2003, foi estagi´aria do Setor de Ecologia do Departamento de Ciˆencias Biol´ogicas da UFLA.
Em agosto de 2003, iniciou o curso de Mestrado em Entomologia, na Universidade Federal de Vi¸cosa (UFV), Vi¸cosa-MG, defendendo a tese em Julho de 2005.
Conte´
udo
P´agina
Lista de Figuras . . . ix
Lista de Tabelas . . . xiii
Resumo . . . xv
Abstract . . . xvi
1 Introdu¸c˜ao Geral . . . 1
1.1 Apresenta¸c˜ao . . . 1
1.2 O uso de recursos alimentares por cupins . . . 3
1.2.1 Mecanismos decorrentes do aumento de recursos determinando a riqueza de especies local de cupins . . . 5
2 Termite species richness non-response to resource availabi-lity: true or false? . . . 10
Abstract . . . 11
2.1 Introduction . . . 12
2.2 Material & Methods . . . 13
2.2.1 Study area . . . 13
2.2.2 Sampling design . . . 14
2.2.3 Resource amount . . . 14
2.2.5 Termite sampling . . . 16
2.2.6 Data Analysis . . . 17
2.3 Results . . . 18
2.4 Discussion . . . 23
3 Bark roughness ruling presence and activity of arboreal termites (Isoptera: Termitidae) on trees . . . 27
Abstract . . . 28
3.1 Introduction . . . 29
3.2 Material & Methods . . . 30
3.2.1 Study area . . . 30
3.2.2 Sampling design & Data Collection . . . 30
3.2.3 Measurement of bark roughness . . . 31
3.2.4 Data Analysis . . . 33
3.3 Results . . . 35
3.4 Discussion . . . 38
4 Use of ground resources by arboreal termites (Isoptera:Termitidae) . . . 41
Abstract . . . 42
4.1 Introduction . . . 43
4.2 Material & Methods . . . 44
4.2.1 Study area . . . 44
4.2.2 Definition of terms . . . 45
4.2.3 Sampling design & Data collection . . . 45
4.2.4 Data Analysis . . . 46
4.3 Results . . . 47
4.4 Discussion . . . 52
5 A novel exocrine structure of the bicellular unit type in the thorax of termites . . . 56
5.1 Introduction . . . 58
5.2 Material & Methods . . . 59
5.3 Results . . . 60
5.4 Discussion . . . 64
6 Conclus˜ao Geral . . . 67
Lista de Figuras
P´agina
1 Processos ecol´ogicos determinantes da riqueza local de esp´ecies de cupins a partir do aumento de recursos. Os elementos destaca-dos em cinza representam as trˆes altera¸c˜oes poss´ıveis na riqueza de esp´ecies de cupins, devido ao aumento de recursos. Os difer-entes estilos de linhas no diagrama s˜ao meramente ilustrativos, objetivando apenas facilitar a visualiza¸c˜ao. . . 9 2 Schematic drawing of the sampling area. . . 15 3 Effect of the interaction between the activity of predatory ants
and the availability of total carbon in soil on the species richness of Apicotermitinae termites, Vi¸cosa - MG. Brasil. . . 19 4 Schematic ilustration on the routine to obtain the index of bark
5 Schematic ilustration on the routine to calculate the index of bark roughness. (right) Drawing of a schematic result from the imprint procedure performed in one portion of bark. (center) Drawing showing the fit of one black pixel per sub-quadrat if the distribu-tion of black pixels in the quadrat was uniform. (left) Drawing showing the placement of the sub-quadrats over the schematic original drawing to proceed the measurement of the mean and the variance of the number of black pixels in the sub-quadrats. . . 34 6 The effect of bark roughness on the probability of finding termites
on trees in State Park of rio doce, MG, Brazil. The higher the value of bark roughness index the rougher the tree bark. See Material & Methods for details. . . 37 7 Relationship between (toc) soil total organic carbon (%), and
the probability of arboreal termites occurrence in State park of Rio Doce, MG, Brazil, 2004. Using generalized linear mod-eling with Binomial errors and logit link function. In axis y (right), 0 is the lack of probability of arboreal termites rence and 1 is 100% of probability of arboreal termites occur-rence. While toc varied in x, (lfb) sum of the length of fallen branches (cm/m2), (ld) mean of litter depth (cm) were kept in its
average. Curves were built according to the main following equa-tion: Probability of arboreal termite occurrence = −6.3143809 +
0.0120037·lf b+ 0.3174563·ld+ 0.5180070·toc−0.0013140·lf b·ld
transformed by the anti-logit function e
equation
8 Relationship between (ld) mean of litter depth (cm) and the probability of arboreal termites occurrence in State park of Rio Doce, MG, Brazil, 2004. Using generalized linear mod-eling with Binomial errors and logit link function. In axis y (right), 0 is the lack of probability of arboreal termites rence and 1 is 100% of probability of arboreal termites occur-rence. While ld varied in x, curves for min, mean and max of lfb were built. The explanatory variable toc was kept in its av-erage. Curves were built according to the main following equa-tion: Probability of arboreal termite occurrence = −6.3143809 +
0.0120037·lf b+ 0.3174563·ld+ 0.5180070·toc−0.0013140·lf b·ld
transformed by the anti-logit function e
equation
1 +eequation. . . 50
Lista de Tabelas
P´agina
1 List of the termite (morpho)species and their respective subfa-mily and feeding habit recorded in seven forest remanescents in the surrounding of Vi¸cosa, MG, Brazil May 2006 and April/May 2007. Feeding habit definition follow Donovan et al. (2001), De-Souza & Brown (1994) as well as the observations made in this study. In the absence of full match at species level, the habit de-finition follows the most referred feeding habit for the respective genus. Termites were identified according to Constantino (1999) and Mathews (1977). . . 20 2 List of the ant species collected in the event of the risk of predation
experiment in seven forest remanescents in the surrounding of Vi¸cosa, MG, Brazil May 2006 and April/May 2007. . . 21 3 Analysis of deviance of the minimal adequate model showing the
4 Analysis of deviance of the minimal adequate model showing the effect of the interaction between the activity of predatory ants and the availability of total carbon in soil on the species richness of Apicotermitinae termites, Vi¸cosa - MG. Brasil, using glm with Quasipoisson errors and log link function. The site variable here refer to the two groups of sites after contrasting. The full model tested was Apicotermitinae richness = site + C * N * predation risk. . . 22 5 Analysis of deviance of the minimal adequate model showing the
effect of the interaction between the activity of predatory ants and the availability of total carbon in soil on the species richness of non-Apicotermitinae termites, Vi¸cosa - MG. Brasil, using glm with Poisson errors and log link function. The full model tested was Non Apicotermitinae richness = site + C * N * predation risk. 22 6 List of the termite species of the sampled on trees in State Park
of Rio Doce, MG, Brazil 2004. . . 36 7 Analysis of deviance of the minimal adequate model showing the
effect of the measured ground resources, sum of the length of fallen branches (cm/m2), mean of litter depth (cm) and soil total
organic carbon (%), on arboreal termite presence, using glm with Binomial errors and logit link function. . . 48 8 List of arboreal termite species occurence on the evaluated trees
species in State Park of Rio Doce, MG, Brazil 2004. The found termite species are Microcerotermes strunckii, Nasutiter-mes corniger, Nasutitermes minor and a non identified species of the genus Nasutitermes. . . 51 9 Survey of the known exocrine glands of termites, listed from head
Resumo
MATHEWS, Teresa Telles Gon¸calves, D. Sc., Universidade Federal de Vi-¸cosa, julho de 2009. Riscos e benef´ıcios na explora¸c˜ao de recursos por cupins (Insecta: Isoptera). Orientador: Og Francisco Fonseca de Souza. Co-orientadores: Angelo Pallini, Eraldo Rodrigues Lima, Paulo S´ergio Fi´uza e Simon Luke Elliot.
Abstract
MATHEWS, Teresa Telles Gon¸calves, D. Sc., Universidade Federal de Vi¸cosa, July, 2009. Risks and benefits of resource exploitation by termites (Insecta: Isoptera). Adviser: Og Francisco Fonseca de Souza. Co-advisers: Angelo Pallini, Eraldo Rodrigues Lima, Paulo S´ergio Fi´u- za and Simon Luke Elliot.
1
Introdu¸c˜
ao Geral
1.1
Apresenta¸c˜
ao
O objetivo dessa tese foi analisar os fatores determinantes da utiliza¸c˜ao de recursos por cupins, focando principalmente na varia¸c˜ao da disponibilidade de recursos alimentares e de riscos locais de preda¸c˜ao. Assim levantamos hi-p´oteses embasadas na habilidade de cupins escolherem por utilizar ou n˜ao um determinado recurso potencial dependendo dessas condi¸c˜oes em cada local.
A tese est´a dividida em sete se¸c˜oes. A se¸c˜ao 1, ou Introdu¸c˜ao Geral, est´a dividida em duas subse¸c˜oes. A subse¸c˜ao 1 consta da presente apresenta¸c˜ao. A subse¸c˜ao 2 ´e uma pequena introdu¸c˜ao, relacionando os insetos estudados e os fatores que determinam a utiliza¸c˜ao de um recurso alimentar em potencial. Al´em disso a subse¸c˜ao 2 aborda teoricamente como mecanismos decorrentes de intera¸c˜oes biol´ogicas hostis, originadas no aumento de recursos, podem determinar a riqueza local de esp´ecies de cupins. As quatro se¸c˜oes subse-quentes s˜ao compostas de um artigo cada, que tratam de maneira geral dos principais fatores que podem interferir na utiliza¸c˜ao de recursos por cupins.
preda-¸c˜ao n˜ao ´e o mesmo entre locais; e porque (iii) diferentes locais apresentam diferentes composi¸c˜oes de esp´ecies e distintos grupos de esp´ecies respondem diferentemente a esse balan¸co. Assim tal inconsistˆencia ocorreria porque a resposta em cada local ´e dependente do grupo que ali predomina. Para isso testamos as seguintes predi¸c˜oes: (i) a riqueza de esp´ecies de cupim de um local depende da intera¸c˜ao entre a disponibilidade de recursos e do risco de preda¸c˜ao; e (ii) esp´ecies de cupins defendidos por soldados s˜ao menos sens´ı-veis `a intera¸c˜ao entre disponibilidade de recurso e risco de preda¸c˜ao do que esp´ecies de cupins sem soldados.
O segundo e terceiro artigos tratam do teste de duas hip´otese levantadas apartir da pergunta “Por que existem ´arvores n˜ao ocupadas por t´ermitas que sobem em ´arvores?”. E mostram como a qualidade e a quantidade de recursos podem influenciar a ocorrˆencia e atividade de cupins arbor´ıcolas. Especifi-camente testamos duas hip´oteses, uma em cada artigo: (i) quanto maior a rugosidade da casca de uma ´arvore maior ´e a probabilidade de ocorrˆencia de cupins; e (ii) cupins arbor´ıcolas s˜ao positivamente influenciados pelo au-mento da quantidade de recursos potenciais existentes no ch˜ao, pr´oximos `a ´arvore hospedeira. O terceiro artigo foi realizado em colabora¸c˜ao com ent˜ao estudante de inicia¸c˜ao cient´ıfica Juliana Lins onde testamos a hip´otese(i). E o quarto artigo ´e a apresenta¸c˜ao de uma nova vers˜ao do terceiro cap´ıtulo da minha tese de mestrado onde testamos a hip´otese(ii).
o Laborat´orio de Termitologia da UFV e o Laborat´orio de Entomologia da Universidade Cat´olica de Leuven, entre maio de 2007 e abril de 2008. Tal ex-periˆencia foi realizada com a concess˜ao de uma bolsa de estudos pela CAPES, no ˆambito Programa de Doutorado no Pa´ıs com Est´agio no Exterior.
Finalmente a sexta se¸c˜ao ´e uma Conclus˜ao Geral, onde foram resumidos os principais resultados obtidos nos quatro artigos citados acima. E a s´etima se¸c˜ao consta das Referˆencias Bibliogr´aficas utilizadas em toda a tese.
1.2
O uso de recursos alimentares por cupins
T´ermitas ou cupins s˜ao insetos sociais da ordem Isoptera, que somam cerca de 2.860 esp´ecies descritas (Constantino, 1999). Os recursos alimen-tares de t´ermitas s˜ao a madeira, seca ou em decomposi¸c˜ao, serrapilheira, solo, micro-ep´ıfitas e fungos (Wood, 1978). A celulose ´e considerada a base nutricional de t´ermitas e esta pode ser obtida em materiais de origem ve-getal nos seus v´arios est´agios de degrada¸c˜ao (Grass´e, 1982; Donovan et al., 2001). Os cupins, de uma forma geral, apresentam uma grande plasticidade na preferˆencia alimentar (Darlington, 1994), por´em poucas esp´ecies conso-mem mat´eria vegetal viva e estas necessitam de complementar sua dieta com mat´eria orgˆanica morta ou em decomposi¸c˜ao (Wood, 1978). Assim os cupins s˜ao considerados em geral como detrit´ıvoros. Al´em disso o substrato alimen-tar de muitas esp´ecies n˜ao ´e bem conhecido (Eggleton & Tayasu, 2001) e a especificidade alimentar de cada esp´ecie pode estar relacionada principal-mente com o valor nutricional do ´ıtem.
(herb´ıvoros). Isto ´e, os cupins ao se alimentarem n˜ao interferem na capaci-dade reprodutiva ou na sobrevivˆencia do organismo/produto consumido.
Segundo Korb & Linsenmair (2001), a busca por recurso alimentar (for-rageamento), se d´a de forma coletiva em cupins, sendo geralmente realizado dentro de t´uneis constru´ıdos dentro ou sobre o substrato (solo ou madeira), existindo poucas esp´ecies que realizam o forrageamento livre (Miura & Mat-sumoto, 1997). O forrageamento em cupins ´e um processo complexo, que inicia-se pela localiza¸c˜ao do recurso, seguida pela decis˜ao de ocupa¸c˜ao ou n˜ao deste recurso pelos demais indiv´ıduos da colˆonia. Para cupins que nidificam no pr´oprio substrato alimentar, como as esp´ecies da fam´ılia Kalotermitidae e os cupins ge´ofagos de ninhos subterrˆaneos (Krishna & Weesner, 1969), o custo de forrageamento tende a ser m´ınimo, mas em cupins que tˆem de buscar o alimento fora do ninho o forrageamento implica em um gasto de energia que pode representar um fator ecol´ogico limitante importante (Eggleton & Tayasu, 2001). Adicionalmente a estrat´egia de forrageamento em t´ermitas n˜ao ´e igual para todas as esp´ecies. Cupins de solo comoReticulitermes santo-nensis, na presen¸ca de um peda¸co de madeira constr´oem galerias direcionadas ao recurso (Reinhard et al., 1997), j´a o t´ermita arbor´ıcola Constrictotermes cyphergaster, quando chega ao solo, por interm´edio de uma galeria descen-dente, emite trilhas de forrageamento de forma alet´oria (Sousa-Souto et al., 1999).
Muitos fatores interferem no comportamento de forrageamento animal, impedindo que estes atinjam o m´aximo te´orico de sua eficiˆencia (Morse, 1980). T´ermitas forrageiam coletivamente e fatores como risco de preda¸c˜ao e disponibilidade de recurso s˜ao fundamentais na decis˜ao de permanˆencia ou abandono do local de forrageamento (Korb & Linsenmair, 2002).
funcional. Os mecanismos de defesa em cupins podem ser dividos em dois grupos, defesa qu´ımica e mecˆanica (Krishna & Weesner, 1969). Em alguns casos, a defesa qu´ımica possibilita que o cupim defenda-se do agressor sem o estabelecimento de um contato direto, j´a na defesa mecˆanica o contato ´e inevit´avel. Assim, como os mecanismos de defesa s˜ao diferentes, espera-se que o comportamento apresentado por esses diferentes grupos frente a situa-¸c˜oes de perigo, tamb´em o sejam. Sendo que tal varia¸c˜ao de comportamento esteja relacionada `as varia¸c˜oes na morfol´ogia das estruturas utilizadas para a percep¸c˜ao (sistema sensorial) e defesa dos cupins.
Concluindo, o sucesso de uma colˆonia depender´a da disponibilidade de recursos local e do risco relativo que cada colˆonia sofre para obten¸c˜ao desse recurso. Sendo que a relatividade do risco ´e determinada crucialmente pela capacidade competitiva e defensiva de cada esp´ecie.
1.2.1 Mecanismos decorrentes do aumento de recursos determi-nando a riqueza de especies local de cupins
Estes resultados intrigantes, nos levam a crer que, al´em do aumento na disponibilidade de recursos outros fatores estariam regulando aspectos da comunidade de cupins de um local. Al´em da simples descri¸c˜ao de uma comu-nidade, como definir o n´umero de esp´ecies de um local, o grau de estrutura¸c˜ao e a compreens˜ao dos processos que a definem tˆem sido um dos principais fo-cos dos estudos de ecologia de comunidades (Van Veenet al., 2006). Dentre os diversos processos que podem definir essa dinˆamica em uma comunidade, as intera¸c˜oes biol´ogicas entre indiv´ıduos ou popula¸c˜oes tˆem um papel fun-damental. Segundo Morse (1980) as intera¸c˜oes hostis existentes em uma comunidade, como preda¸c˜ao e competi¸c˜ao, exercem uma grande importˆan-cia na determina¸c˜ao de padr˜oes ecol´ogicos. Considerando a sua importˆanimportˆan-cia na estrutura¸c˜ao das comunidades, trataremos aqui apenas daqueles proces-sos originados nas intera¸c˜oes conflituosas entre indiv´ıduos e ou popula¸c˜oes biol´ogicas (veja Figura 1).
O aumento da quantidade de um recurso potencial, alimentar ou de ni-difica¸c˜ao, pode teoricamente aumentar, diminuir ou n˜ao alterar a riqueza de esp´ecies de cupins em uma comunidade. Quando o aumento do recurso corresponde ao aumento da disponibilidade de recurso alimentar no local (Figura 1, A), a comunidade de cupins pode responder pelo menos de duas maneiras: permitindo o aumento da abundˆancia dos cupins pr´e-existente no local (Figura 1, B) ou favorecendo o estabelecimento/funda¸c˜ao de novas colˆonias (Figura 1, C). Sendo que o segundo evento pode implicar tanto no aumento do n´umero de indiv´ıduos como no aumento do n´umero de esp´ecies local, caso a funda¸c˜ao seja de uma esp´ecie nova (Figura 1, D).
pelo h´abito territorialista das esp´ecies (veja por exemplo Adams & Levins, 1987), j´a que a competi¸c˜ao por explora¸c˜ao de alimentos parece improv´avel dada a alta abundˆancia natural de seu alimento base, a celulose (Krishna & Weesner, 1969). Assim, o conflito gerado na defesa do territ´orio entre as colˆonias, intensificado pelo aumento populacional local, geraria uma taxa de perda de indiv´ıduos ocasionando o enfraquecimento das colˆonias (Figura 1, G e H). Quando a perda de indiv´ıduos ´e proporcional para todas as popula-¸c˜oes (Figura 1, I), a riqueza final ap´os o aumento do recurso tende a ser a mesma (Figura 1, V). Entretanto se essa perda ´e desigual (Figura 1, T), di-minuindo a equitabilidade da comunidade (balan¸co do n´umero de indiv´ıduos em cada popula¸c˜ao), a estrutura dessa comunidade ´e enfraquecida proporci-onando o aumento da chance de uma extin¸c˜ao local (Figura 1, L), de origem determin´ıstica ou estoc´astica, que resultaria na diminui¸c˜ao da riqueza local de esp´ecies de cupins (Figura 1, M). A diminui¸c˜ao da riqueza local, por sua vez, alivia a intensidade da competi¸c˜ao (Figura 1, N), aumentando nova-mente a disponibilidade do alimento (Figura 1, A), e atribuindo ao processo a caracter´ıstica de ciclicidade.
Aumento de recurso no local.
(A) Aumento da disponibilidade de alimento para cupins no local. (O) Aumento da disponibilidade de
sítios de nidificação, novos habitats e novos itens alimentares.
(C) Estabelecimento de um casal real de cupim. (P) Estabelecimento de um
predador.
(B) Aumenta a abundância de cupins no local.
(Q) Aumenta a atividade de predador no local. (Especialista e/ou generalista)
(J) Cupim é predado. (perda de indivíduos) (R) Cupim percebe a ativi−
dade do predador e foge.
(S) Abandono do local.
(H) Diminuição da abundância de cupins no local.
(V) Mudança no hábito forrageiro. (ex: de diurno para noturno)
(E) Aumento do número de encontros entre cupins e favorendo a ocor− rência de interações entre indivíduos.
(F) Competição.
(G) Perda de indivíduos; enfraquecimento da colônia.
(T) Diminuição desigual entre as populações (− equitabilidade ). Enfraquecimento da
estrutura da comunidade.
(I) Diminuição proporcional das populações.
(N) Diminuição da intensidade de competição e ou diminuição da sobreposição do uso de recursos. (L) Perda de populações inteiras.
(D) A riqueza de espécies de cupim aumenta.
(M) A riqueza de espécies de cupim diminui. (M) A riqueza de espécies
de cupim não se altera.
Termite species richness non-response to resource
availability: true or false?
Teresa Telles Gon¸calves1 and Og DeSouza2,
Abstract
Generally the number of species that coexist in a certain site have a positive relationship to resource availability. However this is not always true: resource availability may also lead to reduction or no changes on termite richness. Among alleged reasons for the inconsistency in the reported responses of termite richness to resource availability, the interaction between resource availability and predation stand as fundamental. Therefore we hypothesize that such a inconsistency may arise from differences in the result of the balance of positive and negative effects, either from resource alone or from an interaction between resource and predation. Specifically, such an inconsistency may occur because: (i) among sites, resource increments may affect termite species richness either positively or negatively; (ii) the result of the balance between resource effects and predation effects among sites is not the same; and (iii) different sites may present distinct species composition, and such communities may respond differently to such a balance depending on in-herent traits of the predominant group in the community. We inspected the effects of increasing resource amount and risk of predation on termite species richness at a local scale, testing the following predictions: (i) termite species richness respond to resource availability depending on the local risk of predation; (ii) termite species presenting soldier caste are less sensitive to the interaction of resource availabil-ity and risk of predation than soldierless termites species. Total termite richness was not related either to the interaction between resource amount and predation, or to any of these two factors alone. However the number of Apicotermitinae respond to an interaction between the two explanatory variables studied while non-Apicotermitinae species did not. The effect of counteracting of responses of each group might be a plausible explanation to the found pattern.
Keywords: ecology, predation, resource amount, balance of positive and negative effects
1
Programa de P´os-gradua¸c˜ao em Entomologia, Departamento de Biologia Animal, Uni-versidade Federal de Vi¸cosa, MG, Brazil
2
2.1
Introduction
Generally the number of species that coexists in a certain site have a positive relationship to resource availability (Begon et al., 2006; Ricklefs & Schluter, 1993). It seems that social insects follow this general pattern, as both ants and termites species richness may correlate positively to resource amount (Attignonet al., 2005; Camposet al., 2003; Ribaset al., 2003; Eggle-ton, 2000). Even though, negative relationship between termite species rich-ness and resource amount have also been reported (Ara´ujoet al., 2007).
Positive relationship between termite species richness and resource avail-ability may take place when increased resource allows the settlement of more colonies in the site. Hence, the larger the number of colonies, the larger the probability that these colonies to belong to different species. Negative correlations between resource amount and termite species richness are not expected but are theoretically likely. Ara´ujo et al. (2007) proposed three hypothesis that could explain this apparently unexpected result: as resource amount increases species richness diminishes because (i) another resource diminished; (ii) colonies retracted their foraging range, impairing sampling detection and hence producing pseudo-decrements in diversity; or (iii) preda-tion risk increased. Thus resource increments could exert both positive and negative effects on termite species richness.
However termites’ natural enviroments will always present both resources and predators. Thus local termite species richness might be the result of the counteract of these two factors, rather than the result of the effect of resource alone. That is, termite species richness varies from place to place because in some cases the effects of resource is stronger than predation and in others the opposite occurs. Hence the number of termite species of one site might be defined by the balance of these two factors.
alone or from an interaction between resource and predation. Specifically, such an inconsistency may occur because: (i) among sites, resource incre-ments may affect termite species richness either positively or negatively; (ii) the result of the balance between resource effects and predation effects among sites is not the same; and because (iii) different sites may present distinct species composition, hence such communities may respond differently to such a balance depending on inherent traits of the predominant group in the com-munity (e.g. one comcom-munity where the number of soldierless termite species is higher than the number of soldier defended termite species may be more sensitive to predators activity than a community where the opposite occurs). Hence, we propose to inspect the effects of increasing resource amount and risk of predation on termite species richness at a local scale, testing the following predictions: (i) termite species richness respond to resource avail-ability depending on the local risk of predation; (ii) termite species presenting soldier caste are less sensitive to the interaction of resource availability and risk of predation than soldierless termites species.
2.2
Material & Methods
2.2.1 Study area
The study was carried out in seven different sites which are remanescents of Atlantic forest in the surroundings of Vi¸cosa, MG, southeastern of Brazil. The data were collected during the months of April 2006 and of April and May 2007. The mean monthly temperatures and the accumulated rainfall during months of the study were 20,7◦C and 56mm in April 2006; and 19,3◦C and
58mm in April and May 2007. The mean temperature and the accumulated rainfall during the years of the study were 20,1◦C and 1.188,8mm in 2006;
and 16◦C and 987,3 mm in 2007.
to the development of agricultural activities and urban expansions. Nowa-days this landscape is dominated by crop plantations and pastures fields where numerous fragments of primary and secondary forest of different ages are found.
2.2.2 Sampling design
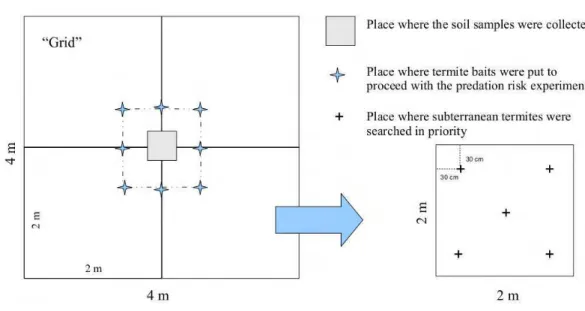
Eight collecting points of 16 m2 of area (4m
×4m), hereafter called ‘grid’
(Figure 2), were defined in all seven sites. In total 56 grids (896m2) were
sampled. The grids were distant from each other 15m minimum. In each grid it was evaluated the risk of predation, availability of resources, and species richness of termites. In all grids both termite sampling and the risk of predation experiment were carried during the highest temperatures of the day (between 10:00 am and 15:00 Pm).
2.2.3 Resource amount
A soil portion of soil (10cm ×10cm×10cm) was collected in the central
area of each grid where a square of 0,5m × 0,5m (Figure 2) was delimited.
These soil samples were processed and analyzed in the Lab of Soil Analysis of UFV to quantify the amounts of total Carbon and Nitrogen. This quantifi-cation was used as a surrogate of the quantity of feeding resources available for termites.
2.2.4 Risk of predation
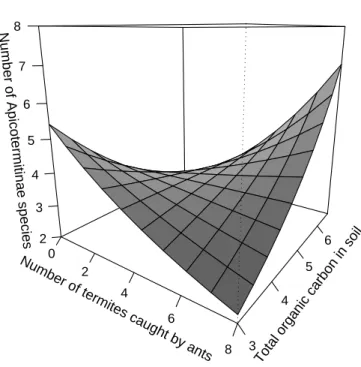
Figure 2: Schematic drawing of the sampling area.
sand paper in one of the tips, where the living termite was glued. Each ter-mite bait was introduced in the soil aiming that the terter-mite body would be as close as possible to the litter surface, to ease the access of the termites by predators.
This experiment was carried out in each of the 56 studied grids. In the central portion of each grid it was delimited a square of 1m×1m where eight
termite baits were placed equally distant from each other (Figure 2). The total number termite baits used in this study was 448 (8×56). Immediately
after placing all the eight termite baits the observation started. Each group of eight termite baits was observed by two people at the same time during 40 minutes, where each person observed 4 neighboring baits. Every predator which attacked a termite bait was collected, put in bottle containing 80% alcohol, labeled and posteriorly identified. Each attacked bait, or the rests of it, was removed to guarantee that each bait was observed only once. A bait was considered to be attacked when it was bite, eaten or captured by one predator.
The risk of predation test was carried 24 hours before the termite sam-pling. This period was established to allow termites to get back to normal activity after human disturbance and the possible increased predator activ-ity, caused by the exposition of termite baits. The risk of predation was thus estimated by the number of baits attacked in each grid. The identification of the collected ants was confirmed by comparison to specimens from the Ants Collection of the Lab of Community Ecology of the Federal University of Vi¸cosa, Brazil.
2.2.5 Termite sampling
In order to make the sampling activity easier and standardized, each grid, was subdivided in four subgrids of 4m2 of area (2m
× 2m) (Figure 2).
Ter-mites were manually sampled respecting a collecting effort proposed by Jones & Eggleton (2000). Each subgrid (2m× 2m) took 24 min to inspected by a
such, in each subgrid, 5 soil samples of 24 cm2 of area and 10 cm of depth
(20 holes/grid) were taken to search for subterranean termites in prior. Four of these soil samples were taken from approximately 30 cm of the subgrids corners and one from the middle of the subgrid area (Figure 2). After col-lecting termites from such soil samples then the collector would search for termites in existent epigeous nests, fallen branches, litter, trees, and tunnels in the subgrid area, always respecting the mentioned time period of collect-ing effort. Termites were kept in 80% alcohol, labeled and identified. The identification was confirmed by comparison to specimens from the Section of Termitology of the Entomological Museum of the Federal University of Vi¸cosa, Brazil, where voucher specimens are deposited.
Attempting to minimize the effects of human disturbance in termite ac-tivity right before their sampling, the delimitation of each grid area, its sub-division, the risk of predation experiment and the sampling of soil used in the estimation of local resource amount, were done one day before. Additionally termites were sampled preferentially in the same period of hours that the experiment of the risk of predation was performed, minimizing the difference of light and temperature conditions in the measurement of the activity of both groups here studied, termites and their potential predators.
2.2.6 Data Analysis
To verify the proposed hypothesis, the following specific predictions were tested: (i) termite species richness respond to resource availability depend-ing on the local risk of predation, (ii) termite species presentdepend-ing soldier caste (non-Apicotermitinae) are less sensitive to the interaction of resource avail-ability and risk of predation than soldierless termites species (Apicotermiti-nae).
adequate models (MAM) were obtained by extracting non-significant terms (p>0.05) from the full models composed by the variables and their interac-tions. Non-significant terms, as single variables or lower interactions levels, were kept in the MAM when corresponding to a significant interaction term. In the models, a plus sign (+) denotes the addition of a variable to the model whereas an asterisk (*) means addition and an statistical interaction between variables. In all full models a blocking term (site) was added to distinguish between the seven sites studied. The full models used to test the proposed predictions are therefore:
Termite richness ∼ site+C∗N∗predation risk (1)
Apicotermitinae richness ∼ site+C∗N∗predation risk (2)
Non Apicotermitinae richness ∼ site+C∗N∗predation risk (3)
2.3
Results
Termites collected belong to the family Termitidae and comprise 4 sub-families, 20 genera, 14 species and 16 morphospecies (Table 1). The Api-cotermitinae group was represented by 10 different taxon and were 42% of the collected species per grid from a mean of 6.95 species per grid. 93.4 % of the species were found on soil samples. All the organisms observed attacking the termite baits in the risk of predation experiment were ants. The ants collected belong to 4 subfamilies, 9 genera, 6 species and 10 morphospecies (Table 2).
amount and risk of predation, while non-Apicotermitinae species richness does not respond. The number of Apicotermitinae species decreases with the increase of risk of predation when the amount of availabe carbon in soil is low. And the number of Apicotermitinae species increases when the amount of carbon in soil is high, disregarding augmentation in risk of predation (Ta-ble 4 and Figure 3).
Number of termites caught by ants0 2
4
6
8
Total organic carbon in soil
3 4
5 6
Number of Apicotermitinae species
2 3 4 5 6 7 8
Biologia, Garagem and Chaves
Table 1: List of the termite (morpho)species and their respective subfamily and feeding habit recorded in seven forest remanescents in the surrounding of Vi¸cosa, MG, Brazil May 2006 and April/May 2007. Feeding habit defini-tion follow Donovan et al. (2001), DeSouza & Brown (1994) as well as the observations made in this study. In the absence of full match at species level, the habit definition follows the most referred feeding habit for the respec-tive genus. Termites were identified according to Constantino (1999) and Mathews (1977).
Subfamily Species Donovanet al. DeSouza This study
& Brown
Termitinae Dentispicotermes cupiporanga soil - soil
Dihoplotermes inusitatus - - soil
Neocapritermes opacus - - soil/litter/wood
Syntermitinae Armitermessp.1 - - soil
Cornitermes cumulans litter/wood litter wood
Cornitermessp.1 litter/wood litter wood
Cyrilliotermes cupim soil soil soil
Ibitermes curupira - - soil
Labiotermessp.1 soil soil soil
Labiotermessp.2 soil soil soil
Procornitermes lespesii soil (upper layers) - soil/litter/wood
Syntermes dirus - litter soil
Nasutitermitinae Atlantitermes osborni - soil soil
Diversitermes castaniceps - - soil/litter/wood
Nasutitermes jaraguae litter/wood wood soil/wood
Nasutitermes rotundatus litter/wood wood soil/wood
Nasutitermessp.1 litter/wood wood soil
Nasutitermessp.2 litter/wood wood soil/wood/
arboreal gallerie
Nasutitermessp.3 litter/wood wood soil
Subulitermessp.1 - soil soil/litter
Apicotermitinae Anoplotermessp.1 soil - soil/litter
Anoplotermessp.2 soil soil soil/wood/
arboreal gallerie
Anoplotermessp.4 soil soil soil
Anoplotermessp.5 soil soil soil/litter
Anoplotermessp.6 soil soil soil/wood/dung
Anoplotermessp.7 soil soil soil/wood
Anoplotermessp.8 soil soil soil
Aparatermes abbreviatus - - soil
Grigiotermessp.1 soil - soil
Table 2: List of the ant species collected in the event of the risk of predation experiment in seven forest remanescents in the surrounding of Vi¸cosa, MG, Brazil May 2006 and April/May 2007.
Subfamily Species
Ectatomminae Ectatomma edentatum Gnamptogenys striatula Formicinae Brachymyrmex sp.1
Camponotus (myrmothrix) rufipes Myrmicinae Crematogaster sp.1
Pheidole (G-fallax)sp.1
Pheidole (G-fallax)sp.2
Pheidole sp.3
Pheidole sp.4
Pheidole sp.5
Solenopsis sp.1
Solenopsis sp.2
Solenopsis sp.3
Ponerinae Odontomachus chelifer Odontomachus meinerti Pachychondyla striata
Table 3: Analysis of deviance of the minimal adequate model showing the effect of the interaction between the activity of predatory ants and the availability of total carbon in soil on the species richness of termites, Vi¸cosa -MG. Brasil, using glm with Poisson errors and log link function. The full model tested was Termite richness = site + C * N * predation risk.
Source of variation df Variance P(>χ2)
MAM 13 <0.01
site 6 28.128 <0.01
Error 42
Table 4: Analysis of deviance of the minimal adequate model showing the effect of the interaction between the activity of predatory ants and the avail-ability of total carbon in soil on the species richness of Apicotermitinae ter-mites, Vi¸cosa - MG. Brasil, using glm with Quasipoisson errors and log link function. The site variable here refer to the two groups of sites after con-trasting. The full model tested was Apicotermitinae richness = site + C * N * predation risk.
Source of variation df Variance P(>χ2)
MAM 4 39.589 <0.01
site 1 8.139 <0.01
C 1 2.654 0.012
predation risk 1 0.402 0.327 C:predation risk 1 3.822 <0.01
Error 51
Total 55
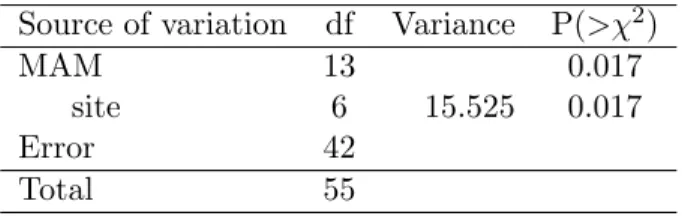
Table 5: Analysis of deviance of the minimal adequate model showing the effect of the interaction between the activity of predatory ants and the avail-ability of total carbon in soil on the species richness of non-Apicotermitinae termites, Vi¸cosa - MG. Brasil, using glm with Poisson errors and log link function. The full model tested was Non Apicotermitinae richness = site + C * N * predation risk.
Source of variation df Variance P(>χ2)
MAM 13 0.017
site 6 15.525 0.017
Error 42
2.4
Discussion
Why are the reported responses of termite species richness to re-source availability sometimes positive and sometimes negative?
We accepted the hypothesis that the inconsistency in the reported re-sponse of termite richness to resource availability may occur because distinct functional groups respond differently to a balance between resource avail-ability and risk of predation. Our results demonstrate that the two groups of termites studied have different responses to the interaction of resource availability and risk of predation. While Apicotermitinae species richness was determined by an interaction of resource amount and risk of predation (Table 4 and Figure 3), non-Apicotermitinae species richness was not (Ta-ble 5). Additionally, Apicotermitinae species are less prone to coexist where resources is scarce and the risk of predation is high, i.e. where resource aqui-sition would not pay the costs of defense. Such a response of Apicotermitinae species richness to the interaction of resource amount and risk of predation may thus denounce, the sensitiveness of such group to predators.
Why total termite species richness is not related to resource avail-ability and risk of predation?
Why non-Apicotermitinae species richness does not respond to the interaction of risk of predation and resource availability?
Non-Apicotermitinae species are likely to be less sensitive to predation than Apiotermitinae species either because of their inherent defensive abilities (presence of the soldier caste) or because non-Apicotermitinae species gen-erally present numerous colonies (among the collected non-Apicotermitinae genera the mean number of individuals per nest range from 34.000 to more than 1 milion; Lepage & Darlington (2000)). Thus, the risk of predation is relatively low to non-Apicotermitinae species as more individuals in the colony lower the risk of it to be extinct and so smaller the chance of exclu-sion of such species at the site.
Why risk of predation exert contrasting effects on Apicotermitinae species richness?
Predation exerting contrasting effects on species richness is not a novelty (Begon et al., 2006). We observed that Apicotermitinae species richness de-creases with high risk of predation when resource is scarce and inde-creases when resource is abundant. Such an interaction may occur because when resource is scarce the effect of high risk of predation in lowering abundance may de-mote rare species to extinct. But when resource is abundant, predators may prevent single species from monopolizing the resources (Paine, 1966) and so favour the coexistence of more species.
Conclusion
infor-mation and thus lead to missinterpretations. The nonsignificant relationship found in this work might be not explained as a result of the counteracts of the two evaluated forces - resource availability and risk of predation. However at the group perspective this explanation is shown to be plausible, as the effects of the counteraction between resource and predation was not equal to all termite groups of species. Thus, despite the fact that all termites are social, detritivorous and do fit into a single order, they seem to respond differently to the offer of resource and risk of predation. Therefore, to unveil mecha-nisms linked to resource use and termite species richness, termites should be grouped according to specific traits such as defense mechanism and specific feeding habit.
Acknowledgements
Bark roughness ruling presence and activity of arboreal
termites (Isoptera: Termitidae) on trees
Juliana Lins1, Teresa Telles Gon¸calves2, Ronaldo Reis-Jr23, and Og
DeSouza4
Abstract
In tropical forests, tree may present from smooth to irregulary fissured barks. Such a diversity of roughness is known to play an important role on the the amount of species and biomass of invertebrates supported on the bark of a tree. Arboreal termites may use the bark of tree as a highway, where they have to walk up and down between canopy and ground. Besides two claws termites workers and soldiers have no morphological adaptation such as arolia on theirtarsi to walk on smooth surfaces. Hence, we explore such an idea using termites (Insecta: Isoptera) in a field experiment, investigating whether bark roughness would (i) affect the proneness to find termite galleries on tree trunks and (ii) limit termite activity on such trunks. Data were collected in a semidecidous forest in the domains of the Brazilian Atlantic forest, Minas Gerais State. We evaluated 66 trees which were exploited, not simultaneously, by termite species of two Termitidae genera: Nasutitermes and Microcerotermes. The chance to find an active arboreal termite gallery on a tree trunk increases with higher values of the bark roughness index but termite activity is not related to such an index. We argue that rougher barks have a positive effect on arboreal termite occurrence either because they favour termites’ coming and going on the trees; or because they are a surrogate for the resources provided by such trees.
Keywords: Isoptera, Microcerotermes, Nasutitermes, arboreal termite, tree bark structure, determinants of tree exploitation, Quadrat-method, uniform and aggregate
1
Programa de gradua¸c˜ao em Biologia, Departamento de Biologia Animal, Universidade Federal de Vi¸cosa, MG, Brazil
2
Programa de P´os-gradua¸c˜ao em Entomologia, Dep. de Biologia Animal, Universidade Federal de Vi¸cosa, MG, Brazil
3
Present address: Dep. de Biologia, Universidade Estadual de Montes Claros, Montes Claros, MG, Brazil
4
3.1
Introduction
Termites are social insects majorly associated to soil enviroment. De-spite that, there are several termite species which inhabit the forest canopies (Constantino, 1999). Such species, generally referred as “arboreal termites”, build their nests hanged on trees’ branches or trunks (Noirot, 1970). Ef-forts to clear the factors constraining tree exploitation by termites have been made and nowadays it is known that predation risk (Gon¸calveset al., 2005b; Leponce et al., 1999), and “macrostructural” features of trees such as size (Gon¸calves et al., 2005a; Jones & Gathorne-Hardy, 1995) and number of branches (Gon¸calves et al., 2005a) are important determinants of tree ex-ploitation by termites. However, information on the effect of “microstrutural” features of trees, such as bark roughness, that may rule the exploitation of trees by termites, remain largely unknown.
The bark is indeed an important component of forest and woodland ecosystems (Majer et al., 2003) and, besides protecting the trees in vari-ous ways, it serves as shelter and as source of nutrition for many animals, plants, fungi and lichens. In tropical forests, trees may present high morpho-logical diversity of barks which can vary from smooth to irregulary fissured ones. Such a diversity of traits is known to play an important role on the number of species and the biomass of invertebrates supported on the bark of a tree (Halula et al., 2000; Nicolai, 1989, 1993).
on tree trunks and (ii) limit termite activity on such trunks. Our rationale is that, to exploit a tree, termites must attach galleries on it. To build galleries on the tree’s trunk, termite require barks rough enough to the attachment of their morphologically simple tarsi as well as of their buiding materials. That is, barks can not be totally smooth, but must present a certain level of roughness on which termites could hold fast and where their constructs could adhere. Accordingly, past the critical roughness limit, termite activity should increase steadily, possibly up to a certain value where it levels off.
3.2
Material & Methods
3.2.1 Study area
The study was carried out in the Rio Doce State Park, Brazil, between January 15 and February 15 (summer season) of 2004. This park is the largest continuous remnant of semideciduous Atlantic rain forest of Minas Gerais state (35.976ha), Southeastern, Brazil, and is located between 19◦48’18”
-19◦29’24” S and 42◦38’30” - 42◦28’18” W. To the East the park is bordered
by the river Doce and to the South by the Piracicaba river. The local alti-tude varies from 230 to 515 m above sea level (SOCT- Sistema Operacional de Ciˆencia e Tecnologia, 1981). The area is characterized by the Aw K¨oppen climate type (Tropical warm semi-humid), with rainy season from October to March and dry season from April to September. Mean rainfall is 1480.3 mm/year and the yearly mean temperature is 21.9◦ C (Gilhuis, 1986).
Veg-etation is mainly seasonal semideciduous (Lopes, 1998), with a moderate to high percentage (20 to 50%) of deciduous trees (Veloso et al., 1991).
3.2.2 Sampling design & Data Collection
All trees evaluated in this study were at least 50 m distance from the forest edge.
One 4 cm2 portion of bark was collected from each of the 66 trees
present-ing a minimum of 15 cm of circumference at 1.30 m from the soil (circum-ference at the breast height, CBH). Each tree was evaluated for the presence or the absence of termite galleries at 1.30 m from the soil level. To access termite activity we simultaneously interrupted both extremities of a 15 cm long portion of the gallery and captured all termites found therein. Fur-ther inspection on the remainder of the gallery allowed catching additional soldiers, thereby guarantying secure identification of the species. This addi-tional sample also allowed us to confirm that galleries were actually being used by termites, whenever the event that the activity inside the inspected portion of gallery was momentarily zero. We did not sample galleries built inside wood. Termites were kept in 80% alcohol, labeled and identified. The identification was confirmed by comparison to specimens from the Section of Termitology of the Entomological Museum of the Federal University of Vi¸cosa (http://www.insecta.ufv.br/museu), Brazil, where voucher specimens are deposited.
3.2.3 Measurement of bark roughness
bark crevices are represented by the white portions. Such images were then converted into 1000 x 1000 matrices, composed by zero and one (Figure 4), where zero represented the black pixels, and one represented the white pixels in the edited image. The matrices were obtained using the scriptimg2txt from the R package Rt4bio (http://sourceforge.net/projects/rt4bio/). Finally, an index of roughness of bark was calculated from each matrix. This index was processed under R (R Development Core Team, 2008) using the quadrat-based method (Crawley, 2007). The quadrat-quadrat-based method test for spatial randomness of individuals (here black pixels) in quadrat areas. The quadrat-based method is describe in the following steps:
1. Calculation of the number of black pixels of each 1000 x 1000 pixels black and white image (quadrat).
2. Calculation of the area of a sub-quadrat need to fit one black pixel per sub-quadrat if the distribution of black pixels in the quadrat was uniform (Figure 5 B).
3. Placement of the sub-quadrats over the original image to proceed the measurement of the mean and the variance of the number of black pixels in the sub-quadrats (Figure 5 C).
4. Determination of the distribution of black pixels in each quadrat, which is given by the variance over the mean number of black pixels dis-tribuited on the correspondent areas of sub-quadrats on the quadrat (Equation 4). Where the higher ratio of variance/mean, more aggre-gated is the distribution of the black points and thus rougher is the bark.
Index of bark roughness = variance
Figure 4: Schematic ilustration on the routine to obtain the index of bark roughness. (right) Result from the imprint procedure performed in one por-tion of bark. (center) Black and white image with 1000 x 1000 pixels of size , converted from the image imprinted from the portion of bark. (left) Portion of the matrix obtained from the black and white image, the black pixels are here represented by 0 and the white pixels by 1.
3.2.4 Data Analysis
Figure 5: Schematic ilustration on the routine to calculate the index of bark roughness. (right) Drawing of a schematic result from the imprint procedure performed in one portion of bark. (center) Drawing showing the fit of one black pixel per sub-quadrat if the distribution of black pixels in the quadrat was uniform. (left) Drawing showing the placement of the sub-quadrats over the schematic original drawing to proceed the measurement of the mean and the variance of the number of black pixels in the sub-quadrats.
termite active galleries were taken in to account. The full models used are therefore:
Presence of termites ∼ index of bark roughness (5)
Activity of termites ∼ index of bark roughness∗genus (6)
In the models, an asterisk sign (*) denotes both addition and interaction of the variables in the model. Error distribution was Binomial for the model described in equation 5 and Negative Binomial for the model described in equation 6 with logit and log link functions, respectively. Model simplifica-tion, was performed by backward term extracsimplifica-tion, removing one term at a time. Terms returned to the model if their removal provoked a change of deviance with P <0.05.
3.3
Results
Termites collected belong to the family Termitidae and comprise two sub-families, two genera, three species and one morphospecie (Table 6). Out of the 66 evaluated trees, 23 held active galleries, whereas five held inactive termite galleries. The remaining 38 trees did not show any sign of termite presence. Termite nests were directly spotted on 4 out the 23 trees contain-ing active galleries. Among those, only one tree held two nests, whereas the others held single nests. The maximum distance of the nests to the ground observed was 15 meters, the average distance was 10.91 meters, and the mini-mum distance was 7.35 meters. The maximini-mum value of bark roughness index obtained was of 6.93, the mean value was 1.99 and minimum value was 0.27. The hypothesis that bark roughness affects termite sucess in exploiting trees was confirmed. The rougher is the bark, the more likely to find termites on the tree (χ2
1 =4.986; P=0,026, n=66, Figure 6). According to the final
to bark roughness according to the logistic equationlog(pq) =−1.52+0.4348∗
bri, where (p
q) is the odds ratio of presence/absence and the bri is the trait
bark roughness index as defined in the Material & Methods section. When we back-transform this odds ratio to the “probability of termite occurrence”, such an equation gives Figure 6. The inflection point of this curve is bark roughness =3.5, and represents the value where the probability of termite occurrence, p, is 50%. That is, the probability of termite occurence on trees drops below 50% for trees presenting bark roughness index below 3.5. Bark roughness, however, did not affect the activity of termites within the galleries on the trunk (χ2
1 =0.6385; P=0,42, n=23).
Table 6: List of the termite species of the sampled on trees in State Park of Rio Doce, MG, Brazil 2004.
Subfamily Species
Nasutitermitinae Nasutitermes corniger Motschulsky
Nasutitermes minor Holmgren
Nasutitermes sp. 1
1 2 3 4 5 6 7
0.0
0.2
0.4
0.6
0.8
1.0
Bark roughness index
Probability of arboreal termite occurrence
3.4
Discussion
Insects crawl vertical surfaces with the help of special morphological struc-tures present on their tarsi: the claws, arolia, and pulvilli. Claws allow grip-ping on rough surfaces while arolia and pulvilli present hairs which adhere to smooth surfaces (Chapman, 1991). The workers and soldiers of the ter-mite species studied here, as with in all other Termitidae (Crosland et al., 2005), do not present arolia nor pulvilli in their tarsi. Therefore, they may experience trouble when trying to climb trees whose barks are excessively smooth.
Such a morphological feature of termitetarsi could be the proximal cause of the results achieved here. Cracks could ease termite grip onto barks, and this could be the underlying mechanism for the positive effect of bark roughness on the chance to find an active termite gallery on a tree trunk (Figure 6). Moreover, there seems to be a critical value of bark roughness above which the likelyhood to find termites exploiting a tree exceeds 50% (χ2
1= 4.986; P= 0,026, n= 66). That is, trees are prone to be exploited by
termites providing their bark roughness exceeds a given threshold.
Interestingly enough, termite activity within such galleries was not af-fected by bark roughness, contrarily to our expectancies (χ2
1= 0.6385; P=
0,42, n= 23). This indicates that once galleries are built, bark irregularity does not provide further ease to termite doings. Bark roughness, therefore, seems crucial for termite establishment on trees, but not for everyday colony dynamics.
adhesion of building materials, thereby providing better attachment of gal-leries and nests. This could also explain the absence of effects of bark texture on termite activity. That is, if the main problem is to attach galleries and nests, there is no reason to suspect increased activity after the threshold of roughness is overcome and the attachment problem is solved.
An alternative interpretation would be that termites may be related to bark roughness indirectly; this trait indicating the resources available on the tree. In fact, trees presenting rough barks are suitable to the attachment of epiphytes (Male & Roberts, 2005) and lichens (Raniuset al., 2008), which are known to be important source of nutrition for some arboreal termites (Miura & Matsumoto, 1998). Additionally, bark roughness could indicate the tree’s age, since older trees are prone to present barks with deeper crevices (Ranius et al., 2008). Older trees hold older barks, and barks are dead tissue. It follows that, for a given tree species, the rougher its bark the longer it have entered decomposition processes and the closer it could be to termite needs. Older trees are also larger, and the larger the tree the more likely that it will hold termites (Gon¸calves et al., 2005a; Jones & Gathorne-Hardy, 1995).
In summary, bark roughness could indicate to termites that the tree holds resources in suitable quantity and/or quality. This would call for an ultimate cause: how would termites ‘know’ that bark roughness indicates anything? The answer to such a question is beyond the scope of our experiment, but current evidence allows some conjectures on the matter. Providing that sur-face irregularity is an essential condition to trigger termite building behaviour (Lee et al., 2008), one could think that such a trait was selected in response to tree’s suitability associated to bark roughness.
Acknowledgements
Use of ground resources by arboreal
termites (Isoptera:Termitidae)
Teresa Telles Gon¸calves1, Og DeSouza2, Ronaldo Reis-Jr23, and S´ervio
Pontes Ribeiro4
Abstract
Termites are known to act directly on organic matter decomposition and nutri-ent cycling, and therefore are important organisms to the maintenance of ecosys-tems functionality. Despite being majorly associated to the soil fauna several termites species inhabit arboreal environments. Nevertheless the ecological de-terminants of tree exploitation by termites remain largely unknown. Arboreal termites always present galleries connecting their nests to the ground. And be-sides being provided in the trees crowns it is on the ground that most of termites feeding resources are largely abundant. Thus we tested the hypothesis that the exploitation of trees by arboreal termites is affected by the amount of potential resources on the ground below hosts trees. Data were collected in a semidecidous forest in the domains of the Brazilian Atlantic forest, Minas Gerais State. We evaluated 70 trees which were exploited, not simultaneously, by termite species of two Termitidae genera: Nasutitermes and Microcerotermes. As hypothesized, we found that the availability of potential resource items on the ground were im-portant determinants of tree exploitation by these termite species. It is therefore plausible to suspect that, despite inhabinting colonies apparently detached from the ground habbitat, arboreal termites can be constrained by ground traits - rather than only canopy traits.
Keywords: Canopy, litter, soil organic carbon,Microcerotermes,Nasutitermes, Isoptera
1
Programa de P´os-gradua¸c˜ao em Entomologia, Dep. de Biologia Animal, Universidade Federal de Vi¸cosa, MG, Brazil
2
Departamento de Biologia Animal, Universidade Federal de Vi¸cosa, Vi¸cosa, 36570-000, MG, Brazil; Corresponding author, e-mail: og.souza@ufv.br
3
Present address: Dep. de Biologia, Universidade Estadual de Montes Claros, Montes Claros, MG, Brazil
4
4.1
Introduction
Termites are generally associated to soil fauna and are basically detritivo-rous. They feed on a wide range of dead plant material (cellulose) in various stages of decomposition (Donovan et al., 2001), which is largely distributed on the forest floor. Despite the apparent availability of this resource on the forest floor, there are several termite species that inhabit forest canopies. Such species, generally referred to as “arboreal termites”, build their nests hanging from tree branches or trunks (Noirot, 1970).
The habit of hanging the nest on trees brings to the arboreal termite species several benefits. It allows for instance, arboreal termites to escape from enemies such as ground dwelling ant and mammal predators (Deligne et al., 1981), or even to escape from natural catastrophes such as fires and floodings. Furthermore, on trees termites can find food items like lichens and microepiphytes (Jones & Gathorne-Hardy, 1995; Miura & Matsumoto, 1997), which are rich in nitrogen (Miura & Matsumoto, 1997), an element essential to termite growth and reproduction (Brent & Traniello, 2002).
resources are relatively more abundant; a fact that arboreal termites seem not to neglect.
In fact, Termitidae species that inhabit trees, always construct tunnels connecting their arboreal colonies to the ground environment (Noirot, 1970). For instance Microcerotermes parvus nests in dead trees and maintains com-munication with the soil through galleries, though which the workers may reach branches which have fallen onto the floor, or branches in neighboring trees (Noirot, 1970). Also, arboreal termite species are reported to forage both on the ground (Joneset al., 1998; Sousa-Soutoet al., 1999), and on tree branches (Jones & Gathorne-Hardy, 1995; Miura & Matsumoto, 1997, 1998). However, besides the evidences of connection between the tree and the forest floor, the effects exerted by the ground elements on tree exploitation by arboreal termites remain unknown. Thus, supported by (i) the alleged ability of arboreal termites species of foraging on the ground, (ii) the widespread occurrence of canopy-ground connections, and (iii) the large availability of potential resources on the ground coupled with their relative lower availability up on the tree, we pose the hypothesis that tree exploitation by arboreal termites is positively affected by the amount of ground resources below such a tree. We thus tested the prediction that the availability of potential feeding resources for termites (like branches, litter and soil organic matter), on the ground level beneath trees increases the likelihood of the presence of arboreal termites on trees.
4.2
Material & Methods
4.2.1 Study area
defined by the Doce river and its northern boder by the Piracicaba river, while it is also bordered by eucalyptus plantations, pastures and urban areas elsewhere. The altitude varies from 230 to 515 m above sea level (SOCT, 1981). The area is characterized by the Aw K¨oppen climate type (Tropical warm semi-humid) with a rainy season from October to March and a dry sea-son from April to September. Mean rainfall is 1480 mm/year and the mean annual temperature 21.9◦ C (Gilhuis, 1986). Vegetation is mainly
semide-ciduous (Lopes, 1998), with a moderate to high percentage (20 to 50%) of deciduous trees (Veloso et al., 1991).
4.2.2 Definition of terms
Hereafter, we refer to “arboreal” as those termites that build earthen galleries on trunks of living trees, such galleries serving as protection for foragers. This is not a trivial definition of such termites, as most authors tend to (implicitly or not) use this term when referring to termites which build their nests on the tree (see Noirot & Darlington, 2000 for a review on the nesting behaviour of termites). However, our data do not allow us to distinguish if the termites were actually inhabiting the particular tree from which they were collected or a neighbour.
Moreover, the “presence” of termites in tunnels, regardless the amount of individuals, was considered indicative that the tree was suitable enough to be used by them.
4.2.3 Sampling design & Data collection
park. All trees evaluated in this study were at least 50 m distance from the forest edge.
Each tree was evaluated for the presence or absence of termite galleries at 1.30 m from the soil level. We also inspected each gallery to confirm that tunnels were actually being used by termites and to collect these. The termites found therein were collected to identify the termite species. We did not sample galleries built inside wood. Termites were kept in 80% alcohol, labeled and identified. The identification was confirmed by comparison to specimens from the Section of Termitology of the Entomological Museum of the Federal University of Vi¸cosa, Brazil, where voucher specimens are deposited.
Soil samples were taken beneath each tree, between 0 to 10 cm of depth, and were air-dried and passed through a 0.5 mm sieve. The percentage of total organic carbon (toc) was determined by hot oxidation with potas-sium dichromate and titration with ammoniac ferrous sulphate, according to Mendon¸ca & Matos (2005). Litter depth (ld) was taken as the mean ground litter thickness from four points that were 20 cm distant from the tree trunk (North, South, East and West; determined with a compass). Length of fallen branches (lfb), was the sum of the linear length of the fallen branches with a minimum circumference of 10 cm, found inside a squared plot of 1 m2 next
to the tree trunk. It was obtained using a measuring tape.
4.2.4 Data Analysis
The prediction that the availability of resources on the ground level be-neath trees increases the likelihood of the presence of arboreal termites on trees, was tested using a model whose binary response variable y took the value 1, when active tunnels were detected on the tree trunk, and zero when there were no tunnels or when they were abandoned. Explanatory variables used were: the percentage of soil total organic carbon (toc), mean ground litter depth (ld) and the sum of the length of fallen branches (lfb) from 1 m2 area, under the tree. The full model used in those hypotheses tests are
therefore:
Presence of termites ∼ toc∗ld∗lf b (7)
In the models, an asterisk sign (*) denotes the addition of a variable to the model and a statistical interaction between the variables. Error distribution used was Binomial with logit functions.
4.3
Results
Termites collected belong to the family Termitidae and comprise two sub-families, two genera, three species (Microcerotermes strunckii, Nasutitermes corniger and N. minor) and one morphospecies (N. sp.1). Out of the 70 evaluated trees of 13 families (Table 8), 25 held active galleries, whereas 6 held inactive termite galleries. The remaining trees did not show any sign of termite presence. Termite species never co-occurred in the same tree. Ter-mite nests were directly spotted on 5 out of the 25 trees containing active tunnels. Among those, only one tree held two nests, whereas the others held single nests. The maximum height of the observed nests was 16.9 m, the average 11.91 m, and the minimum height was 7.35 m above ground.
litter depth and length of fallen branches amounts at which termite occur-rence on trees is highest (Figure 8). Thus, arboreal termites are more prone to occur on trees where, on the ground below, termites find high amounts of total organic carbon in soil, and high amounts of litter combined to low quantities of branches.
Table 7: Analysis of deviance of the minimal adequate model showing the effect of the measured ground resources, sum of the length of fallen branches (cm/m2), mean of litter depth (cm) and soil total organic carbon (%), on
arboreal termite presence, using glm with Binomial errors and logit link func-tion.
Source of variation df χ2 P
MAM 4 21.882 <0.01
Total organic carbon (toc) 1 10.128 0.001
Litter depth (ld) 1 4.837 0.028
Length of fallen branches (lfb) 1 0.059 0.809
Litter depth (ld) : Length of fallen branches (lfb) 1 6.859 0.009
Error 65