PRINT ISSN 2284-7995, E-ISSN 2285-3952
SUSTAINABLE
TOURISM
DEVELOPMENT
-
IMPORTANT
COMPONENT OF SPATIAL TOURISTIC PLANNING
Adelaida Cristina HONTUŞ
University of Agricultural Sciences and Veterinary Medicine Bucharest, Faculty of Management, Economical Engineering in Agriculture and Rural Developments, 5λ,ă M r ştiă Boulevard, District 1, Bucharest, Zip cod 011464, Romania, E-mail: [email protected]
Corresponding author: [email protected]
Abstract
Through its specificity, the tourism industry is directly related to the environment, more than other industries. Running uncontrolled tourism activities, at random, without taking into account the development and exploitation standards can lead to the environmental degradation and tourism resources. To achieve the travel activities the best possible is required, besides the natural, human and material resources, to satisfy the tourists' needs. Material and technical endowment of tourism is represented by: accommodation and food services, transportation, treatment and leisure facilities and is primarily conditioned by developing and modernizing the existing endowment. Thus, a highly attractive tourist area could not be on offer before having the facilities for receiving and retaining potential tourists. In order to decide on the tourism development of an area, it is needed an analysis of the tourist traffic to the existing tourist settlements. This paper achieved a study case on the tourism demand and supply in Bucharest, the capital of Romania. For this purpose, a series of tourism indicators regarding the tourism demand and supply have been calculated, analyzed and interpreted.
Key words: average length of stay, spatial touristic planning, tourism supply and demand, tourist traffic density, occupancy of tourist accommodation establishments
INTRODUCTION
Tourism aims to promote particular destinations, exotic areas and different objectives. The tourism natural or anthropogenic resources are more varied and unspoiled, the greater their attractiveness. On the other hand, these areas are more fragile and require a special protection [6]. The high tourism demand required a specific infrastructure which sometimes affect the environment, increasing pollution, disrupting local life, and visibly degrading the natural heritage [3].
The sustainability of tourism supposes a proper management of resources, in order to cover the economic, social and aesthetic tourists needs, at the same time maintaining the biodiversity, ecological processes, and cultural integrity of all systems for the future generations of tourists [2].
To achieve sustainable development of tourism, three objectives are essential: the control of the tourist traffic; the layout of appropriate tourist settlements in various areas
which are tourist destinations; the diversification of tourism products by introducing new forms of tourism integrated in the environment.
Sustainable tourism should contribute to the preservation, protection and restoration of the the Earth 's ecosystems to support sustainable development, production and consumption. It also should not be neglected the formative - educational side of the sustainable tourism, by which man should be aware about the role he plays in managing and maintaining the unaltered quality of nature.
In this context, this paper aimed to analyze the tourist traffic in Bucharest, the capital of Romania, and the degree of capitalization of village tourism.
MATERIALS AND METHODS
PRINT ISSN 2284-7995, E-ISSN 2285-3952
Bucharest.
In order to achieve the objectives of this study, there were used the statistical data regarding the tourist traffic in Bucharest, tourist density in relationships with the number of inhabitants and in the area of the village.
Also, to manage this research, a series of
documents were provided by the
representatives of the City Hall, the Ministry of Regional Development. It is about documents on tourism marketing, plans for integrated tourism development of the municipality and urban development, also the empirical data on tourist traffic in the area provided by the National Institute of Statistics.
For tourist traffic analysis, there were calculated and interpreted certain indicators of tourism demand and supply, such as: changing tourism demand, demand variation index, tourist accommodation capacity, global tourism demand index distribution, customer development index, hostel overnights
development index, the average
accommodation rate in tourism facilities, monthly tourist concentration coefficient, tourist density indicator in relation to population density indicator, in relation to the surface, the "tourist office" [4, 5, 6].
The analysis and interpretation of these
indicators of tourist traffic helped to make an idea about the development of tourism in Romania and mainly about tourism planning strategies which can be taken in this area.
RESULTS AND DISCUSSIONS
The analysis of tourist traffic on tourism supply and demand in Bucharest, the capital of Romania
Bucharest has 228 km² surface and 1, 912,515 inhabitants in the year 2012 (Table 1).
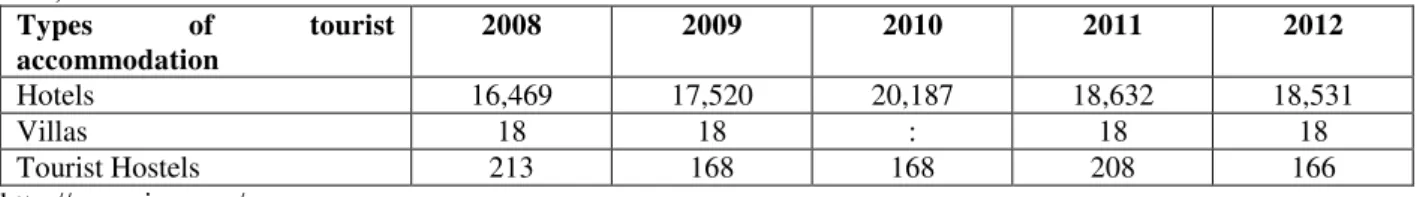
A number of 22,552 accommodation in touristic units of accommodation were in Bucharest in the year 2012. The distribution of these accommodation places by tourism accommodation units was the following one: 18,531 beds in hotels (83,17%), 18 beds in villas (0.07 %) and 4,003 beds in tourist hostels (16.76 %) (Table 2).
A number of 1,238,881 foreign tourists were accommodated in Bucharest in the year 2012, by 7.72 % more than in the year 2008, reflecting that the capital of Romania has become an interesting touristic attraction for people from other countries.
The distribution of foreign tourists by types of accommodation units was the following one: 98.39 % in hotels, 0.07 % in villas and 1.54 % in tourist hostels. (Table 3)
Table 1. Bucharest population, 2008-2012 (inhabitants)
2008 2009 2010 2011 2012
Bucharest population 1,943,981 1,944,226 1,942,254 1,919,352 1,912,515 http://www.insse.ro/
Table 2. Total number of accommodation places in touristic accommodation units in Bucharest, 2008-2012 (No. of beds)
Types of tourist accommodation
2008 2009 2010 2011 2012
Hotels 16,469 17,520 20,187 18,632 18,531
Villas 18 18 : 18 18
Tourist Hostels 213 168 168 208 166
http://www.insse.ro/
Table 3. Total number of foreign tourists in Bucharest, Romania, by type of tourism accommodation unit
Types of tourist accommodation
2008 2009 2010 2011 2012
Hotels 938,182 899,824 1,024,893 1,180,760 1,218,955
Villas 184 110 : 589 923
Tourist Hostels 6,768 4,447 4,237 4,487 4,003
PRINT ISSN 2284-7995, E-ISSN 2285-3952
A number of 553,912 residents visited Bucharest in the year 2012, of which 99.36 % were accommodated in hotels, 0.583 % in tourist hostels and 0.057 % in villas (Table 4).
The number of tourist arrivals totalized 669,969 in the year 2012, of which 99.78% were in hostels, 0.09 % in villas and 0.13 % in tourist hostels (Table 5).
Table 4. Total number of Romanian tourists arrivals in Bucharest, by type of tourism accommodation unit
Types of tourist accommodation
2008 2009 2010 2011 2012
Hotels 399,153 365,276 433,914 540,863 550,404
Villas 66 35 : 251 317
Tourist Hostels 3,468 2,928 3,525 3,668 3,191
http://www.insse.ro/
Table 5. Total foreign tourists arrivals by in tourist accommodation types of structures in Bucharest
Types of tourist accommodation
2008 2009 2010 2011 2012
Hotels 539,029 534,548 590,979 639,897 668,551
Villas 118 75 : 338 606
Tourist Hostels 3,300 1,519 712 819 812
http://www.insse.ro/
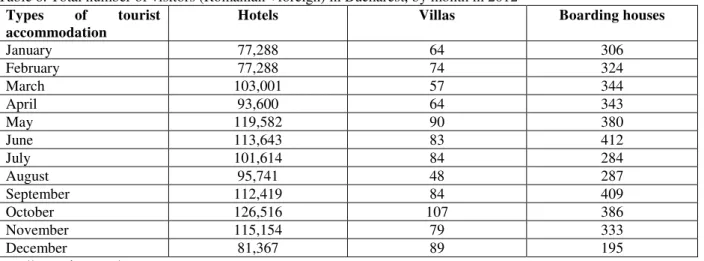
The visitors who visited Bucharest in the year 2012 recorded the highest number in the months of October, May, June, September and
November, reflecting the seasonality of tourism in Bucharest. They mainly applied to stay in hotels.(Table 6).
Table 6. Total number of visitors (Romanian +foreign) in Bucharest, by month in 2012
Types of tourist accommodation
Hotels Villas Boarding houses
January 77,288 64 306
February 77,288 74 324
March 103,001 57 344
April 93,600 64 343
May 119,582 90 380
June 113,643 83 412
July 101,614 84 284
August 95,741 48 287
September 112,419 84 409
October 126,516 107 386
November 115,154 79 333
December 81,367 89 195
http://www.insse.ro/
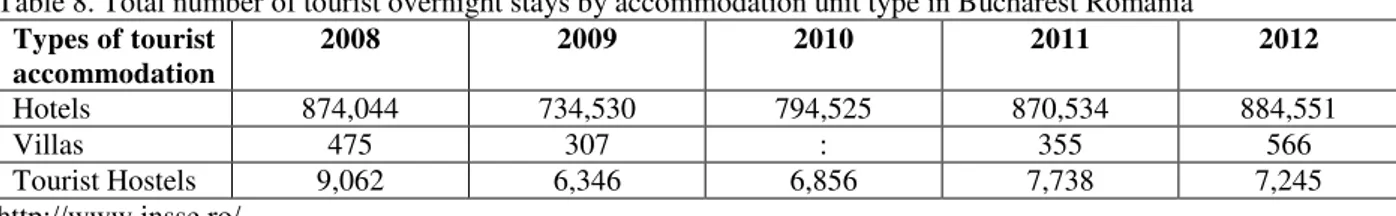
The number of overnight stays totalized 2,040,060 in the year 2012, of which 99.44% were in hotels and 0.44 % in tourist hostels. The data from the above tables, provided by
National Institute of Statistics were used to calculate, analyze and interpret the most important indicators of tourist traffic, as follows:
Table 7. Total number of overnight stays (Romanian +foreign) by accommodation unit types in Bucharest
Types of tourist accommodation
2008 2009 2010 2011 2012
Hotels 1,962,515 1,659,464 1,797,653 1,961,320 2,028,731
Villas 1,351 926 : 1164 2,306
Tourist Hostels 23,041 10,040 8,500 9,549 9,023
PRINT ISSN 2284-7995, E-ISSN 2285-3952
Table 8. Total number of tourist overnight stays by accommodation unit type in Bucharest Romania
Types of tourist accommodation
2008 2009 2010 2011 2012
Hotels 874,044 734,530 794,525 870,534 884,551
Villas 475 307 : 355 566
Tourist Hostels 9,062 6,346 6,856 7,738 7,245
http://www.insse.ro/
Table 9. Total foreign overnight stays by accommodation unit type in Bucharest
Types of tourist accommodation
2008 2009 2010 2011 2012
Hotels 1,088,471 924,934 1,003,128 1,090,786 1,144,180
Villas 876 619 : 809 1,740
Tourist Hostels 13,979 3,694 1,644 1,811 1,778
http://www.insse.ro/
1. Index of global tourist demand change [3,4,5]:
100
0
0
CG CG
CG i
i
where: CGi- global tourist demand in year „i”;
CGo- global tourist demand in year „0”
Years Index of global tourist demand change (%)
2008-2009 104
2009-2010 113
2010-2011 115
2011-2012 94
The index of global tourist demand change registered the lowest value in 2011-2012, and the highest value in 2010-2011.
2.a)Index of global tourist demand distribution, between domestic and foreign demand [3,4,5] (domestic tourist demand):
100 ;
100 0
0
CG CE CE
CG CI
CI i i
where: CI - domestic tourist demand; CE - foreign tourist demand. CG – global tourist demand
Years CI-Domestic tourist demand (%)
2008 42
2009 40
2010 42
2011 45
2012 49
The index distribution of global tourism demand for domestic demand had the lowest value in 2009, and the highest value in 2012. 2.b)Index of global tourist demand distribution, between domestic and foreign
demand [3,4,5] (foreign tourist demand)
100 ;
100 0
0
CG CE CE
CG CI
CI i i
where: CI - domestic tourist demand; CE - foreign tourist demand. CG – global tourist demand
Years CE-Foreign tourist demand (%)
2008 57
2009 59
2010 57
2011 54
2012 59
The index distribution of global tourism demand for foreign tourism demand recorded the lowest value in 2011, and the highest value in 2009-2010.
3.a) Index of domestic demand variation in time [3,4,5]
100
0
0
CI CI
ICI i
i
unde: CIo – domestic tourism demand in the
previous year;
CIi– domestic tourism demand this year.
Years Index variation in demand for domestic tourism (%)
2008-2009 91
2009-2010 118
2010-2011 124
2011-2012 101
The index of variation in domestic tourism demand recorded the lowest value in the years 2008-2009, and the highest value in the years 2010-2011
PRINT ISSN 2284-7995, E-ISSN 2285-3952 time [3,4,5]
100
0
0
CE CE
ICE i
i
where: CEo – foreign tourism demand in the
previous year;
CEi– foreign tourism demand this year.
Years Index variation in the demand for foreign tourism (%)
2008-2009 43
2009-2010 110
2010-2011 108
2011-2012 104
The index of variation in the demand for foreign tourism recorded lowest value in the years 2008-2009, and the highest value was recorded in the years 2009-2010.
4. Index of demand variation in time for each accommodation facility [3,4,5]
; 100
0
CHo CHi CH i
Years Hotels (%)
Tourist Villas (%)
Hostels Tourist(%)
2008-2009 160 100 78
2009-2010 115 100 100
2010-2011 92 100 123
2011-2012 99 100 79
Hotel: index of variation in time of tourism demand for hotels recorded with lowest value in the years 2010-2011, and the highest value was recorded in the years 2008-2009.
Tourist Villas: index of variation in time of tourist demand for villas had fluctuations in the period.
Hostels Tourist: index variation in time of tourism demand for tourist hostels recorded with lowest value in the years 2008-2009, and the highest value in the years 2010-2011. 5.a)The average length of stay globally [3,4,5]
T ZT
S (days)
where: ZT = travel days (365 days) T = No. total tourists
Years Calculating the average length of stay globally (days)
2008 3.86
2009 4.03
2010 3.54
2011 3.07
2012 3.24
The average length of stay, based on the total number of tourists in 2008 was about 4 days, and in 2012 about 3 days, which shows a decrease.
5.b)The average length of stay for each accommodation facility [3,4,5]
If we want to calculate the average stay per accommodation units, this means to use number of overnight stays recorded in the accommodation establishments instead of the number of days of travel, as follows:
T NH
SH (tourist days)
where: NH - number of recorded overnight stay;
Τ - number of tourists arriving; SH - average stay in the hotel.
The total average length of stay = Nr. Total overnight stays (Romanian +foreign) / No. Total foreign +tourists Romanian
The average length of stay of foreign tourists = no. overnight stays Foreign tourists / No foreign tourists
The average length of stay of Romanian = no. overnight stays Romanian tourists / No Romanian tourists
The total average length of stay (Romanian + foreign) = tourist days
Years Hotels Tourist Villas
Hostels Tourist
2008 2.09 7.34 3.40
2009 1.84 8.41 2.25
2010 1.75 --- 2.00
2011 1.66 1.97 2.12
2012 1.66 2.49 2.25
The average length of stay (Romanian) = tourist days
Years Hotels Tourist Villas
Hostels Tourist
2008 2.01 7.42 4.23
2009 1.73 8.25 2.43
2010 1.69 --- 2.30
2011 1.70 2.39 2.21
2012 1.71 2.87 2.18
PRINT ISSN 2284-7995, E-ISSN 2285-3952
Years Hotels Tourist Villas
Hostels Tourist
2008 2.18 7.19 2.61
2009 2.01 8.77 2.34
2010 1.83 --- 1.94
2011 1.60 1.41 2.10
2012 1.60 1.78 2.27
a).The average stay in hotel recorded the lowest value in 2011 and 2012, and the highest value in 2008.
The average stay in villas had lowest value in 2010 and the highest value in 2009.
The average stay in guesthouses recorded the lowest value in 2010 and the highest value in 2008.
b)The average stay of the Romanian tourists in hotels registered the lowest value in 2011 and 2012, and the highest value in 2008. The average stay of the Romanian tourists in villas had the lowest value in 2010 and the highest value in 2009.
The average stay of the Romanian tourists in boarding houses recorded the lowest value in 2010 and the highest value in 2008.
c.)The average stay of foreign tourists in hotels registered the lowest value in 2011 and 2012, and the highest value in 2008.
The average stay of foreign tourists in villas had the lowest value in 2010 and the highest value in 2009.
The average stay of foreign tourists in boarding houses had the lowest value in 2010 and the highest value in 2008.
6. Themonthly traffic coefficient [3,4,5] The monthly traffic coefficient is calculated as a ratio between the number of tourists during the highest-traffic month (LM) and the number of tourists during the lowest-traffic month (lm)
lm LM
Cmonthly , where Cmonthly ≥ 1
127009 (October)/77658(January)=1.63 7. The monthly concentration coefficient [3,4,5] (year of study 2012)
was calculated by dividing the number of tourists recorded in each month by the total number of tourists during a year At. Value Cc
ranges between 0.083 and 1.
t c
A LM C
January = 77658/1223881 = 0.006 February = 77686/1223881 = 0.006 March = 103402/1223881 = 0.08 April = 94007/1223881 = 0.07 May = 120052/1223881 = 0.09 June = 114138/1223881 = 0.09 July = 101982/1223881 = 0.08 August = 96076/1223881 = 0.07 September = 112912/1223881 = 0.09 October = 127009/1223881 = 0.10 November = 115566/1223881 = 0.09 December = 81651/1223881 = 0.06
The tourist maximum concentration was recorded in October and the lowest monthly tourist concentration was recorded in January and February.
8. Share of accommodation capacity [3,4,5] (per each accommodation type) of the total accommodation capacity of Bucharest
100
LH LC Icc
where: LH - total number of beds in hotels (pensions, ... etc.) per town or county;
LC - accommodation capacity in each type of accommodation unit (hotel, motel, guest house, inn, ..., etc.);
Years Hotels (%) Tourist Villas (%)
Hostels Tourist(%)
2008 98 0.1 1.27
2009 98 0.1 0.94
2010 99 --- 0.82
2011 99 0.09 1.10
2012 99 0.09 0.88
The share of accommodation capacity (for each type of accommodation unit) of the total accommodation capacity of Bucharest, recorded the highest percentage of about 99% in hotels. For villas and guesthouses percentages were very small compared to hotels.
9. Indicator of total accommodation capacity
evolution [3,4,5]
ILC = (No. beds per current year / No beds per
previous year)*100
100 0
0
LC LC
LC i
PRINT ISSN 2284-7995, E-ISSN 2285-3952
Years ∆LCă(ș)
2008-2009 106
2009-2010 114
2010-2011 92
2011-2012 99
The accommodation capacity registered the highest increase of 14% in 2009-2010 and in 2010-2011 it declined by 8%.
10.Index of overnight stay evolution [3,4,5] IN = (No. overnight stay per current year / No.
overnight stay per previous year)*100
100
0
NH NH
N i
where: Ν = overnight stay.
Years Index of overnight stay evolution(%)
2008-2009 84
2009-2010 108
2010-2011 109
2011-2012 103
The evolution of overnight stays recorded the highest growth in 2001, increasing by 9% and in 2008-2009 it decreased by 16%.
11.Occupancy indicator of existing accommodation units in Bucharest[3,4,5] Cuc = [number of overnights (No tourist days) / (no. beds * no. working days)] * 100
100 100
0
Z LH
S NT Z
LH NH G
where:
Go - occupancy, percentage;
NH - number of overnight stays; LH - number of beds in hotels;
Ζ - number of supply days = 365 days; NT - number of tourists;
S - average length of stay.
Years Occupancy indicator of existing accommodation units in Bucharest (%)
2008 32
2009 25
2010 24
2011 28
2012 29
Since 2008, the occupancy indicator of existing accommodation units in Bucharest fell every year.
12. Tourist density indicator in relation to population densityin Bucharest[3,4,5]
Population T
D i
i
t t
0
0
(tourists/ no. inhabitants)
where:
Ti-0 - total Romanian + foreign tourists;
Pop - local population.
Years Tourist density indicator in relation to population density
2008 0.48
2009 2.14
2010 1.88
2011 1.61
2012 1.56
In the period under review, tourist traffic density in relation to population Bucharest had a decrease of 0.58% of tourists / No. inhabitants in 2012 compared to 2008.
13. Tourist density indicator in relation to Bucharest area [3,4,5]
Surface T
D i
i
t t
0
0
(tourists/km
2
)
where:
Ti-0 - total Romanian + foreign tourists;
S - town/village (county) area,
Years Tourist density indicator in relation to Bucharest area
2008 4.1453
2009 8.5287
2010 8.5186
2011 8.4182
2012 8.3882
Tourist traffic density in relation to surface of Bucharest had the lowest value of 4,145 tourists/km2 in 2012 and the highest value 8,528 tourists /km2 was recorded in 2009.
CONCLUSIONS
By the pressure of tourists and the specific infrastructure, tourism can be a direct cause of constraints on the environment.
The destructive actions on natural resources have a large variety and intensity increasing from year to year.
PRINT ISSN 2284-7995, E-ISSN 2285-3952
The arrangements made for tourism have also a significant negative impact on the environment.
More attention should be paid to the accommodation capacities, which need to cover the tourists demand, but also to be integrated in the environment, without affecting the natural environment, the original topography and the beauty of landscape. Tourism should not generate pollution and disrupt the existence of flora and fauna.
Also, tourism has to compile both tourists needs and also not to disturb the local population, and affect the traditions, moral values, customs, etc.
Bucharest, the capital of Romania is an example of how tourism should be integrated in the urban environment becoming a factor of economic development and promotion of Romanian values.
The number of tourists increased year by year, and the duration of stay as well, and more and more foreign visitors are interested to enjoy visiting the beautiful, cultural and historical places of the Romania's capital.
The accommodation units have increased their number and quality of their facilities year by year, hotels being the most preferred type for accommodation in Bucharest and Romania general.
The development strategy of tourism in Bucharest should be continuously improved in order to exploit the whole touristic potential of this old and modern metropolis of Europe.
REFERENCES
[1]Hon uşă Adelaidaă C.,ă 2005,ă Spatială touristic and agrotouristic planning, CERES Publishing House, Bucharest
[2]Hon uşă Adelaidaă C.,ă (2005,ă 200λ),ă żeographyă andă
agrotouristic Romania, CERES Publishing House, Bucharest
[3]Hon uşă Adelaidaă Cristina,ă 2014,ă "Analysisă ofă
tourism demand and supply - one of the essential elements of year in tourism planning area" Journal "Scientific Papers Series Management, Economic Engineering in Agriculture and Rural Development", Vol. 14(1)/2014: 147-152
[4]Hon uşă Adelaidaă Cristina,ă 2013,ă "Studyă onă touristă
traffic analysis area for tourism planning in the town of
Moreni,ă Dâmbovi aă county",ă Journală ofă UASVM-CN Bulletin Vol. 70(2)/2013, Section Horticulture, Horticulture UASVM Bulletin, pp. 331-338
[5]Hon uşă Adelaidaă Cristina,ă 2013,ă "Spaceă Tourismă
Organization and administrative arrangement of tourist traffic analysis by locality Logs" Journal "Scientific Papers Series Management, Economic Engineering in Agriculture and Rural Development", Vol. 13(4): 145-150
[6] Minciu Rodica, 2000, The tourism economy, Uranus Publishing House, Bucharest
[7]www.incdt.ro
[8]http://www.insse.ro/cms/files/Web_IDD_BD_ro/ind ex.htm