Genetic testing and risk interpretation: How do women understand
lifetime risk results?
Yaniv Hanoch
∗University of Plymouth
Talya Miron-Shatz
∗Princeton University and
Ono Academic College, Israel
Mary Himmelstein
Princeton University
Abstract
Genetic screening for BRCA1 and BRCA2 gives women the opportunity for early detection, surveillance, and inter-vention. One key feature of genetic testing and counseling is the provision of personal lifetime risk. However, little attention has been paid to how women interpret lifetime risk information, despite the fact that they base screening, treatment and family planning decisions on such information. To study this vital issue, we set out to test the ability of women to choose the most appropriate interpretation of National Cancer Institute’s (NCI) message about lifetime risk of developing cancer for a woman with altered BRCA1 and BRCA2 genes. Participants included 277 women who had not undergone genetic testing or had cancer and 207 women who had undergone genetic testing or had cancer. Over 50% of the women who had not undergone genetic testing or had cancer and 40% of those who had undergone genetic testing or had cancer misunderstood NCI’s information. Furthermore, in line with a growing body of research, we found that high numeracy level (objective or subjective) is positively associated with a woman’s ability to correctly interpret NCI’s message.
Keywords: Genetic counseling, lifetime risk, numeracy, risk perception.
1
Introduction
Genetic screening for BRCA1 and BRCA2 — gene mu-tations that are associated with higher risk of develop-ing breast and ovarian cancers — gives women a shot at early detection, surveillance, and intervention (Heshka, Palleschi, Howley Wilson & Wells, 2008). One key fea-ture of the genetic counseling process is the provision of personal lifetime risk — or the risk of developing a spe-cific disease during one’s lifetime (Armstrong, Eisen, & Weber, 2000). Indeed, both patients and genetic coun-selors rate communication of lifetime risk information as a pivotal part of the process (Lobb et al., 2003). This is not surprising, as women who test positive for BRCA1/2 often rely on lifetime risk estimates to make future family plans (e.g., having children; MacDonald, et al., 2002) and to decide whether to undergo mastectomy despite being cancer free (Harmon, 2008).
∗Yaniv Hanoch and Talya Miron-Shatz contributed equally to the
preparation of the article. The authors would like to Alice Muelhof, an anonymous reviewer, Jonathan Baron and Peter Ubel for comments on earlier drafts. The study was supported by the Center for Health and Wellbeing, Princeton University and by an NIA pilot grant # 400–6223 and by NIH Grant P30 AG024361. Address: Yaniv Hanoch, University of Plymouth, School of Psychology, Drake Circus, Plymouth PL4 8AA, UK. Email: [email protected]. Talya Miron-Shatz, Cen-ter for Health and Wellbeing, Princeton University, 327 Wallace Hall, Princeton, NJ. Email: [email protected].
Given the importance of lifetime risk information, re-searchers have been interested in whether women overes-timate or underesoveres-timate their lifetime risk of developing cancer (Fagerlin, Zikmund-Fisher & Ubel, 2005; Heshka, Palleschi, Howley Wilson & Wells, 2008; Katapodi, Lee, Faciona & Dodd, 2004). Others have investigated the re-lationship between risk perception and emotional reac-tion, as well as between risk perception and mammogra-phy screening, and whether leaflets, genetic testing, and risk counseling improve women’s accuracy in estimat-ing their lifetime risk of developestimat-ing cancer (Hallowell, Statham & Murton, 1998; Hopwood, Howell, Lallo & Evans, 2003; Lipkus, Biradavolu, Fenn, Keller, & Rimer, 2001; Slaytor & Ward, 1998; Vernon, 1999).
Although earlier studies examined women’s estima-tion of their lifetime risk, a more fundamental issue is how women interpret lifetime risk information. After all, if women misunderstand the meaning of lifetime risk, whether they overestimate or underestimate incorrectly interpreted risk would be less important. Indeed, re-search has shown that people interpret numerical prob-abilities in multiple, mutually contradictory ways. Re-searchers (Gigerenzer, Hertwig, Van den Broek, Fasolo & Katsikopoulos, 2005; Murphy, Lichtenstein, Fischhoff & Winkler, 1980) have demonstrated that individuals in-terpret the seemingly unambiguous statement “There is a 30% chance of rain tomorrow” in different ways: “It will
rain tomorrow in 30% of the region”, “for 30% of the time”, or “on 30% of the days like tomorrow” (Gigeren-zer et al., 2005 p. 625). Since people misconstrue com-mon and mundane probabilistic information, interpreting probabilistic information like lifetime risk of develop-ing cancer proves to be an even greater challenge, given the added emotional impact. To the authors’ knowledge, however, no previous studies have examined how women interpret statements regarding their lifetime risk of devel-oping cancer or what variables (e.g., numeracy) might af-fect women’s ability to correctly interpret such informa-tion.
A growing corpus of research has shown that numeracy — the ability to understand basic mathematical concepts — is important to the quality of decisions (Peters et al., 2006). Accordingly, researchers have long argued that numeracy levels play a key role in a host of medical deci-sion making and might influence the way people perceive and understand risk (Ancker & Kaufman, 2007; Lipkus, Samsa, & Rimer, 2001; Woloshin, Schwartz, Black & Welch, 1999). A recent review (Nelson, Reyna, Fagerlin, Lipkus & Peters, 2008; Reyna, 2001; Reyna & Brainerd, 2007) summarized this idea well: “Low numeracy is per-vasive and constrains informed patient choice. . . impairs risk communication, and affects medical outcome” (Nel-son et al., 2008: p. 261; emphasis added). While data strongly indicate the existence of a relationship between numeracy and medical decision making, whether numer-acy levels affect women’s ability to interpret lifetime risk data is still an unanswered question.
In light of the abovementioned research and the gap in the existing literature, we set out to examine two related hypotheses. We first predicted that a statement about life-time risk of developing cancer would give rise to various interpretations, not all of which would be correct. Sec-ond, we predicted that participants with higher numeracy levels will have a better understanding of lifetime risk in-formation than their peers with lower numeracy levels.
2
Experiment 1
The goal of this study was to provide initial evidence for our hypotheses regarding the ability of women to accu-rately interpret the NCI statement about lifetime risk of developing cancer, examine the relationship between nu-meracy levels and understanding of lifetime risk informa-tion, and evaluate whether higher numeracy levels lead to more accurate risk estimation.
2.1
Methods
Participants. Participants included 277 women, who completed an online survey through advertisements on
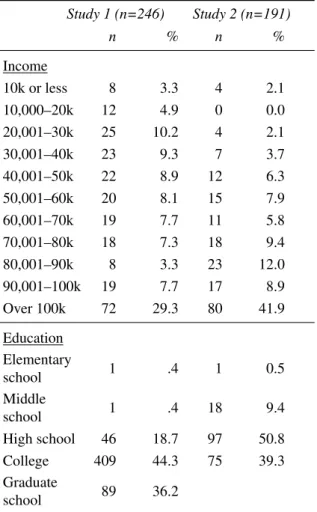
Table 1: Genetic testing and lifetime risk
Study 1 (n=246) Study 2 (n=191)
n % n %
Income
10k or less 8 3.3 4 2.1 10,000–20k 12 4.9 0 0.0 20,001–30k 25 10.2 4 2.1 30,001–40k 23 9.3 7 3.7 40,001–50k 22 8.9 12 6.3 50,001–60k 20 8.1 15 7.9 60,001–70k 19 7.7 11 5.8 70,001–80k 18 7.3 18 9.4 80,001–90k 8 3.3 23 12.0 90,001–100k 19 7.7 17 8.9 Over 100k 72 29.3 80 41.9 Education
Elementary
school 1 .4 1 0.5
Middle
school 1 .4 18 9.4 High school 46 18.7 97 50.8 College 409 44.3 75 39.3 Graduate
school 89 36.2
Procedure. Participants read the following informa-tion — taken directly from the official website of the Na-tional Cancer Institute (NCI, Unites States) — about life-time risk of women with an altered BRCA1 or BRCA2 gene:
According to estimates of lifetime risk, about 13.2% (132 out of 1,000 individuals) of women in the general population will develop breast cancer, compared with es-timates of 36 to 85% (360–850 out of 1000) of women with an altered BRCA1 or BRCA2 gene. In other words, women with an altered BRCA1 or BRCA2 gene are 3 to 7 times more likely to develop breast cancer than women with-out alterations in those genes (National Cancer In-stitute, 2002).
This statement was present on all pages that contained questions relating to risk interpretation, including most appropriate interpretation.
Most appropriate.After reading the above NCI state-ment, participants were asked to choose the most appro-priate interpretation. Choices included (i) “Breast can-cer will develop in 36 to 85% of women who are found to have BRCA1 and BRCA2 alterations” (the correct choice), (ii) “Breast cancer will develop in all women aged 36 to 85,” (iii) “Women who have BRCA1 and BRCA2 alterations will exhibit 36 to 85% of the symp-toms associated with breast cancer,” and (iv) “Women who are found to have alterations in the genes called BRCA1 and BRCA2 have 36% to 85% higher chance of developing breast cancer.” We created the variable, “Most appropriate correct,” in which participants were coded as 1 (correct) for choosing the correct answer and 0 ( incor-rect) otherwise.
Numeracy. Participants completed a numeracy scale (α= 0.68) composed of 11 items (Lipkus, Samsa &
Rimer, 2001). Following the protocol of previous studies (Peters et al., 2006), we clustered participants into those with high numeracy levels versus those with low numer-acy levels based on a median split on numernumer-acy score. Participants who received a score of 9 or above were con-sidered to possess high numeracy levels (n= 128); those with low numeracy levels received a score of 8 or less (n= 111). Participants in the high numeracy group were better educated than their low numeracy counterparts,
t(237) = –3.15, p < .002. No difference existed between numeracy groups on age or income. This classification of high versus low numeracy level participants was only used in the context of oneχ2test comparing group
dis-tribution on most appropriate correct. For regression, we used continuous numeracy, which yielded similar results as the dichotomous numeracy variable.
2.2
Results
Most appropriate. Less than half the participants, 48.7% (n= 128), chose the correct interpretation (option 1 above). A similar proportion (45.6%,n= 120) believed that “Women who are found to have alterations in the genes called BRCA1 and BRCA2 have a 36% to 85% higher chance of developing breast cancer” was the right answer. An additional 4.2% (n= 11) chose “Women who have BRCA1 and BRCA2 alterations will exhibit 36 to 85% of the symptoms associated with breast cancer,” and 1.5% (n= 4) indicated that “Breast cancer will develop in all women ages 36 to 85” was the right answer. Thus, over 50% of our sample misrepresented the information provided by NCI.
A logistic regression on most appropriate correct by age, education, and continuous numeracy yielded sev-eral significant predictors. The chances of choosing the correct answer decreased as age increased (unstandard-ized B = –.02,SE= .10,p< .03). The likelihood of choos-ing the correct interpretation increased as education in-creased (B = .40SE= .20,p< .04) and numeracy level in-creased (B = .22SE= .06,p< .0001).
Numeracy. In line with earlier studies, we were inter-ested in numeracy’s relationship with women’s ability to correctly interpret the NCI message, as well as with their risk perception. As predicted, numeracy level (contin-uous) significantly correlated positively with a ability to choose the correct interpretation of lifetime risk for breast cancer based on BRCA1/2 status, r(239) = .28,p < .01. The low numeracy group chose the correct interpretation about 35% of the time compared with the high numeracy participants, who chose the correct interpretation 64% of the time (Table 2).
2.3
Discussion
Do women accurately interpret the NCI message regard-ing life time risk of developregard-ing breast cancer? Are women with high numeracy levels better able to inter-pret the NCI message? Study 1 provided initial evidence that women misinterpret the NCI lifetime risk message. Indeed, only half of the participants provided the cor-rect answer. Our results also supported our prediction that numeracy levels would be associated with more ac-curate interpretation of the NCI message. Women who were classified as high numeracy were significantly more likely to provide the correct interpretation compared to women with low numeracy levels.
can-Table 2: Differences in comprehension, in terms of most appropriate correct. χ2 tests are two tailed and
uncor-rected for continuity.
Study 1 Numeracy
Low (0–8)
High
(9–11) Total χ2 Correct 72 46 118 19.90 Incorrect 39 82 121 p < .0001 Total 111 128 239
Study 2 Numeracy
Low (0–8)
High
(9–11) Total χ2 Correct 43 80 123 11.04 Incorrect 49 35 84 p < .001 Total 92 115 207
Comparison between studies
Study
1 2 Total χ2
Incorrect 143 84 227 5.80 Correct 134 123 257 p = .016 Total 277 257 484
cer, it is impossible for us to tell whether our results can be applied to women who have undergone or consider undergoing genetic testing or women who have had can-cer. That is, women who are cancer-free and who have never considered genetic testing might be less likely to seek information about genetic testing and may have less motivation to fully engage in our study. Thus, it is im-portant to examine how women who intend to undergo genetic testing, have already undergone genetic testing or have had cancer interpret the NCI message. It is feasible, after all, that this group of women would perform much better on our tasks as they have a clear interest in fully understanding their lifetime risk of developing cancer.
Finally, a number of authors (Fagerlin, Fisher, Ubel, Jankovic, Derry & Smith, 2007; Zikmund-Fisher, Smith, Ubel, & Fagerlin, 2007) have raised con-cerns over the usage of objective numeracy measures like the one used in Study 1. The authors argue that partici-pants are not generally willing to undergo aptitude tests. More importantly, using objective measures of numeracy in internet-based studies is problematic, as researchers are unable to control participants’ reliance on others or calculators in solving the numeracy problems. These
is-sues serve as the underlying motivation to develop the Subjective Numeracy Scale (SNS) (Fagerlin, et al., 2007; Zikmund-Fisher, et al., 2007). The SNC has the advan-tage of being quicker, more accessible and less likely to cause participants to seek external help. At the same time, it is as useful in measuring numeracy abilities as more ob-jective measures (Zikmund-Fisher et al., 2007).
3
Experiment 2
To overcome two of the limitations in the first study, we amended our research in two important ways. Our sec-ond study involved women who had either undergone ge-netic testing or had cancer previously. With a more eco-logically valid sample, we ensured that our participants possessed knowledge about and experience with genetic testing, thus eliminating the possibility that our initial re-sults were due to ignorance about genetic testing. Our sample was likely more engaged as well, increasing the likelihood that any misconceptions stemmed from the na-ture of the NCI message rather than from participants’ lack of motivation. Furthermore, to address the concerns over usage of an objective numeracy scale (Lipkus et al., 2001) in an internet-based study, we decided to employ the newly developed subjective numeracy scale (Fager-lin et al., 2007; Zikmund-Fisher et al., 2007). By using the SNS, we were able to overcome concerns over partic-ipants’ reluctance to engage in problem-solving and re-duced the likelihood that participants were seeking ex-ternal aid (e.g., calculator or another person). Our aims, however, remained the same as in Study 1. We first pre-dicted that a statement about lifetime risk of developing cancer would give rise to various interpretations, not all of which would be correct. Second, we predicted that par-ticipants with higher numeracy levels would have a bet-ter understanding of lifetime risk information than their peers with lower numeracy levels.
3.1
Method
Partici-pants were included in the analysis if they completed at least two questions in the survey; missing responses in the survey ranged from 0 to 18 (0–8.7% of sample). When the number of participants varies from the sample size (n= 207), n is indicated. The mean age of participants was 43.13 (SD= 9.69,n= 189). Additional demographic information can be found in Table 1.
Procedure.The procedure was nearly identical to that found in the first study. The only notable difference in-volved numeracy, described below.
Numeracy. Participants completed the subjective nu-meracy scale: α= 0.89 (Fagerlin et al., 2007;
Zikmund-Fisher et al., 2007), which consisted of 8 items. The scale is more user-friendly and roughly equivalent (r= 0.7) to the standard numeracy scale used in the study above (Zikmund-Fisher et al., 2007; Fagerlin et al., 2007). Participants rated their subjective ability with fractions, percentages, calculating tips, calculating discounts, and reading newspaper tables and graphs on a scale of 1 (not at all good) to 6 (extremely good). Two questions as-sessed preference for numeric or lexical presentation of mathematical data, rated on a scale of 1 (always prefer words) to 6 (always prefer numbers). The final question indicated how useful the participant find numeric infor-mation, on a scale of 1 (never useful) to 6 (always use-ful). The scale score represented the mean response to all 8 questions.
As in the previous study, we performed a median split to determine participants high in numeracy (mean subjec-tive numeracy score greater than or equal to 4.625) versus those low in numeracy (mean subjective numeracy score less than 4.625). The low subjective numeracy group con-sisted of 92 participants who scored, on average, 3.61 on subjective numeracy (SD= 0.71). The high subjec-tive numeracy group consisted of 115 participants who scored, on average, 5.27 (SD= 0.42). Participants who scored high in subjective numeracy (M= 9.18,SD= 2.43,
n= 106) were in a higher income bracket than participants low in subjective numeracy (M= 8.22,SD= 2.73,n= 85):
t(189) = –2.56, p< .01. No differences existed between numeracy groups on age or education.
Results
Most appropriate. Slightly more than half, 59.4% (n= 123), chose the correct interpretation (option 1 above). A similar proportion (40.1%, n= 83) believed that “Women who are found to have alterations in the genes called BRCA1 and BRCA2 have a 36% to 85% higher chance of developing breast cancer” was the right answer. An additional 0.5% (n= 1) chose “Women who have BRCA1 and BRCA2 alterations will exhibit 36 to 85% of the symptoms associated with breast cancer.” No one in the second sample believed all women with
BRCA1 and BRCA2 would develop breast cancer. Still, over 40% of the sample misrepresented the information provided by the NCI.
A logistic regression on most appropriate correct by age, education, and subjective numeracy (continuous) yielded several significant predictors. The chances of choosing the correct answer decreased as age increased (B = –.03, SE= .16, p< .04). The likelihood of choos-ing the correct interpretation increased as education in-creased (B = .51SE= .25,p< .01) and subjective numer-acy increased (B = .56SE= .17,p < .02).
Numeracy.In line with earlier studies, we were inter-ested in numeracy’s relationship with a woman’s ability to correctly interpret the NCI message, as well as with her risk perception. As predicted, numeracy level (con-tinuous) significantly correlated positively with a partici-pant’s ability to choose the correct interpretation of life-time risk for breast cancer based on BRCA1/2 status,
r(207) = .29,p< .01. The low numeracy group chose the correct interpretation about 47% of the time compared with the high numeracy participants, who chose the cor-rect interpretation 70% of the time (see Table 2).
3.1.1 Between-study comparison
Participants in Study 2 were slightly older (M= 43.13,
SD= 40.68) than participants in experiment 1 (M= 40.68,
SD= 13.63):t(447) = –2.11,p< .04. Participants in Study 2 (M= 8.75,SD= 2.61) also had slightly higher income than participants in experiment 1 (M =7.19,SD= 3.30):
t(449) = –5.42,p< .001. Participants in Study 2 (123 of 207 versus 134 of 277) were generally more likely to choose the correct interpretation of breast cancer risk:
χ2= 5.80,p< .02.
3.2
Discussion
cor-rect interpretation of lifetime risk for breast cancer based on BRCA1/2 status. Thus, Study 2 complements and ex-tends our findings from Study 1 in two important ways. First, it indicates that the ability to correctly interpret genetic testing results about lifetime risk of developing breast cancer is a challenging task regardless of whether one has relevant knowledge. Second, our data also pro-vides support for the utility of using a subjective measure of numeracy.
4
General discussion
DNA technology has been developing rapidly, leading to an enhanced use of genetic testing in our understanding of disease diagnosis, treatment, and prevention. At the same time, there has been greater concern over people’s ability to understand and use lifetime risk information. Previous research has demonstrated, for example, that women often overestimate or underestimate their prob-ability of developing cancer (Lipkus, Samsa & Rimer, 2001). Yet, researchers have barely paid attention to ex-actly how women interpret lifetime risk information re-garding cancer development.
Our results demonstrate that women — regardless of whether they have undergone BRCA1/2 genetic testing or not — translate lifetime risk information about the prob-ability of developing breast cancer in multiple ways: ex-amples include (a) the number of people of who will de-velop cancer, (b) the age range by which a woman will develop breast cancer, (c) the percentage of symptoms that a women is likely to experience, and (d) as a com-parison to other women. The participants in our studies often chose the wrong interpretation.
Our data are more striking than the ones reported in previous studies (Gigerenzer, Hertwig, Van den Broek, Fasolo & Katsikopoulos, 2005) for many reasons. First, the information provided by NCI and used in our exper-iment spelled out the reference class. That is, partici-pants were clearly informed that 360–850 out of 1000 women with an altered BRCA1/2 gene are likely to de-velop breast cancer. Such presentation is associated with increased accuracy, in contrast with the traditional probabilistic presentation (Gigerenzer, Gaissmaier, Kurz-Milcke, Schwartz & Woloshin, 2008). Second, the NCI information states that women with altered BRCA1/2 genes have 3–7 times the risk of developing breast can-cer, not 36–85% higher risk as almost half of our sam-ple believed. This is not minor misinterpretation, as hav-ing a 36–85% higher risk of develophav-ing breast cancer is equal to a lifetime risk of only 18–24.4%, which is 2– 3.5 timeslower than a lifetime risk of 36–85%. Third, even though women who had undergone genetic testing for BRCA 1/2 exhibited better performance, over 40%
failed to identify the correct answer. Earlier studies (Bu-tow, Lobb, Meiser, Barratt, & Tucker, 2003; Meiser & Halliday, 2002) have shown that risk perception improves after genetic counseling, which could help explain the improved results. However, the effects of improved risk perception seem relatively short-term (see Sivell, Elwyn, Gaff, Clarke, Iredale et al., 2008). As we had no data regarding the time interval between undergoing genetic testing and participating in our research, it is possible that evaluating women directly after the genetic counseling session would yield better results. Finally, women’s false intuition about the correct answer is similar to the find-ings reported by Kahneman and Federick (2002) in other domains. In addition, both of our samples were more ed-ucated and wealthier than the general population, which raises even more concern over how a less educated and less affluent group would fare on our task. On the some-what positive side, only 6% (and practically none among those who had undergone genetic testing) of our sample from study 1 believed that the NCI information indicated that all women between 36–85 years of age will develop breast cancer or that women with BRCA1/2 will experi-ence 36–85% of the symptoms.
These results raise important questions about earlier re-search that focused on how accurately women estimate their lifetime risk. If women misinterpret the meaning of predicted lifetime risk, it is unclear what information they are actually estimating. For example, if women un-derstand NCI’s information as indicating that all women between 36–85 years of age will develop breast cancer, do they over- or underestimate the age by which women would develop cancer? Do they attempt to estimate the percentage of symptoms that a woman will experience? Or do they estimate the likelihood that a woman with positive BRCA1/2 results will develop cancer? Unfor-tunately, we are unable to provide satisfactory answers.
Our data strongly demonstrate that objective numer-acy levels play a crucial role in a woman’s ability to correctly identify the NCI’s intended message. Our re-sults also reveal a similar pattern with regard to subjec-tive numeracy levels, providing further support to using subjective numeracy measures rather than more objec-tives ones. Taken together, our data from the two studies are perfectly aligned with a growing body of evidence demonstrating the importance of numeracy in decision making in general, and medical decision making in par-ticular (Gigerenzer, Gaissmaier, Kurz-Milcke, Schwartz & Woloshin, 2008; Peters et al., 2006). Our study thus provides further support for the connection between nu-meracy level and accurate risk perception.
suf-fered from a low response rate. Thus, we are unable to tell whether those who participated in Study 2 are repre-sentative of the women who undergo genetic testing for BRCA 1/2. Since we have not evaluated general literacy levels and focused only on numeracy abilities, it is pos-sible that general literacy levels are also associated with better ability to interpret the NCI message. A number of researchers (e.g., Brewer, Tzeng, Lillie, Edwards, Pep-percorn, et al., 2009) have demonstrated that low health literacy is related to higher risk perception for developing breast cancer. Given the complexity of the NCI message and of the result from genetic testing, it is important that future studies evaluate both general literacy levels as well as numeracy abilities. Despite these limitations, our data are important for a number of reasons. In addition, de-spite earlier indications showing that including numeric risk information can increase trust and belief in the mes-sage (Gurmankin, Baron, & Armstrong, 2004), we did not pursue this important line of investigation. Our re-sults, nonetheless, clearly demonstrate that women (re-gardless of whether they have undergone genetic testing) understand lifetime risk information in more than one way. We also highlight the importance of (objective and subjective) numeracy in understanding lifetime risk infor-mation.
This study focused on women and breast cancer, yet it is likely that similar results would emerge with males and with other medical conditions (e.g., coronary heart dis-ease; e.g., Lloyd-Jones, Larson, Beiser, & Levy, 1999). Furthermore, we concentrated on lifetime risk informa-tion, given that academics, practitioners and national can-cer organizations use this terminology. It is possible that using a one-year or a five-year risk estimate would yield similar results. Further research should examine whether the obstacle to correct interpretation lies with the concept of lifetime risk itself, or from the fact that lifetime risk is presented as a range. As genetic testing becomes more widespread and available options increase, it is important to ensure that patients correctly interpret the lifetime risk information yielded by these tests and do not act upon misconstrued lifetime risk assessments.
References
Ancker, J. S., & Kaufman, D. (2007). Rethinking health numeracy: A multidisciplinary literature review. Jour-nal of the American Medical Informatics Association, 14,713–721.
Armstrong, K., Eisen, A., & Weber, B. (2000). Assess-ing the risk of breast cancer. New England Journal of Medicine, 342, 564–471.
Brewer, N. T., Tzeng, J. P., Lillie, S. E., Edwards, A. S., Peppercorn, J. M., & Rimer, B. K. (2009). Health
lit-eracy and cancer risk perception: Implications for ge-nomic risk communication.Medical Decision Making, 9, 57–66.
Butow, P. N., Lobb, E. A., Meiser, B., Barratt, A. & Tucker, K. M. (2003). Psychological outcomes and risk perception after genetic testing and counselling in breast cancer: A systematic review. Medical Journal of Australia, 178, 77–81.
Fagerlin, A., Zikmund-Fisher, B. J., & Ubel, P. A. (2005). How making risk estimate can change the feel of that risk: Shifting attitudes toward breast cancer risk in a general public survey.Patient Education and Counsel-ing, 57, 294–299.
Fagerlin, A., Zikmund-Fisher, B. J., Ubel, P. A., Jankovic, Al., Derry, H. A., & Smith, D. M. (2007). Measuring numeracy without a math test: Develop-ment of the subjective numeracy scale. Medical De-cision Making, 27, 672–680.
Gigerenzer, G., Gaissmaier, W., Kurz-Milcke, E., Schwartz, L. M., & Woloshin, S. (2008). Helping doc-tors and patients make sense of health statistics. Psy-chological Science in the Public Interest, 8, 53–96. Gigerenzer, G., Hertwig, R., Van den Broek, E., Fasolo,
B., & Katsikopoulos, K. V. (2005). A 30% chance of rain tomorrow: How does the public understand proba-bilistic weather forecasts?Risk Analysis, 25, 623–629. Gurmankin, A. D., Baron, J., & Armstrong, K. (2004). The effect of numerical statements of risk on trust and comfort with hypothetical physician risk communica-tion.Medical Decision Making, 24, 265–271.
Hallowell, N., Statham, H., & Murton, F. (1998). Women’s understanding of their risk of developing breast/ovarian cancer before and after genetic counsel-ing.Journal of Genetic Counseling, 7, 345–364. Harmon, A. (2007, Sept 16). Cancer free at
33, but weighing a mastectomy. New York Times. Retrieved October 10, 2008, from
http://www.nytimes.com/2007/09/16/health/16gene.html? _r=1&scp=1&sq=cancer+free+at+33&st=nyt3
Heshka, J. T., Palleschi, C., Howley, H., Wilson, B., & Wells, P. S. (2008). A systematic review of perceived risks, psychological and behavioral impacts of genetic testing.Genetics in Medicine, 10, 19–32.
Hopwood, P., Howell, A., Lalloo, F., & Evans, G. (2003). Do women understand the odds? Risk perceptions and recall of risk information in women with family history of breast cancer.Community Genetics, 6, 214–223. Kahneman, D. & Frederick, S. (2002).
Representative-ness revisited: Attribute substitution in intuitive judg-ment. In T. Gilovich D. Griffin & D. Kahneman (Eds.),
Heuristics of Intuitive Judgment: Extensions and Ap-plications (pp. 48–81). New York: Cambridge Univer-sity Press
M. J. (2004). Predictors of perceived breast cancer risk and the relation between perceived risk and breast cancer screening: A meta-analytic review. Preventive Medicine, 38,388–402.
Lipkus, I. M., Biradavolu, M., Fenn, K., Keller, P., & Rimer, B. K. (2001). Informing women about their breast cancer risks: Truth and consequences. Health Communication, 13, 205–229.
Lipkus, I. M., Samsa, G., & Rimer, B. K. (2001) General performance on a numeracy scale among highly edu-cated samples.Medical Decision Making, 21, 37–44. Lobb, E. A., Butow, P. N., Meiser, B., Barratt, A., Gaff,
C., Young, M., et al. (2003). Women’s preference and consultants’ communication of risk in consulta-tions about familial breast cancer: Impact and patient outcome. Journal of Medical Genetics, 40,1–8. Lloyd-Jones,D. M., Larson, M. G., Beiser, A. & Levy,
D. (1999). Lifetime risk of developing coronary heart disease.Lancet, 353, 89–92.
MacDonald, D. J., Choi, J., Sand, S., McCaffrey, S., Blazer, K. R., Grant, M., et al. (2002). Concerns of women presenting to a comprehensive cancer centre for genetic cancer risk assessment.Journal of Medical Genetics, 39,526–530.
Meiser, B., & Halliday, J. L. (2002). What is the impact of genetic counseling in women at increased risk of developing hereditary breast cancer?Social Science & Medicine, 54, 1462–1470.
Murphy, A. H., Lichtenstein, S., Fischhoff, B., & Win-kler, R. L. (1980). Misinterpretation of precipitation probability forecasts. Bulletin of the American Meteo-rological Society, 61,695–701.
National Cancer Institute. (2002, February). National cancer institute fact sheet, genetic testing for BRCA1 and BRCA2: It’s your choice. Retrieved April 10, 2009, from the National Cancer Institute Web Site: http://www.cancer.gov/cancertopics/factsheet/risk/brca. Nelson, W., Reyna, V. F., Fagerlin, A., Lipkus, I., &
Peters, E. (2008). Clinical implications of numeracy: Theory and practice. Annals of behavioral medicine, 35,261–274.
Peters, E., Vastfjall, D., Slovic, P., Mertz, C. K., Maz-zocco, K., & Dickert, S. (2006). Numeracy and deci-sion making.Psychological Science, 17, 407–413. Reyna, V. F. (2001). Genetic testing and medical decision
making. Archives of Internal Medicine, 161, 2406– 2408.
Reyna, V. F., & Brainerd, C. J. (2007). The importance of mathematics in health and human judgment: Numer-acy, risk communication, and medical decision mak-ing. Learning and Individual Differences, 17, 147– 159.
Sivell, S., Elwyn, E., Gaff, C. L., Clarke, A. J., Iredale, R., Shaw, C., Dundon, J., Thornton, H., & Edwards, A. (2008). How risk is perceived, constructed and inter-preted by clients in clinical genetics, and the effects on decision making: Systematic review. Journal of Ge-netic Counseling, 17, 30–63.
Slaytor, E. K., & Ward, J. E. (1998). How risk of breast cancer and benefits of screening are communicated to women: Analysis of 58 pamphlets. British Medical Journal, 317,263–264.
Vernon, S. W. (1999). Risk perception and risk communi-cation for cancer screening behaviors: A review. Jour-nal of the NatioJour-nal Cancer Institute Monographs, 25, 101–119.
Woloshin, S., Schwartz, L., Black, W. C., & Welch, H. (1999). Women’s perception of breast cancer risk: How you ask matters. Medical Decision Making, 19, 221–229.