The wings before the bird: an evaluation of
flapping-based locomotory hypotheses in
bird antecedents
T. Alexander Dececchi1, Hans C.E. Larsson2and Michael B. Habib3,4 1Department of Geological Sciences, Queens University, Kingston, Ontario, Canada
2Redpath Museum, McGill University, Montreal, Quebec, Canada
3Keck School of Medicine of USC, Department of Cell and Neurobiology, University of Southern California, Los Angeles, California, United States
4Dinosaur Institute, Natural History Museum of Los Angeles, Los Angeles, CA, United States
ABSTRACT
Background:Powered flight is implicated as a major driver for the success of birds. Here we examine the effectiveness of three hypothesized pathways for the evolution of the flight stroke, the forelimb motion that powers aerial locomotion, in a terrestrial setting across a range of stem and basal avians: flap running, Wing Assisted Incline Running (WAIR), and wing-assisted leaping.
Methods:Using biomechanical mathematical models based on known aerodynamic principals and in vivo experiments and ground truthed using extant avians we seek to test if an incipient flight stroke may have contributed sufficient force to permit flap running, WAIR, or leaping takeoff along the phylogenetic lineage from Coelurosauria to birds.
Results:None of these behaviours were found to meet the biomechanical threshold requirements before Paraves. Neither was there a continuous trend of refinement for any of these biomechanical performances across phylogeny nor a signal of universal applicability near the origin of birds. None of these flap-based locomotory models appear to have been a major influence on pre-flight character acquisition such as pennaceous feathers, suggesting non-locomotory behaviours, and less stringent locomotory behaviours such as balancing and braking, played a role in the evolution of the maniraptoran wing and nascent flight stroke. We find no support for widespread prevalence of WAIR in non-avian theropods, but can’t reject its presence in large winged, small-bodied taxa likeMicroraptorand Archaeopteryx.
Discussion:Using our first principles approach we find that “near flight” locomotor behaviors are most sensitive to wing area, and that non-locomotory related selection regimes likely expanded wing area well before WAIR and other such behaviors were possible in derived avians. These results suggest that investigations of the drivers for wing expansion and feather elongation in theropods need not be intrinsically linked to locomotory adaptations, and this separation is critical for our understanding of the origin of powered flight and avian evolution.
Subjects Evolutionary Studies, Paleontology
Keywords Flight, WAIR, Maniraptora, Macroevolution, Theropoda, Flap running, Flight stroke
Submitted23 January 2016
Accepted27 May 2016
Published7 July 2016
Corresponding author
T. Alexander Dececchi, [email protected]
Academic editor
Andrew Farke
Additional Information and Declarations can be found on page 31
DOI10.7717/peerj.2159
Copyright
2016 Dececchi et al.
Distributed under
INTRODUCTION
Evolution of powered flight in vertebrates was a key innovation that spurred the evolutionary success of birds, bats, and pterosaurs (Sears et al., 2006;Butler et al., 2009;
Benson & Choiniere, 2013). Of the three radiations, the theropod to bird transition has
garnered the most interest and scholarship due to the higher quality of the fossil record documenting the origin and refinement of their flight including: the evolution of feathers, reduced body size, an avian-like physiology and respiration, elongate forelimbs, and modifications of the pectoral and forelimb musculoskeletal system (Baier, Gatesy &
Jenkins, 2007;Codd et al., 2008;Dececchi & Larsson, 2009;Dececchi & Larsson, 2013;
Makovicky & Zanno, 2011;Benson & Choiniere, 2013;Brusatte et al., 2014;Xu et al., 2014).
Despite the wealth of fossil evidence documenting this transition deducing the origin and subsequent evolution of the flight stroke, a biomechanical innovation that permitted aerial locomotion, remains elusive.
The flight stroke of extant birds traces a complex ellipsoidal path that is controlled by derived muscle origins and insertions and modified shoulder, elbow, and wrist joints and ligaments (Gatesy & Baier, 2005). Many antecedent functions of the flight stroke have been proposed. These include a raptorial function of the forelimbs for fast prey capture
(Ostrom, 1974), behavioural precursors such as courtship, balance, or warning displays
(Fowler et al., 2011;Foth, Tischlinger & Rauhut, 2014), as well as locomotory functions
(Caple, Balda & Willis, 1983;Dial, 2003;Chatterjee & Templin, 2007).
Powered flight differs from gliding flight in that it uses active flapping to generate thrust. Some models of the origin of avian flight propose antecedents living in trees and deriving the flight stroke from a parachuting or gliding stage (Chatterjee & Templin, 2004;
Alexander et al., 2010;Dyke et al., 2013) based primarily on the observation that many
modern arboreal tetrapods perform similar behaviors (Dudley et al., 2007;Evangelista
et al., 2014). Yet nearly all stem avians have hindlimb morphologies that compare most
closely to extant cursorial tetrapods (Dececchi & Larsson, 2011) and a multivariate analysis of limb element lengths recovered the earliest birds as most similar to extant terrestrial foragers (Bell & Chiappe, 2011;Mitchell & Makovicky, 2014). The only theropod taxa that may diverge from this are Scansoriopterygidae, a clade known from four small,
fragmentary specimens, but presenting intriguing and radically divergent morphologies from other maniraptoran theropods. Notably, when preserved, they possess large pedal and manual phalangeal indices, a reduced crural index, a reduced hindlimb length, and reduced limb integument not seen in avian antecedents, including paravians (Glen &
Bennett, 2007;Bell & Chiappe, 2011;Dececchi & Larsson, 2011;Dececchi, Larsson & Hone,
2012). One scansoriopterygid may even possess a skin patagium that may have functioned as an airfoil (Xu et al., 2015). These putative gliding structures are extremely divergent from other theropods and likely represent a convergent pathway to becoming volant.
Of all the models for the origin of the flight stroke from a terrestrial life history two major categories exist: those that have locomotory functional aspect are flap running
(Burgers & Chiappe, 1999), wing assisted incline running or WAIR (Dial, 2003), and
non-locomotory behaviors, such as balancing during prey capture (Fowler et al., 2011) and braking during high-speed turns (Schaller, 2008). The three stringent locomotory behaviours (WAIR, flap running and vertical leaping) are variations on a proto-flight stroke assisting in force generation to increase ground and launch velocities (Burgers &
Chiappe, 1999) or to assist in ascending steep inclines to facilitate escape to elevated
refuges such as into trees or up inclined rock faces (Dial, 2003). All three are present throughout much of extant bird diversity and have been areas of research into the possible pathways for the origins of powered flight.
WAIR is a behaviour observed primarily as a means of predator escape, especially in pre-flight capable juveniles (Tobalske & Dial, 2007;Dial, Jackson & Segre, 2008;Jackson,
Segre & Dial, 2009;Heers & Dial, 2012;Heers, Dial & Tobalske, 2014). This has been
suggested to provide a series of functional and morphological stages using immature age classes of extant individuals as proxies for transitional evolutionary stages from basal coelurosaurs to volant birds (Dial, Randall & Dial, 2006;Heers & Dial, 2012). This has been most thoroughly studied in the Chukar partridge (Alectornis chukar, hereafter referred to as Chukars), though work has been done in other extant birds such as the Brush Turkey (Alectura lathami) and Peafowl (Pavo cristatus) (Heers & Dial, 2015). At the earliest juvenile stages Chukars (0–5 days post hatching [dph] and < 20 g) either crawl or asymmetrically flap their wings to produce forces of approximately 6–10% of their body weight (Jackson, Segre & Dial, 2009;Heers, Tobalske & Dial, 2011;Heers, Dial &
Tobalske, 2014) to ascend inclines of less than 65, slightly greater than the level that
they can ascend using their legs alone (55–60) (Bundle & Dial, 2003;Dial, Randall &
Dial, 2006). At these low angles, the primary locomotory forces are generated from the
hindlimbs but this changes when higher angles are attempted (Bundle & Dial, 2003). To ascend to sub vertical angles, juvenile and older individuals must produce forces equaling a minimum of 50% of their body weight (Dial & Jackson, 2011). Larger birds with masses greater than 0.8 kg such as adult Brush Turkeys or Peafowl struggle to WAIR at this level (Dial & Jackson, 2011;Heers & Dial, 2015). Low angle WAIR has been hypothesized to be present throughout Coelurosauria and sub vertical WAIR minimally at Paraves (Dial, 2003;Heers & Dial, 2012;Heers, Dial & Tobalske, 2014).
Vertical leaping (both from the ground and perches) begins as an effectively ballistic process in flying animals, initiated by the hindlimbs in birds (Heppner & Anderson, 1985;
Bonser & Rayner, 1996;Earls, 2000;Tobalske, Altshuler & Powers, 2004), bats (Schutt et al.,
1997;Gardiner & Nudds, 2011), and insects (Nachtigall & Wilson, 1967;Nachtigall, 1968;
Nachtigall, 1978;Schouest, Anderson & Miller, 1986;Trimarchi & Schneiderman, 1995;
Dudley, 2002). Immediately after the ballistic phase is initiated, the wings are engaged for
Caple, Balda & Willis (1983)proposed as a model for the origin of flight in birds, especially in smaller taxa. Flap-running is used in some extant birds, especially semi aquatic species, to accelerate to takeoff speeds whether starting from a water or land launch (though mostly associated with compliant surfaces, e.g. water–seeEarls, 2000).
Here we present biomechanical models to test when and if a flight stroke may have contributed to flap running, WAIR, or leaping takeoff along the phylogenetic lineage from Coelurosauria to birds and if these models coincide with the evolution of pennaceous feathers and musculoskeletal adaptations for flight. Our goal is to take evolutionary narratives about pathways to flight origins and evaluate them using quantitative, mechanical models derived from living birds. Although feathery integument is likely to have been a synapomorphy for all dinosaurs and perhaps even all ornithodirans (Godefroit
et al., 2014but seeBarrett, Evans & Campione, 2015), the evolution of pennaceous
forelimb and hindlimb feathers has been hypothesized to have been driven by selection for locomotion (Burgers & Chiappe, 1999;Xu et al., 2003;Dial, Randall & Dial, 2006;Heers,
Tobalske & Dial, 2011). Thus we set up a testing regime to determine if non-avian
theropods could produce biomechanical values that fit within the realms of those measured in modern animals exhibiting these behaviors, and if is there a decoupling of the timing of the success in these behaviours from the origin of previous proposed flight related traits.
MATERIALS AND METHODS
Due to uncertainty regarding soft tissues in fossil organisms, some variables were treated as constants in the taxa modeled and based on values for extant birds. These include feather material properties, arrangement and muscle power. Using these values provided conservative estimates in the sense that they would yield more capable performances for taxa that may lie near biomechanical thresholds. Wing feather arrangements for some fossils appear to be similar to modern birds (Elz˙anowski, 2002;Xu et al., 2003;
Foth, Tischlinger & Rauhut, 2014) though for some taxa this has been disputed (Xu,
Zheng & You, 2010;Longrich et al., 2012).
A greater source of uncertainty and debate is fraction of forelimb muscle mass that is due to the M. pectoralis and its potential power output. Extant birds have extremely large wing muscles, as a proportion to their bodyweight (Marden, 1987). The mass of M. pectoralis for birds’ ranges between 10–20% of total body mass (Greenewalt, 1975;
Askew, Marsh & Ellington, 2001), and total flight muscle fractions for birds can reach 40%
(Hartman, 1961;Greenewalt, 1962). This is significantly larger than that estimated in
we assigned are similar to estimates of pectoral region mass inMicroraptorand Archaeopteryx, though those estimates are based on the entire pectoral region tissues (except feathers) and thus the relative mass of the pectoral musculature is likely smaller.
Yet power and muscle mass may not be the main determinant for the use of wings as locomotory structures. Jackson, Tobalske & Dial (2011)estimated that pigeons, with approximately 20% of their body mass as pectoralis muscles, only used approximately 10% of their mass-specific power for low angle WAIR. Further, it has been suggested that power output itself may not determine flight ability, but lift to power ratio (Marden, 1987). For this analysis we have assumed extant bird power productions and metabolic capacities for short “burst” activities for non-avian theropods and early birds. Although paravian metabolism was not at the levels seen in extant birds, it was sufficient to perform short burst activities (Erickson et al., 2009). Regardless, as our methodology uses wing-beat frequency in conjunction with body size and wing arc measures to generate a lift production value, we are not dependent on either theory (power or lift force) to produce meaningful results.
Taxonomic sampling
Forty-five specimens representing twenty-four non-avian theropod taxa and five avian taxa were examined. Non-avian theropod specimens ranged in mass from approximately 60 g to 18 kg (Tables 1andS1). Of these, twenty-eight are from specimens accounting for twelve non-avian theropod taxa with preserved feather material, the rest are from closely related taxa that are inferred to be feathered and were included to broaden the scope of the maniraptorans represented. We a priori excluded the tyrannosauridsYutyrannus, because of its large size (estimated mass ∼1,400 kg), andDilong, due to its incompletely
preserved forelimb. Multiple individuals were included forAnchiornis,Similicaudipteryx, Caudipteryx,Microraptor,Sinosauropteryx,Mei,Archaeopteryx,Jeholornis, andSapeornisto represent different size classes and ontogenetic stages as different stages in ontogeny may have different life history strategies (Parsons & Parsons, 2015). To address the possibility of WAIR in juvenile but not adult members of Pennaraptora, three late stage embryos: MOR 246-1Troodon formosus perVarricchio, Horner & Jackson (2002), MPC-D100/971.
Citipati osmolskeaand MPC-D100/1018Oviraptor incertae sedisperLu¨ et al. (2013)
were included in this analysis. These specimens are incomplete, but forelimb lengths could be estimated based on the fact that the humerus/forelimb ratio in non-avian and basal avian theropods does not change significantly across ontogeny (Table S2). We used the value of∼43% MOR 246-1 based on the ratios seen in other Troodontids (range between
39–45%) based onMei,Jinfengopteryx,Anchiornis,Aurornis,Sinovenator,Sinornithoides andXiaotingia. For MPC-D100/971 and MPC-D100/1018 we used 41% based onCitipati. For all late stage embryos we reconstructed wing area as if they possessed wings with pennaceous feathering proportional to that seen in adults. This is likely an overestimation, as hatchling and young juveniles in other non-avian theropods do not show pennaceous development to the extent of adults (Xu et al., 2009,Zelenitsky et al., 2012).
Mass estimations for non-avian theropods were based on values for femur length
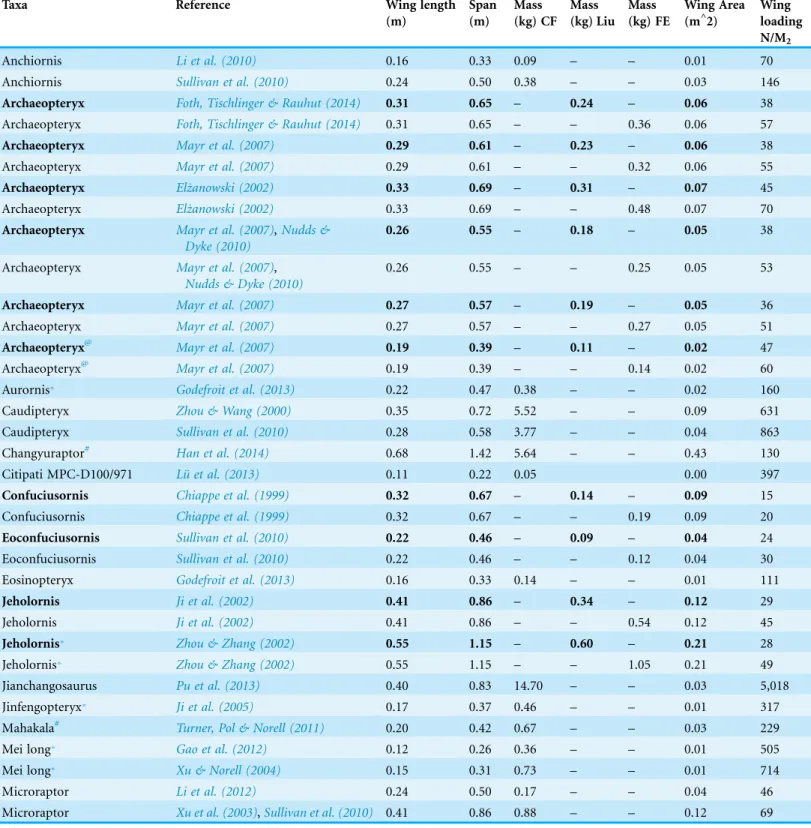
Table 1 Fossil taxa examined in this study.Taxa in bold were specimens without preserved forelimb remegies for whom feather lengths were estimated based on closely related taxa or other members of the same genus. ForJianchangosauruswe based our estimate on the longest preserved body feather traces, this is defensible as this clade is not know to have pennaceous remegies (Foth, Tischlinger & Rauhut, 2014) and in other maniraptorans without remegies the integument on the distal cervicals are similar in size, if not longer, than those on the forelimbs (Currie & Chen, 2001). CF indicates mass estimated based onChristiansen & Farin˜a (2004), Liu indicates avian mass estimates based onLiu, Zhou & Zhang (2012), Fe for avian mass estimates based onField et al. (2013). See text for discussion of body mass calculations and wing beat frequencies.
Taxa Reference Wing length
(m)
Span (m)
Mass (kg) CF
Mass (kg) Liu
Mass (kg) FE
Wing Area (m^2)
Wing loading N/M2
Anchiornis Li et al. (2010) 0.16 0.33 0.09 – – 0.01 70
Anchiornis Sullivan et al. (2010) 0.24 0.50 0.38 – – 0.03 146
Archaeopteryx Foth, Tischlinger & Rauhut (2014) 0.31 0.65 – 0.24 – 0.06 38
Archaeopteryx Foth, Tischlinger & Rauhut (2014) 0.31 0.65 – – 0.36 0.06 57
Archaeopteryx Mayr et al. (2007) 0.29 0.61 – 0.23 – 0.06 38
Archaeopteryx Mayr et al. (2007) 0.29 0.61 – – 0.32 0.06 55
Archaeopteryx Elz˙anowski (2002) 0.33 0.69 – 0.31 – 0.07 45
Archaeopteryx Elz˙anowski (2002) 0.33 0.69 – – 0.48 0.07 70
Archaeopteryx Mayr et al. (2007),Nudds &
Dyke (2010)
0.26 0.55 – 0.18 – 0.05 38
Archaeopteryx Mayr et al. (2007),
Nudds & Dyke (2010)
0.26 0.55 – – 0.25 0.05 53
Archaeopteryx Mayr et al. (2007) 0.27 0.57 – 0.19 – 0.05 36
Archaeopteryx Mayr et al. (2007) 0.27 0.57 – – 0.27 0.05 51
Archaeopteryx@ Mayr et al. (2007) 0.19 0.39 – 0.11 – 0.02 47
Archaeopteryx@ Mayr et al. (2007) 0.19 0.39 – – 0.14 0.02 60
Aurornis* Godefroit et al. (2013) 0.22 0.47 0.38 – – 0.02 160
Caudipteryx Zhou & Wang (2000) 0.35 0.72 5.52 – – 0.09 631
Caudipteryx Sullivan et al. (2010) 0.28 0.58 3.77 – – 0.04 863
Changyuraptor# Han et al. (2014) 0.68 1.42 5.64 – – 0.43 130
Citipati MPC-D100/971 Lu¨ et al. (2013) 0.11 0.22 0.05 0.00 397
Confuciusornis Chiappe et al. (1999) 0.32 0.67 – 0.14 – 0.09 15
Confuciusornis Chiappe et al. (1999) 0.32 0.67 – – 0.19 0.09 20
Eoconfuciusornis Sullivan et al. (2010) 0.22 0.46 – 0.09 – 0.04 24
Eoconfuciusornis Sullivan et al. (2010) 0.22 0.46 – – 0.12 0.04 30
Eosinopteryx Godefroit et al. (2013) 0.16 0.33 0.14 – – 0.01 111
Jeholornis Ji et al. (2002) 0.41 0.86 – 0.34 – 0.12 29
Jeholornis Ji et al. (2002) 0.41 0.86 – – 0.54 0.12 45
Jeholornis* Zhou & Zhang (2002) 0.55 1.15 – 0.60 – 0.21 28
Jeholornis* Zhou & Zhang (2002) 0.55 1.15 – – 1.05 0.21 49
Jianchangosaurus Pu et al. (2013) 0.40 0.83 14.70 – – 0.03 5,018
Jinfengopteryx* Ji et al. (2005) 0.17 0.37 0.46 – – 0.01 317
Mahakala# Turner, Pol & Norell (2011) 0.20 0.42 0.67 – – 0.03 229
Mei long* Gao et al. (2012) 0.12 0.26 0.36 – – 0.01 505
Mei long* Xu & Norell (2004) 0.15 0.31 0.73 – – 0.01 714
Microraptor Li et al. (2012) 0.24 0.50 0.17 – – 0.04 46
hindlimbs, for whom upper and lower mass estimate boundaries were taken from
Dececchi, Larsson & Hone (2012). As non-avian and avian theropods show significant
difference in hindlimb scaling (Dececchi & Larsson, 2013), this method could not be applied to the avian theropods in our dataset. For birds, two mass estimates were generated from the regressions derived from humerus length equations of extant birds
(Liu, Zhou & Zhang, 2012;Field et al., 2013), this element was selected as it showed high
correlation values in both source datasets and were easily computable for all specimens. Nodal values were calculated based on a modified version of the phylogeny inDececchi &
Larsson (2013)(Data S1).
Table 1 (continued ).
Taxa Reference Wing length
(m) Span (m) Mass (kg) CF Mass (kg) Liu Mass (kg) FE Wing Area (m^2)
Wing loading N/M2
Microraptor hanqingi# Gong et al. (2012) 0.47 0.98 2.05 – – 0.18 110
Oviraptor incertae sedis MPC-D100/1018
Lu¨ et al. (2013) 0.09 0.19 0.03 0.00 305
Protarchaeopteryx Ji & Ji (1997) 0.26 0.54 2.58 – – 0.02 1,445
Sapeornis Pu et al. (2013) 0.44 0.92 – 0.51 – 0.12 43
Sapeornis Pu et al. (2013) 0.44 0.92 – – 0.88 0.12 74
Sapeornis* Zhou & Zhang (2003a)and
Zhou & Zhang (2003b)
0.57 1.21 – 0.80 – 0.20 40
Sapeornis* Zhou & Zhang (2003a)and
Zhou & Zhang (2003b)
0.57 1.21 – – 1.49 0.20 74
Similicaudipteryx Xu et al. (2009),
Dececchi & Larsson (2013)
0.40 0.84 4.23 – – 0.12 345
Similicaudipteryx Xu et al. (2009),
Dececchi & Larsson (2013)
0.07 0.15 0.06 – – 0.00 372
Sinocalliopteryx Sullivan et al. (2010) 0.37 0.77 18.43 – – 0.05 3,596
Sinornithoides Russell & Dong (1993) 0.31 0.77 18.4 – – 0.04 1,151
Sinornithosaurus Ji et al. (2001) 0.26 0.54 1.94 – – 0.02 1,032
Sinornithosaurus Sullivan et al. (2010) 0.19 0.41 0.29 – – 0.01 229
Sinosauropteryx Currie & Chen (2001) 0.10 0.20 0.88 – – 0.00 4,755
Sinosauropteryx Currie & Chen (2001) 0.05 0.09 0.19 – – 0.00 11,910
Sinovenator* Benson & Choiniere (2013) 0.24 0.50 2.44 – – 0.03 919
Tianyuraptor Chan, Dyke & Benton (2013),
Dececchi & Larsson (2013)
0.39 0.82 13.36 – – 0.06 2,272
Troodon Embryo MOR 246-1 Varricchio, Horner & Jackson (2002) 0.08 0.16 0.05 0.00 214
Xiaotingia* Xu et al. (2011) 0.24 0.50 0.82 – – 0.03 305
Yixianosaurus Dececchi, Larsson & Hone (2012) 0.29 0.61 1.30 – – 0.04 323
Yixianosaurus Dececchi, Larsson & Hone (2012) 0.29 0.61 1.89 – – 0.04 470
Yulong%$ Lu¨ et al. (2013) 0.18 0.38 0.50 – – 0.02 280
Zhenyuanlong Lu¨ & Brusatte (2015) 0.58 1.22 11.99 – – 0.23 515
Notes:
@Based on otherArchaeopteryxspecimens. #Denotes estimates based onMicroraptor gui.
*Based onAnchiornis.
Wing dimensions
Wing length was calculated based on the length of the humerus, ulna, metacarpal II, and the longest primary feather length, arranged in a straight line. Metacarpal length was used instead of total manus length as the longest primaries attach to the metacarpals and distal forelimb in paravians (Savile, 1957;Elz˙anowski, 2002;Xu, Ma & Hu, 2010;
Foth, Tischlinger & Rauhut, 2014). This gives values similar to those previously reported
for maximal straight-line length of the wing inArchaeopteryx, differing by less than
1% (Yalden, 1971). Wing area was estimated using a chord value 65% of maximum
primary length based on the differences between the longest primary feather and the shortest, distal primary inArchaeopteryx(Elz˙anowski, 2002;Foth, Tischlinger & Rauhut, 2014) andCaudipteryx (Qiang et al., 1998). This estimate produces a greater wing area, by 15%, than what was calculated byYalden (1971) for the Berlin specimen of
Archaeopteryx and produces similar overestimations for other paravian taxa with published wing areas such as Microraptor (+38% compared toChatterjee & Templin
(2007)estimate and +9% over that of Alexander et al. (2010)andZhenyuanlong
(5% greater than calculated byLu¨ & Brusatte (2015)). Therefore, we treat our values as upper bound estimates of maximum wing area as they are also overestimates of functional wing area since they ignore the natural flexed position that the limbs take during locomotion. We used this value for our primary analysis as it gives highest possible values for all our force production data and thus the maximum likelihood of success in achieving the minimum threshold values indicating the possible presence of a behavior in said taxon. For taxa without primary feathers preserved (Table 1), we estimated their length based on either other members of the same genus or closely related taxa and assuming congruent lengths. We estimated body width using furcular widths (Table S3) this represents an addition of between 10–15% to the value of the non-avian theropod skeletal arm span. In extant bird wings feathers add another 40 + % to skeletal arm length (Nudds, Dyke & Rayner, 2007) and proportionally more in many non-avian theropods (Table 1). Wingspan was set 2.1 times wing length (feather lengths included) to assure we did not underestimate the potential wingspan and the influence of the body on wing area in non-avian taxa.
Model construction
To test WAIR, flap running, and vertical leaping we used equations based on those of
Burgers & Chiappe (1999)and on extant bird flight work inPennycuick (2008)to estimate
force production in a similar context to what is examined here.
bw¼0:5ClpðfAmpþUÞ2S=9:8M
results. To test the accuracy of our model, we compared our body weight support results to published data for Chukar partridges during WAIR across the three ontogenetic stages, Pigeon data during WAIR, and birds during takeoff (Table 2). Our values are within the range seen in published data for all three stages of WAIR development and show values greater than 1.0 for all birds undertaking leaping takeoff. As our simple model accurately matches real world experimentally derived values of extant taxa, we believe it a suitable starting point to derive comparative force production data for fossil avian and non-avian theropods.
Creation of benchmarks
As WAIR ability is not uniform across ontogeny and seems to be linked to force production (Jackson, Segre & Dial, 2009), we created two-benchmarks of proportion of body mass supported for taxa to reach. Values between 0.06–0.49 body weight (bw) are classified as level 1 WAIR, which corresponds to the earliest stages of ontogeny and sub vertical ascents (late stage I and early stage II perJackson, Segre & Dial, 2009) with greater than 50% contribution to external vertical work generated by the hindlimbs (Bundle &
Dial, 2003). 0.5 bw and greater denote level 2 WAIR, equivalent to more mature Stage II
and III individuals (perJackson, Segre & Dial, 2009) which are capable of high angle to vertical ascents and whose forelimbs become more prominent in force production
(Bundle & Dial, 2003). Although we understand the transition between stages during
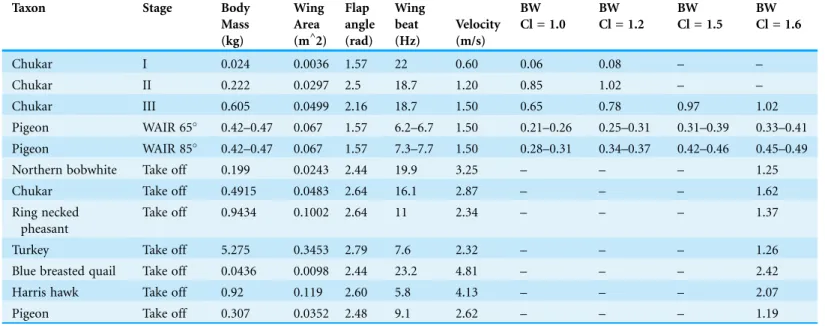
WAIR is semi-artificial, we wished to create a classification scheme that corresponds to the different levels of WAIR capabilities seen in extant systems (Jackson, Segre & Dial, 2009). The selection of 0.06 bw for achieving stage I was chosen to represent real world recorded Table 2 Results of equations for calculating forces produced during WAIR and takeoff using data from extant avians.For Chukars body mass, wing area and body velocity are based onTobalske & Dial (2007), Flapping frequency and angle are based onJackson, Segre & Dial (2009). Coefficient of lift values (Cl) based onHeers, Tobalske & Dial (2011). For pigeons WAIR all data based onJackson, Tobalske & Dial (2011)except for wing area, which is taken from pigeonsCrandell & Tobalske (2011)from pigeons with similar mass and wing length. For avian takeoff values are based onTobalske & Dial (2000)andAskew, Marsh & Ellington (2001).
Taxon Stage Body
Mass (kg)
Wing Area (m^2)
Flap angle (rad)
Wing beat (Hz)
Velocity (m/s)
BW BW BW BW
Cl = 1.0 Cl = 1.2 Cl = 1.5 Cl = 1.6
Chukar I 0.024 0.0036 1.57 22 0.60 0.06 0.08 – –
Chukar II 0.222 0.0297 2.5 18.7 1.20 0.85 1.02 – –
Chukar III 0.605 0.0499 2.16 18.7 1.50 0.65 0.78 0.97 1.02
Pigeon WAIR 65 0.42–0.47 0.067 1.57 6.2–6.7 1.50 0.21–0.26 0.25–0.31 0.31–0.39 0.33–0.41 Pigeon WAIR 85 0.42–0.47 0.067 1.57 7.3–7.7 1.50 0.28–0.31 0.34–0.37 0.42–0.46 0.45–0.49
Northern bobwhite Take off 0.199 0.0243 2.44 19.9 3.25 – – – 1.25
Chukar Take off 0.4915 0.0483 2.64 16.1 2.87 – – – 1.62
Ring necked pheasant
Take off 0.9434 0.1002 2.64 11 2.34 – – – 1.37
Turkey Take off 5.275 0.3453 2.79 7.6 2.32 – – – 1.26
Blue breasted quail Take off 0.0436 0.0098 2.44 23.2 4.81 – – – 2.42
Harris hawk Take off 0.92 0.119 2.60 5.8 4.13 – – – 2.07
minima for this behavior and thus should be considered minimal levels achieved before reconstructions of WAIR are accepted.
Coefficient of lift (Specific lift)
We examined potential performance during the wing-driven phase of flap-running, WAIR, and leaping takeoff in our analyses. As a result, all three of the behaviors are subject to constraints of lift production efficiency. The production of lift relative to planform area, speed, and fluid density is summarized as the coefficient of lift.
During WAIR analysis, a coefficient of lift (CL) of 1.0 was used. This corresponds to a value estimated during WAIR use in juvenile Chukars at early stage II (10 dph) (Heers,
Dial & Tobalske, 2014) but greater than that in the earlier ontogenetic stages (Heers,
Tobalske & Dial, 2011). We selected this value as this age class has been proposed to be
analogous to derived maniraptoran theropod capabilities such as Anchiornisand Microraptor and this Cl is achievable by all ontogenetic stages beyond 5 dph depending on the angle of attack (Heers, Dial & Tobalske, 2014). For leaping takeoff we used a Cl of 1.5, which corresponds to the minimal values estimated in adult Chukars during high angle WAIR (Heers, Tobalske & Dial, 2011) and below the 1.64 calculated for the pigeon during takeoff (Usherwood, 2009). For flap running, we used the equations ofBurgers &
Chiappe (1999) with the following modifications: we ran permutations for all three
downstroke (50, 70 and 90) angles not just 50as per the original analysis and reduced the Cl to 1.2 from 2. We choose to make the Cl closer to that estimated during late stage Chukar WAIR attempts (Heers, Tobalske & Dial, 2011) as WAIR is simply a specific use case of flap running on a highly angled substrate. This value is achievable by Chukars older than 20 dph (Heers, Dial & Tobalske, 2014). Using the Cl of non-volant and juvenile Chukar both produces reasonable minimum values for these behaviours and more closely simulates the expected outputs in non-avian theropods before powered flight.
During low advance ratio wing-driven behaviors (launch, landing, WAIR, etc.), the coefficient of drag can be quite large. In young Chukars, the coefficient of drag can be near the coefficient of lift, thereby potentially providing a significant component of weight support during controlled descent or significantly affecting reaction forces during WAIR
(Heers, Tobalske & Dial, 2011). To confirm that using pure Cl as our specific fluid force
coefficient was an accurate approach (instead of the total fluid resultant with both Cl and Cd), we compared predicted reaction forces and weight support to values measured in vivo and reported in the literature (Tobalske & Dial, 2007;Heers, Dial & Tobalske, 2014). Because a close match was found across multiple size classes, we assume for the remainder of the calculations that reaction forces during WAIR are not greatly affected by a high coefficient of drag (though we note that for controlled descent or burst climb out, behaviors we did not investigate, high Cd is likely a critical component).
Wing beat frequency
Wing beat frequencies scale negatively to body mass in steady flight (Greenewalt, 1975;
Pennycuick, 2008) and takeoff (Askew, Marsh & Ellington, 2001;Jackson, 2009) across
WAIR (Tobalske & Dial, 2007). For this study we used the maximum takeoff wingbeat frequency regressions fromJackson (2009)for all birds in his sample (see allSupplemental Tables), and for only ground foraging birds (GF), we also added Galliformes takeoff data fromAskew, Marsh & Ellington (2001)to Jackson’s dataset to produce a third regression equation (MOD). For the MOD dataset we incorporated a phylogenetic correction using PDAP v 1.15 (Midford, Garland & Maddison, 2010), with branch lengths based on divergence times derived from the chronograms ofJetz et al. (2012)(Data S2).
Wing range of motion
Abduction of the forelimb beyond the horizontal plane that transects the vertebral column was not possible in most non-avian theropods resulting in a maximum stroke angle for forelimb motion to be less than 90(Senter, 2006a;Senter, 2006b;Turner, Makovicky &
Norell, 2012). The glenoid fossa faces ventrolaterally in these taxa and only shifted to a
more lateral configuration at Paraves (Makovicky & Zanno, 2011;Turner, Makovicky &
Norell, 2012). The glenoid continued to translate upward until reaching the dorsolaterally
facing position of most extant birds at the phylogenetic level ofJeholornisandSapeornis
(Zhou & Zhang, 2003a;Zhou & Zhang, 2003b).
Extant birds have extensive shoulder abductive ranges. For example, during WAIR, the abductive flap angle of juvenile Chukars ranges from 90at stage I to greater than 143at stage II (Jackson, Segre & Dial, 2009). Images show that in all cases, the forelimb ascends to a vertical or slightly beyond position (see Tobalske & Dial, 2007,Figs. 4 and 6;Jackson,
Segre & Dial, 2009,Fig. 1;Heers, Dial & Tobalske, 2014,Fig. 1).
Given the abduction limitations of the non-avian theropod glenoid, we chose flap angles of 50, 70 and 90to encapsulate the range of values expected across Theropoda and ran them for all taxa. An angle of 90is likely unattainable for all non-avian theropods due to the constraints of reducing contact with the substrate on the latter part of the downstroke and shoulder morphology since the humerus cannot exceed the dorsal rim of the glenoid which is aligned with the vertebral axis (or vertebral frame of reference per
Dial, Jackson & Segre, 2008). It was included to create an upper bracket on possible
support values.
extant tetrapods (Biewener, 2003). Our pre-loading scalar accounts for the fact that animals gain significant power amplification from the release of stored elastic energy in their limbs. Even in non-specialist jumpers this amplification can be greater than twice the maximum mass specific power derived from the muscles and in specialist can be 10higher or more (Henery, Ellerby & Marsh, 2005and references therein). For leaping takeoff, our starting inputs were two different takeoff speeds recorded in on extant avians (Earls, 2000;Tobalske & Dial, 2000;Askew, Marsh & Ellington, 2001). Higher values for leaping have been recorded in some mammals (Gu¨nther et al., 1991) and after several wing beats in birds (Askew, Marsh & Ellington, 2001;Berg & Biewener, 2010), thus these values may not represent the maximal possible values for small theropods. For flap running the assigned start value was 2 m/s, which is the same starting velocity used inBurgers & Chiappe (1999). This speed is well within the range of sprint speeds of many lizards (Huey, 1982; Christian & Garland, 1996;Irschick & Jayne, 1999) and small mammals (Iriarte-Dı´az, 2002), whereas many terrestrial birds can sustain this speed for over thirty minutes (Gatesy & Biewener, 1991;Gatesy, 1999). These values are likely well below the maximum sprint speed of these taxa (Sellers & Manning, 2007) but allowed us to determine if there was significant increase in speed using the wing generated thrust alone.
We excluded the potential drag and damage caused by hindlimb feathers of some paravians through contact with the substrate. At low hindlimb angles used during the ascent of inclined surfaces (see the metatarsus during WAIR inFig. 1fromJackson, Segre &
Dial, 2009) the distal limb feathers would have contacted the surface and caused frictional
drag, which would have reduced performance and damaged the feathers (Dececchi &
Larsson, 2011). Although these variables may have evolved throughout the transition from
theropods into early birds, treating them as constants provided a “best case scenario” for non-avian theropods constraining the upper limits for when these behaviours were possible.
Wing contribution to leaping
angle of takeoff measured in human and lizard leapers (Toro, Herrel & Irschick, 2004;
Linthorne, Guzman & Bridgett, 2005; Wakai & Linthorne, 2005). In both cases our
models were treated as if there was no difference in takeoff and landing height, thus making the calculation of jump distance
Djump¼ v2sin 2
=g
Where v equals the takeoff velocity andΘthe angle of takeoff.
Vertical take offs were deemed possible when body weight (bw) support values were equal to or greater than 1.0 using the speed and lift parameters mentioned above.
Jinfengopteryx Microraptor
Anchiornis Archaeopteryx
Similicaudipteryx
Sinosauropteryx Sinocalliopteryx Protoar
c
haeopteryx
Jianchangosaurus Yu Caudipteryx Eosinopteryx Xiaotingia
long
Mei
Aurornis Sinoventor Mahakala Sinornithosaurus Changyuraptor Tianyuraptor Jeholornis Sapeornis Eoconfuciusornis Confuciusornis
Ty
rannosaur
o
idae
Zulong Bicenternaria Tu Compsogntahidae
gulusaurus
Alvar
ezsaur
oidae
Or
nithomimosauria
Ornitholestes Therizinosaur Beipiaosaurus
o
idae
Falcarius oviraptorid embryos Caegnathidae Avimimus troodontid embryo Dr
omaeosauria
Unenlagiinae Or
nithur
omorpha
Enantior
nithes
Maniraptoriformes Maniraptora
Pennaraptora
Paraves
Aves
Coelurosauria
log (wing loading) (N/m^2)
1 2 3 4
fledged 10 dph Chuckar WAIRing 3 dph Chuckar
WAIRing juvenile Brush turkey
RESULTS
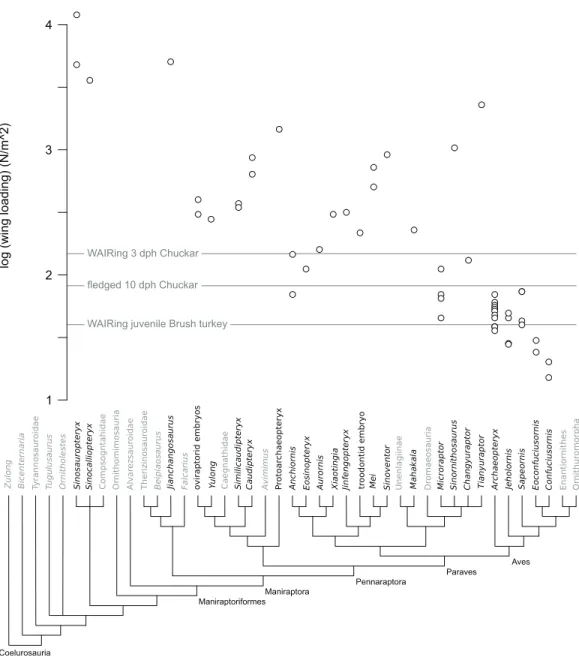
Wing loading
Increase in WAIR ability broadly corresponds to decreased wing loading in Chukars
(Heers & Dial, 2015), something noted in other galliform birds (Dial & Jackson, 2011).
Thus wing loading values may offer a rough comparison between non-avian theropod specimens and Chukars of a similar body mass. Among non-avian theropods, wing loading values ranged from 46 N/m2(Microraptor) to over 11,000 N/m2
(Sinosauropteryx). Of the thirty-four non-avian specimens included, only eight, representing five genera (all are deinonychosaurs) showed loading values less than that seen in 1-day-old Chukars (170 N/m2), the highest values recorded across ontogeny. 1-day-old Chukar chicks do not WAIR, can only surmount inclines of less than 48still performed asynchronous wing beats and their wings make prolonged contacts with the substrate in a crawling fashion (Jackson, Segre & Dial, 2009;Heers & Dial, 2015). No non-paravian showed values less than the 160 N/m2measured at 3 dph Chukars, with most pennaraptorans at values 2–8 times that seen at even the highest Chukar chick loadings (Table 1;Fig. 1). Focusing on the embryonic and early ontogenetic stage specimens in our analysis, to test whether WAIR was possible at early ages and lost through ontogeny, we recovered loading values again significantly higher than the highest values seen during Chukar ontogeny, with values 126–234% those of 1-day-old chicks which were also significantly smaller. For comparison, the hatchling sizeSimilicaudipteryx specimen (STM 4-1) had a body mass estimated at approximately 63 g, similar to a 17 dph Chukar chick (stage II), but wing loading values of 372 N/m2, 5.8 times higher than seen in the 17 dph chick and over twice that seen in 3 dph Chukars due toSimilicaudipteryx having a wing area only the size of a 6 dph chick which weight approximately 16 g. This suggests that none of the non-paravian theropods could perform the lowest levels of WAIR, even disregarding their limited range of motion and flapping frequency compared to juvenile extant avians. None of the Mesozoic avian taxa, under either mass
reconstruction, showed loading values above 74 N/m2, which corresponds to
approximately 11 dph (stage II) Chukar chicks, which is approximately the time where fledgling begins (Harper, Harry & Bailey, 1958;Christensen, 1996).
WAIR
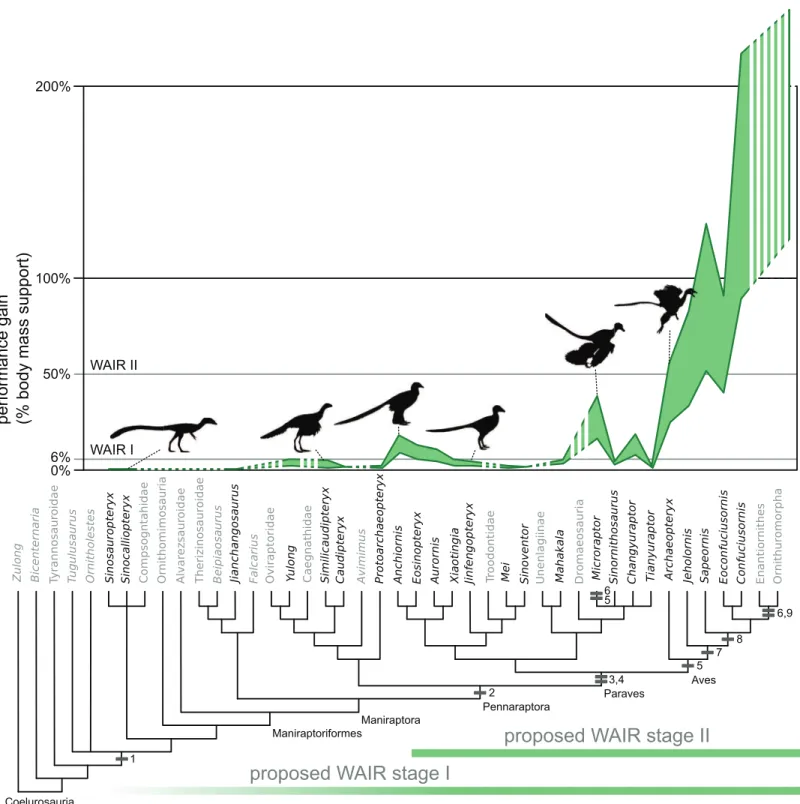
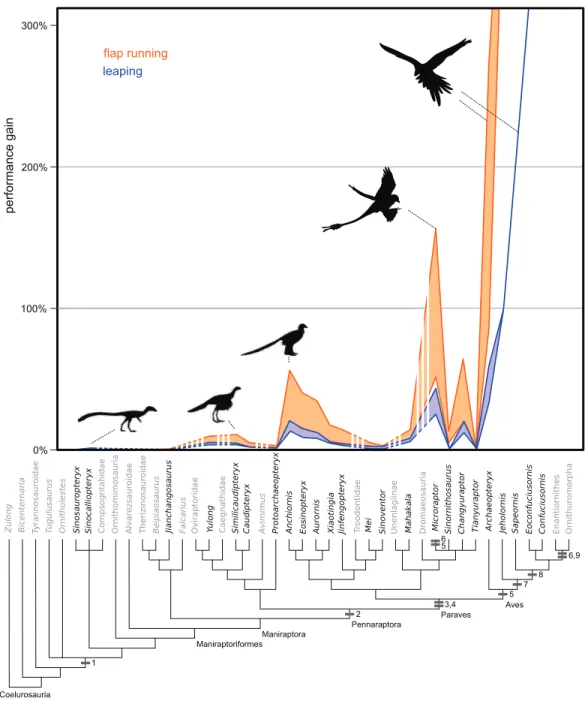
At a CoM velocity of 1.5 m/s nine of thirty-four specimens of non-avian theropods reached the minimal benchmark for level 1 WAIR (0.06 bw) under at least one of the three flapping speed and flap angle permutations (Fig. 2;Tables 3andS4–S6). When the velocity was decreased to 0.6 m/s number that succeed decreased to eight as the
Figure 2 Evolution of WAIR performance.Estimated evolutionary ranges of WAIR stages I and II (Dial, 2003;Heers & Dial, 2012;Heers, Dial &
Tobalske, 2014) are mapped over a phylogeny of selected Maniraptoriformes. Upper lines are for 90flap angles and lower lines for 50flap angles.
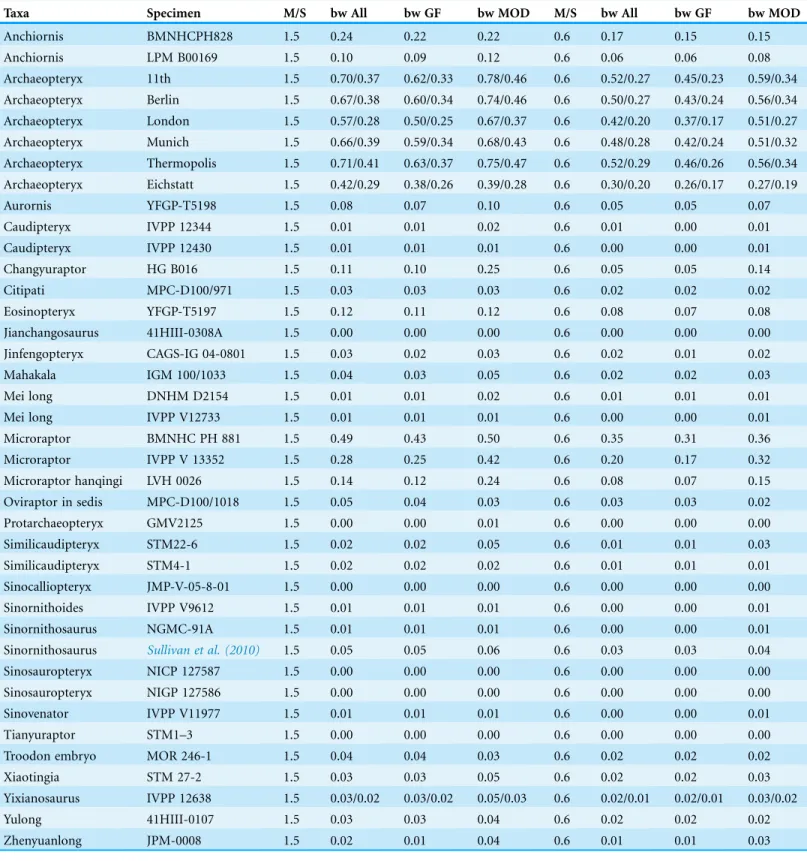
Table 3 Table of body wight support values across specimens under 90flap angle.Body weight (bw) support values across non-avian and basal avian taxa under three different flapping frequency estimators (see text for description). Calculations are based on the 90flap angle permutation at two velocity of the centre of mass (0.6 and 1.5 m/s). This correspond to recorded velocity of earliest WAIR capable juveniles (0.6 m/s) and adult (1.5 m/s) Chukars (Tobalske & Dial, 2007).
Taxa Specimen M/S bw All bw GF bw MOD M/S bw All bw GF bw MOD
Anchiornis BMNHCPH828 1.5 0.24 0.22 0.22 0.6 0.17 0.15 0.15
Anchiornis LPM B00169 1.5 0.10 0.09 0.12 0.6 0.06 0.06 0.08
Archaeopteryx 11th 1.5 0.70/0.37 0.62/0.33 0.78/0.46 0.6 0.52/0.27 0.45/0.23 0.59/0.34 Archaeopteryx Berlin 1.5 0.67/0.38 0.60/0.34 0.74/0.46 0.6 0.50/0.27 0.43/0.24 0.56/0.34 Archaeopteryx London 1.5 0.57/0.28 0.50/0.25 0.67/0.37 0.6 0.42/0.20 0.37/0.17 0.51/0.27 Archaeopteryx Munich 1.5 0.66/0.39 0.59/0.34 0.68/0.43 0.6 0.48/0.28 0.42/0.24 0.51/0.32 Archaeopteryx Thermopolis 1.5 0.71/0.41 0.63/0.37 0.75/0.47 0.6 0.52/0.29 0.46/0.26 0.56/0.34
Archaeopteryx Eichstatt 1.5 0.42/0.29 0.38/0.26 0.39/0.28 0.6 0.30/0.20 0.26/0.17 0.27/0.19
Aurornis YFGP-T5198 1.5 0.08 0.07 0.10 0.6 0.05 0.05 0.07
Caudipteryx IVPP 12344 1.5 0.01 0.01 0.02 0.6 0.01 0.00 0.01
Caudipteryx IVPP 12430 1.5 0.01 0.01 0.01 0.6 0.00 0.00 0.01
Changyuraptor HG B016 1.5 0.11 0.10 0.25 0.6 0.05 0.05 0.14
Citipati MPC-D100/971 1.5 0.03 0.03 0.03 0.6 0.02 0.02 0.02
Eosinopteryx YFGP-T5197 1.5 0.12 0.11 0.12 0.6 0.08 0.07 0.08
Jianchangosaurus 41HIII-0308A 1.5 0.00 0.00 0.00 0.6 0.00 0.00 0.00
Jinfengopteryx CAGS-IG 04-0801 1.5 0.03 0.02 0.03 0.6 0.02 0.01 0.02
Mahakala IGM 100/1033 1.5 0.04 0.03 0.05 0.6 0.02 0.02 0.03
Mei long DNHM D2154 1.5 0.01 0.01 0.02 0.6 0.01 0.01 0.01
Mei long IVPP V12733 1.5 0.01 0.01 0.01 0.6 0.00 0.00 0.01
Microraptor BMNHC PH 881 1.5 0.49 0.43 0.50 0.6 0.35 0.31 0.36
Microraptor IVPP V 13352 1.5 0.28 0.25 0.42 0.6 0.20 0.17 0.32
Microraptor hanqingi LVH 0026 1.5 0.14 0.12 0.24 0.6 0.08 0.07 0.15
Oviraptor in sedis MPC-D100/1018 1.5 0.05 0.04 0.03 0.6 0.03 0.03 0.02
Protarchaeopteryx GMV2125 1.5 0.00 0.00 0.01 0.6 0.00 0.00 0.00
Similicaudipteryx STM22-6 1.5 0.02 0.02 0.05 0.6 0.01 0.01 0.03
Similicaudipteryx STM4-1 1.5 0.02 0.02 0.02 0.6 0.01 0.01 0.01
Sinocalliopteryx JMP-V-05-8-01 1.5 0.00 0.00 0.00 0.6 0.00 0.00 0.00
Sinornithoides IVPP V9612 1.5 0.01 0.01 0.01 0.6 0.00 0.00 0.01
Sinornithosaurus NGMC-91A 1.5 0.01 0.01 0.01 0.6 0.00 0.00 0.01
Sinornithosaurus Sullivan et al. (2010) 1.5 0.05 0.05 0.06 0.6 0.03 0.03 0.04
Sinosauropteryx NICP 127587 1.5 0.00 0.00 0.00 0.6 0.00 0.00 0.00
Sinosauropteryx NIGP 127586 1.5 0.00 0.00 0.00 0.6 0.00 0.00 0.00
Sinovenator IVPP V11977 1.5 0.01 0.01 0.01 0.6 0.00 0.00 0.01
Tianyuraptor STM1–3 1.5 0.00 0.00 0.00 0.6 0.00 0.00 0.00
Troodon embryo MOR 246-1 1.5 0.04 0.04 0.03 0.6 0.02 0.02 0.02
Xiaotingia STM 27-2 1.5 0.03 0.03 0.05 0.6 0.02 0.02 0.03
Yixianosaurus IVPP 12638 1.5 0.03/0.02 0.03/0.02 0.05/0.03 0.6 0.02/0.01 0.02/0.01 0.03/0.02
Yulong 41HIII-0107 1.5 0.03 0.03 0.04 0.6 0.02 0.02 0.02
andEosinopteryxyielded bodyweight support values above 0.06 bw across all
permutations at 1.5 m/s whereas at 0.6 m/s only the smaller AnchiornisandMicroraptor guispecimens achieve this. Within non-avian theropods using a 90flap angle at 1.5 m/s, only a single specimen ofMicroraptor gui(BMNHC PH881) has body weight support values reaching the 0.5 bw cutoffs for WAIR level 2, though the larger specimen (IVPP V 13352) comes close under the MOD reconstruction (Tables 3andS4–S6). At 50only the smallerAnchiornis,Changyuraptor,Eosinopteryxand all 3Microraptorspecimens, achieve the 0.06 bw benchmark at 1.5 m/s and this decreases to only the smaller Anchiornisand Microraptor at 0.6 m/s. No non-avians orArchaeopteryxachieved bw support values higher than 0.33 under the 50at 1.5 m/s and onlyMicroraptor gui, Archaeopteryx specimens and the smallerAnchiornisreaching a minimal of 0.1 bw under this permutation.
Among Mesozoic birds, the different mass estimation methods produced significantly different body weight support values and are more prominent in the most basal birds in our analysisSapeornisandJeholornis(Fig. 2;Tables S4–S6). All basal avians show the capability of level 1 WAIR (bw support values of 0.06 or greater) under all flap frequencies estimates, mass estimates or flap angles used here and no avians showing values below 0.1 bw under any permutation. InArchaeopteryx, there is no clear trend in WAIR capability and allometry as all specimens besides the Eichstatt individual show a similar range of body weight support values (Table 3). At the higher flap angle and lower mass, all avians show the capability for level 2 WAIR (> 0.5 bw). All birds more derived than
Archaeopteryxyield a body weight support values in excess of 1.0 bw at their lower mass estimate at 1.5 m/s 90flap angle under all 3 flap frequencies, except forSapeorniswhere
the smaller specimen exceeds 1.0 bw only under the MOD permutation. Of note, the values recovered for more derived avians are significantly higher than those observed in experimental data (Tobalske & Dial, 2007) or calculated using extant measurements (Tables 2andS7) and well above the 1.0 threshold for takeoff. This suggests that these taxa could have performed this behavior at lower wing beat frequencies, body velocities and flap angles than the values used here, as seen in some extant birds (Jackson, Tobalske &
Dial, 2011), or that physiology and power production differed between extant and basal
birds (Erickson et al., 2009;O’Connor & Zhou, 2015), or a combination of both. If the latter is correct, it suggests our measurements for non-avian theropods overestimate the power production potential in these taxa, and thus overestimate their WAIR capabilities.
Flap running
Similicaudipteryx. At flap angles below 90 only the largerSimilicaudipteryxand the lighter mass estimatedYixianosaurusspecimens among non-paravians yielded velocity increases approaching 10%. Although some paravians had high levels of increased speed,
Mahakala, Mei, Jinfengopteryx, Xiaotingia, Tianyuraptor, andSinovenatorshowed increases of less 17% under all permutations, with many showing values in the single digits. At 50onlyMicroraptorsp.,Changyuraptor,EosinopteryxandAnchiornisshowed a greater than 10% increase in running velocity. All specimens ofArchaeopteryxshowed speed increases similar to or greater than those seen inMicroraptorandAnchiornisthough there is no clear pattern relating body size to speed, as the largest (London) and smallest (Eichstatt) specimens yielded similar values (Table S8). OnlyMicroraptor and all specimens ofArchaeopteryxshowed the ability to achieve takeoff velocities by this method alone (Table S8).
Leaping
The use of forelimbs during jumping was divided into three discrete analyses, one examining the potential of the wings to increase maximum jump height, one to examine distance gained horizontally, and finally to see if the wings could generate enough force to take off from a standing start as seen in most extant birds.
Vertical
No non-paravian gained more than 8% additional height with flapping using the highest flap angles, and most gained less than 3% (Fig. 3,Table S9). Using more reasonable flap angles of 50, none exceeded 4%. Within paravians, several taxa generated greater than 10% height increases, including Anchiornis,Microraptor,Eosinopteryx, Changyuraptor,Aurornisand allArchaeopteryx specimens(Table S9). Despite this most troodontids, both the “short armed” Jehol Dromaeosaurs,MahakalaandSinornithosaurus showed values more similar to non-paravians, between 1–8.5% increase in height. Of interest, the “four winged” taxa used here (Anchiornis,Microraptor, andChangyuraptor) yielded increased height gains on the order of 16–64%, withMicroraptor guispecimens showing values in excess of 50% (Fig. 3,Table S9). Even under the lowest flap angle settings, both specimens ofM. guishowed leaping height increases of greater than 30%, almost four times the value for the non-paravians under any setting, andChangyuraptor andMicroraptor hanqingishowed values of approximately 20%, which is greater than twice the highest value seen in any non-paravian. All Archaeopteryxspecimens showed height gains greater than 30% under all mass permutations, with the lighter estimates for the Berlin, Thermopolis and 11th specimen exceeding 190% non-flapping height values. Interestingly the only specimen that did not reach the 50% height gain under any permutation is the Eichstatt specimen, the smallest in our analysis, whose range between 34–48% gains is similar to what is seen in the larger microraptorine specimens (excluding Sinornithosaurus).
Horizontal
Similar to vertical leaping, there was a marked disparity between distance gained in the “four winged” paravian taxa and all others (Table S10). Only one non-paravian
smallerAnchiornisand all species ofArchaeopteryxshow leaping values greater than 20% non-flapping horizontal distance at the 45take off, though this drops to 15% at 30.
Vertical takeoff
Among non-avians, onlyMicroraptor guiachieved body weight supports greater than 1 under any flap angle or flapping frequency permutation under the two avian derived take off speeds assessed. No non-paravian showed values greater than 0.15 bw under these conditions (Tables S11–S13). Outside ofMicroraptor, Changyuraptorand the smaller specimen ofAnchiornis, deinonychosaurians did not have values beyond 0.5 bw under either speed or any flap frequency permutation. In avians at the lower body weight estimate, all taxa showed values greater than 1.0 bw at the high end of their flapping angle range. At the higher mass estimates, multiple specimens ofArchaeopteryxshowed levels below 1.0 bw, with the lowest values seen in the Eichstatt and London specimens (Tables S11–S13). Many extant avians use launch speeds between 1.5 m/s and 3.8 m/s
(Earls, 2000;Berg & Biewener, 2010;Heers, Dial & Tobalske, 2014). At these takeoff speeds
avians more derived than Archaeopteryxachieved values in excess of 1.0 bw, with the exception of the larger mass estimates ofSapeornisunder the ALL and GF flapping estimates (Tables S4–S6andS11–S13). At the higher speed of 5.1 m/s, achievable by strong leapers, beyondMicroraptor the only other non-avian theropods to achieve greater than 1.0 bw support was the smaller specimen ofAnchiornisunder a single flap rate permutation at 90flap angle.
DISCUSSION
over estimations for values obtainable in most if not all the taxa sampled here. Our use of a velocity of 1.5 m/s is based on the speed of adult Chukars, whose WAIR ability is much greater than proposed of any non-avian taxa examined here. Using juvenile values (0.6 m/s of stage I) reduces the bw support values by approximately one third. Additionally, by using coefficient of lift values of 1, which is higher than is seen in a 20 dph Chukar at 45angle of attack (stage II perJackson, Segre & Dial, 2009), we are likely highly positively biasing the results. Thus, we argue that due to our relaxed constraints and the significantly higher wing loadings to that seen in any stage of Chukar development (even the asymmetrical crawling stage of 1–3 dph fromJackson, Segre & Dial, 2009), the taxa sampled here that did not reach the 0.06 bw threshold derived from in vivo experiments or meet the wing loading values seen in the earliest stages of ontogeny should not be considered WAIR capable. Although we do not have in vivo derived values to compare with leaping and flap running estimates, it is not parsimonious to propose that small incremental increases measured only under unnaturally lenient conditions support a behavior.
For all behaviours tested here there is a sharp contrast in performance levels between a small number of paravian taxa (Microraptor, Anchiornis, Changyuraptor, Aurornis and Eosinopteryx) and all other non-avian taxa. This discrepancy is marked not only because it does not correlate to the origin of pennaceous feathers at pennaraptora but it also does not include all members of Paraves within the high performing category. Multiple small bodied and basal members of both deinonychosaurian subgroups, such asMahakala, Xiaotingia, Jinfengopteryx, Mei, Sinovenator and Sinornithosaurus, show little evidence of benefit from flapping assisted locomotion. As these taxa are similar in size to the paravians that do show potential benefits, the argument that this loss is a byproduct of allometry is not possible. Allometric loss of performance is possible though in the larger, feathered dromaeosaurs likeVelociraptor(∼15 kg,Turner et al., 2007) orDakotaraptor(∼350 kg,
Depalma et al., 2015), but our data from embryonic maniraptorans does not support this
postulate. As our measurements for the small paravian wing areas are based either on preserved feather length (Sinornithosaurus) or on long feathered close relatives (Anchiornis forXiaotingia,Jinfengopteryx,Mei,SinovenatorandMicroraptorforMahakala) our values for them are likely overestimates and suggests that locomotion was not a major driver for forelimb evolution, even among small sized paravians.
Flap running
There are questions as to whether a flap running model is particularly efficient for any taxa. One immediate set of constraints relates to performance of the hind limb under a potential flap-running model. The thrust production model we used assumes the hindlimb and forelimb propulsion potentials were simply additive. However, in reality the hindlimb performance must have some maximum output that is likely to be exceeded if the forelimbs produce significant additional propulsive force. Thus, at high wing-produced thrust production, the hindlimbs likely cannot move fast enough to
We also assume that most of the lift produced by the wings during flap-running could be oriented as thrust. The proportion of force that can be oriented as thrust is, however, constrained by wing kinematics, particularly the amount of spanwise twist that the wing can undergo during the flight stroke (Iosilevskii, 2014). Thus, our thrust proportions for theropods may be unrealistically high, overestimating the speed generated.
Additionally, downstroke lift production not reoriented as thrust would act to displace some weight. Although this is important and necessary in flight, it would reduce hindlimb performance during flap-running by reducing the normal force acting through the feet. A similar phenomena occurs during high angled WAIR (Bundle & Dial, 2003). Finally, the production of lift during flap-running, regardless of orientation relative to travel, would generate significant amounts of drag (including profile drag, pressure drag, and induced drag). Given these potential performance constraints, it is questionable whether flap-running would be as effective a locomotion mode as our data suggests, even for taxa like Microraptor.
WAIR
The finding that not a single non-paravian reaches the 6% bodyweight threshold for level 1 WAIR challenges the proposal that WAIR offers a behavioural pathway for basal maniraptorans (Dial, Randall & Dial, 2006;Heers, Tobalske & Dial, 2011;Heers, Dial &
Tobalske, 2014). The few cases that approach these values (Similicaudipteryx,Yulong, and
Yixianosaurus) are only achieved under wing angle and wing beat permutations that are unrealistic given their pectoral musculoskeletal structures (Baier, Gatesy & Jenkins, 2007;
Turner, Makovicky & Norell, 2012). MOD derived wing beat values in beats per second for
the largerSimilicaudipteryx(6 Hz), Yixianosaurus(7–8 Hz),Yulong(10 Hz) are greater than or equal to those of smaller extant birds such as the Magpie (Pica pica) (9.2 Hz), Crow (Corvus brachyrhynchos) (6.6 Hz) and Raven (Corvus corvax) (6.1 Hz) (Jackson, 2009) and are so elevated due to the inclusion in that dataset of galliform birds, which are short burst specialists with shortened wings, large pectoralis and supracoracoideus muscle masses and muscle fiber adaptations to maximize their flight style (Askew & Marsh, 2001;
Tobalske et al., 2003). These specialized muscles are adapted to allow wing beat frequencies
beyond those of other birds at a similar body mass (Tobalske & Dial, 2000;Tobalske &
Dial, 2007;Jackson, 2009;Jackson, Segre & Dial, 2009) thus inflating our wing beat
frequency estimates. Wing beat frequencies were likely much lower in non-avian theropods than in modern birds during takeoff, which is higher than during level flight
(Dial, 1992;Berg & Biewener, 2010), given the relatively small size of their wing
musculature and plesiomorphic musculoskeletal anatomy (Jasinoski, Russell & Currie,
2006;Allen et al., 2013;Baier, Gatesy & Jenkins, 2007;Bock, 2013;Burch, 2014).
reconstruction for the largerAnchiornis,Aurornis,EosinopteryxorSinornithosaurus and Changyuraptorunder all but the MOD flapping rate estimate (Table 3). This suggests that tightening these constraints either singularly or combination would likely exclude marginally performing taxa from even this threshold. For example, using the body velocity of 6–8 dph Chukars (0.6 m/s) at 70flap angle, excludesAurornis, the larger Anchiornis,Eosinopteryxunder all permutations andChangyuraptorexcept under the MOD flapping frequency.
Given the low values seenAurornisand reduced flapping ability inEosinopteryx
(Godefroit et al., 2013) it is likely that only the juvenileAnchiornisspecimen,Microraptor
andChangyuraptoramong non-avian theropods would even have the potential to use this behavior. When we introduce other factors in addition to those listed above such as the symmetrical feathers or the plesiomorphic pectoral girdle would likely have limited the prevalence of WAIR further, if present at all, to only the microraptorines as they would have further reduce the effectiveness of the wings in force generation. Feather asymmetry aids in resisting out of plane forces and is crucial for their bending and twisting during the flight stroke (Ennos, Hickson & Roberts, 1995;Norberg, 2002). While the pectoral girdle morphology of Anchiorniswhich show non-elongated and convex coracoid and lack of ossified sternum or fused gastralia, denote reduced pectoral muscle mass compared to microraptorines (Zheng et al., 2014). This does not make a strong case that this behavior was present ancestrally in Paravians, yet alone that it coincided with pennaceous feather evolution and elongation (present at Pennaraptora) or other flight related adaptations. Our findings suggest that if present at all, there is a minimum of two origins for the use of flap-based locomotion with the presently accepted phylogenetic hypotheses; once within microraptorines, and once in Aves. This is not completely surprising, as other traits related to flight, such as an alula, elongated coracoid, and a broad, ossified single sternum plate, are also independently derived inMicroraptorand basal avians that are more derived than Sapeornis, suggesting convergent evolution in early powered flight (Zheng et al., 2014).
To compare the results of our body mass and wing area estimates to others in the literature we ran the WAIR and leaping takeoff analyses using previously published mass and wing area values forArchaeopteryx(Yalden, 1984),Microraptor(Chatterjee & Templin,
2007;Alexander et al., 2010),CaudipteryxandProtarchaeopteryx(Nudds & Dyke, 2009). In
all cases, WAIR values were similar, often below, values calculated in our analysis (Table S14). Non-paravians yielded WAIR values near 0 bw and take off speeds were required to be greater than 46 m/s.Microraptorspecimens showed takeoff velocities between 4.1–6.6 m/s, values achievable either by running or leaping methods and similar to those estimated in our original analysis.
Locomotory pathways to flight: necessity or red herring?
to have evolved passively if display or stability flapping methods drove the origin of large wings. Although it is undeniable that extant avians have proportionally and significantly more wing musculature than non-avian theropods, the minimum level needed to achieve a ground-based takeoff is unknown. There are several volant birds with flight muscle ratios (flight muscle mass proportion of total mass) below 16% (Marden, 1987). Juvenile Chukars that fledge less than two weeks after hatching (Harper, Harry & Bailey, 1958;
Christensen, 1970;Christensen, 1996) and young peafowl (which fledge after one to two
weeksFowler, 2011) also have ratios below this value. Recent estimates for Microraptor yield values within this range (Allen et al., 2013).
Fledging aged Chukars and Peafowl have a reduced flight muscle fraction compared to adult birds. In Chukar’s, at 14–15 dph, the pectoral mass is only 48–62% the relative size (as a proportion of total mass) compared to adult birds, while in Peafowl (12 dph) this range is between 38–45% (Heers & Dial, 2015). Yet at this age the wing loading values are significantly less than in adults, with 15 dph Chukars showing values only 38% of adults and 11–14 dph Peafowl showing values ranging from 22–25% of those seen in adults. Among non-avian theropods onlyMicroraptor(specimens BMNHC PH 881, IVPP V 13352, LVH 0026 underAlexander et al., 2010’s mass estimate) and the juvenile Anchiornis (BMNHCPH828) have similar wing loading values to fledging aged Chukar (10–17 dph) (Heers & Dial, 2015). Of these, onlyMicroraptor and early avians have previously been suggested to have similar pectoral muscle mass fractions (pectoral limbs region 13–15% of total mass perAllen et al., 2013) combined with similar wing loading values as seen in volant juvenile Chukars (minimum forelimb muscle mass of 14% of body mass, wing loading values below 80 N/m2). Thus, we contend that these taxa may have had a power output that would be capable of ground based take off, as the reduced pectoral musculature was compensated for by their large wing size.
Even at slight lower estimates of flight muscle, mass percentage take off may be possible inMicroraptorand basal avians. Early fledgling aged Chukar chicks show forelimb muscle mass fractions (Heers & Dial, 2015) below the 16% suggested as the minimum for takeoff byMarden (1987). This is due to their proportionally large wings. With such a proportionally large wing area, even at low forelimb mass fledging aged Chukars can that generate lift values estimated at between 10.4–12.2 N/kg of body mass (using the muscle-specific power output value of 360 W/kg perAskew, Marsh & Ellington, 2001) which exceeds the minimum needed for takeoff (9.8 N/kg) (Marden, 1994). Therefore, if wing area can partially overcome the need for significant muscle mass fractions arguments on the need for a selective pathway to muscle hypertrophy need not be invoked when discussing the origins of flight. This would also help explain the lack of features indicating significant hypertrophy in pectoral musculature, such as a lack of a sternal plate, in the earliest fliers (Zheng et al., 2014) and the delayed presence of a keel until
For WAIR, a similar tradeoff between muscle mass and wing area likely exists. In juvenile galliforms, flight muscle mass increases logistically throughout ontogeny. In Chukars this goes from about 2% in crawling, non-WAIR capable 3 dph juveniles to 26–29% in 100 + dph adults (Heers & Dial, 2015). Individuals capable of stage I WAIR (8 dph, maximum WAIR angle 65) have proportional muscle masses between 7.5–9.9% of body mass, which represents 25–40% of adult proportional pectoral mass values
(Heers & Dial, 2015). They also show wing loading values only 55–60% those of an adult,
which should be noted can achieve much larger maximum WAIR angles (> 90). A similar pattern is seen in both late Stage II WAIR Chukars and in juvenile Peafowl. The former can ascend up to 85despite showing reduced pectoral muscle mass relative to body mass (48–62% adult values) but have wing loading values only 40% those of adult birds. Juvenile peafowl, which at 12 dph can achieve higher WAIR angles than adults, display less than half the relative pectoral muscle mass fraction of adults, but have wing loading value of only 1/4 to 1/3 that seen in adults (Heers & Dial, 2015). This suggests that reducing wing loading could partially compensate for the lower proportional muscle mass, an idea that is also supported by findings in Brush Turkeys where low wing loaded juveniles can WAIR whereas adults cannot (Dial & Jackson, 2011).
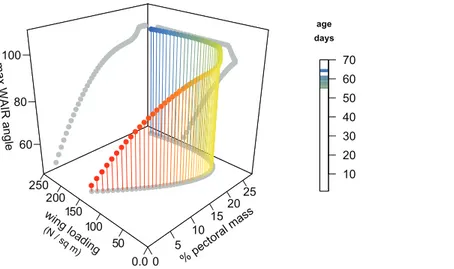
We generated a model for Chukar WAIR ontogeny that predicts wing loading, pectoral mass, maximum WAIR angle, and age using data fromHeers & Dial (2015)(Fig. 4). Most relationships are nonlinear and multimodal, suggesting complex interactions between these factors. The original and modeled data show an inflection point between 20–30 dph. Up to this age, maximum WAIR angle asymptotes at less than 90(Jackson, Segre & Dial,
2009;Heers & Dial, 2015). This corresponds to when the pectoral muscles reaches∼20%
total body mass and the beginning of Stage III where both extended level flight and vertical flight is possible (Jackson, Segre & Dial, 2009). Here is also when we begin to see, through in vivo measurements, the steady increase in wing loading values from their minimum of 55 N/m2at day 22 continuing upwards to the full term (100 + dph) score of 161 N/m2.
Early stage Chukar chicks have forelimb masses within the range suspected for non-avian theropods (up to 15 dph) and we see a correlation among these chicks between maximum WAIR angle and lower wing loading (Figs. 4and5). WAIR capable Chukar chicks during this period, which corresponds to late Stage I through Stage II ofJackson,
Segre & Dial (2009), show relatively constant wing beat frequencies (22–26 Hz) and flap
angles (∼140) further supporting the idea that wing loading is a major factor influencing
(N / sq m)
Figure 4 3D scatterplot of values for Chukars modeled for the first 70 days of growth.2D projections of the values are shown on each axis-pair plane with grey circles. Age, pectoral limb muscle mass, wing loading, and WAIR performance data are fromHeers & Dial (2015). Maximum WAIR angle was limited to 100. Regressions were neither linear nor unimodal suggesting a complex interaction between musculoskeleletal and aerofoil ontogeny and performance. Mass (g) was estimated from age by the quadratic equation 5.730818 + 3.472647x +-0.011605x2+ 0.000661x3(R2= 0.9902); only ages
less than 100 days were used. Percent pectoral mass was estimated from mass by the quadratic equation 0.858022 + 0.231592x-0.000658x25.9340-7x3(R2= 0.92). Wing loading was estimated
from mass by the quadratic equation 1.692164 +-0.018717x + 8.756264-5x2+-9.483335-8x3
(R2= 0.69). Maximum WAIR angle was estimated from mass by the quadratic equation 38.119489 + 1.137820x +-0.007969x2+ 1.925223e-05x3(R2= 0.9575).
Figure 5 Regression of measured wing loading versus maximum.WAIR angle in Chukar chicks aged 3–15 day post hatching and estimates for selected non-avian theropods. Chuckar data are fromHeers &
Dial (2015). Large circles denote Chukar values with their age given as the number inside. Regression for
Chuckar data is 100.17-20.824x, R2 = 0.848. Small circles denote estimated paravian theropods. Only
specimens with wing loading values comparable to those seen in Chukars (< 2.0 g/cm2= 196 N/m2) were included. Demarcation of quadrupedal crawling to WAIR at 65 was based onJackson, Segre & Dial
(2009). Non-avian theropods are: f1,Anchiornis huxleyi BMNHCPH828; f2,Anchiornis huxleyiLPM
B00169; f3,Aurornis xuiYFGP-T5198; f4,Changyuanraptor yangiHG B016; f5,Eosinopteryx brevipenna