Acta Scientiarum
http://periodicos.uem.br/ojs/acta ISSN on-line: 1807-8672
Doi: 10.4025/actascianimsci.v40i1.38806 ANIMAL PRODUCTION
Analysis of growth curves in different lineages of
Caipira
broiler type
Caroliny Costa Araújo1,3*, Kênia Ferreira Rodrigues1,2, Roberta Gomes Marçal Vieira Vaz1,2, Ana Carolina Müller Conti1,2, Aline Ferreira Amorim1,3 and Carla Fonseca Alves Campos1,3
1
Escola de Medicina Veterinária e Zootecnia, Universidade Federal do Tocantins, BR-153, km 112, s/n., Cx. postal 132, 77804970, Araguaína, Tocantins, Brasil. 2Universidade Federal do Tocantins, Araguaína, Tocantins, Brasil. 3 Programa de Pós-graduação em Ciência Animal Tropical, Universidade Federal do Tocantins, Araguaína, Tocantins, Brasil. *Author for correspondence. E-mail: [email protected]
ABSTRACT. The objective of this work was to identify, by means of different statistical criteria the ideal nonlinear regression model to describe the growth curve of three lineages of caipira broiler for meat production. A total of 90 birds were used, being 30 birds from each of the following lineages: Pescoço Pelado,
Carijó and Pesadão Vermelho. The individual body weight of broilers (1, 7, 14, 21,28, 35, 42, 49, 56, 63, 70, 77, 84 and 91 days of age) was collected weekly for determination of growth curves by means of Models von Bertalanffy, Gompertz, Logistic, Richards and Brody. The parameters of Brody model did not converge to the weight of strains. The model that better adjusted to the data was Logistic.
Keywords: statistical model; birds; weight; age; lineage.
Análise de curvas de crescimento em diferentes linhagens de frangos de corte tipo Caipira
RESUMO. Objetivou-se com este trabalho identificar, por meio de diferentes critérios estatísticos, o modelo de regressão não linear mais adequado para descrever a curva de crescimento de três linhagens de frangos caipira para produção de carne. Utilizaram-se 90 aves caipiras, sendo 30 aves de cada uma das seguintes linhagens: Pescoço Pelado, Carijó e Pesadão Vermelho. Foi coletado semanalmente o peso corporal individual dos frangos (1, 7, 14, 21,28, 35, 42, 49, 56, 63, 70, 77, 84 e 91 dias de idade) para determinação das curvas de crescimento por meio dos modelos Von Bertalanffy, Gompertz, Logístico, Richards e Brody. Os parâmetros do modelo Brody não convergiram, sendo então não adequado para descrever o peso dessas linhagens. O modelo que melhor se ajustou aos dados foi o Logístico.
Palavras-chaves: modelo estatístico; aves; peso; idade.
Introduction
The production of caipira broilers, or slow-growing birds, is one of the segments of alternative poultry farming that has been favorable, once, in addition to adding value to the product and using a production system that values animal welfare standards, serves both for small and medium-sized producers and for production on a commercial scale (Morais et al., 2015).
Among the lineages used in the production system we have the slow growing Pescoço Pelado, cinnamon and dark yellow skin, reddish plumage, reaching 2.3 kg weight around 70 days old, it is the most widespread lineage in Brazil. The Carijó
lineage has a slow-growing barred-type plumage, presenting a dual ability to produce eggs and meat weighing 2.3 kg at 70 days of age. And the Pesadão Vermelho lineage has dark red plumage and black tail feathers and yellow skin and legs, at 70 days of age it reaches 2.4 kg (Clementino et al., 2007; Hellmeister Filho, Menten, Silva, Coelho, & Savino, 2003).
The four most applied curves to represent growth in animal species are Brody, Logístico, Gompertz and Von Bertalanffy. All of them, are special cases of the Richards curve, which, is represented by the equation:
Yt = A (1 ± b exp − kt)1/(1 − m), wherein Yt is the body weight the age t, A is the asymptotic value, b is the scale parameter, k is the maturity index and m is the inflection parameter, which determines the shape of the function (Tholon & Queiroz, 2009).
Since asymptotic value or asymptotic weight (A) is interpreted as adult animal weight, final weight or theoretical maximum weight. However, the scale parameter or integration constant (b) does not have biological interpretation, its function is to model the sigmoid from initial values of birth weight to adulthood. The maturity index (k) is the rate at which a logarithmic function of the weight changes linearly per unit of time. It can be, biologically, interpreted as growth rate or gain velocity, representing the slope of the growth curve (Veloso, Ferreira, Winkelstroter, Silva, Pires et al., 2015).
Considering these aspects, the aim of this work was to identify, through different statistical criteria, the best acceptable adjustment of the non-linear regression model to describe the growth curve of three lineages of
Caipira broilers for meat production.
Material and methods
The experiment was conducted in the poultry sector of the School of Veterinary Medicine and Zootechny of the Federal University of Tocantins (UFT), municipality of Araguaína, northern region of Tocantins, from June to August 2016, with a mean temperature of 34°C maximum, 26.2°C minimum and relative humidity 64%.
Using 90 caipira birds, 30 birds from each of the following lineage: Pescoço Pelado, Carijó and Pesadão Vermelho, obtained in the local commerce.
The day-old chicks were weighed and divided by lineage in experimental metal cages (1.00x1.00x0.40m) located inside the conventional shed (8m x 6m), covered with babassu straw, concrete floor and side curtains, managed according to the behavior of the birds. The cages were equipped with troughs and water troughs of the gutter type and contained a lighting system for heating the chicks. During the first three days, cup-type drinkers and dish type feeders were used to stimulate water and feed intake.
Until the 10th day of life, the birds were artificially
heated using incandescent bulbs (60 W), installed inside the cages. At 29 days of age the birds were transferred to the pickets, following the same division, where each picket had a shelter covered with babassu straw, with pendula water tank and tubular feeder. Commercial rations based on maize and soybean meal
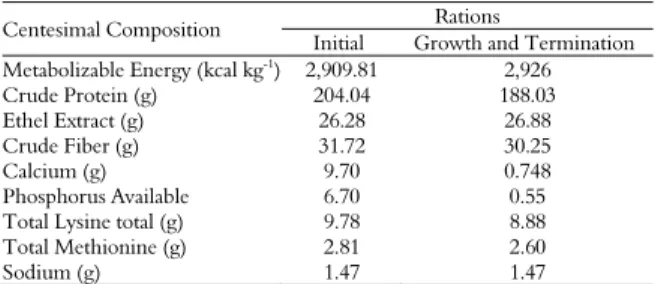
were used to meet the nutritional requirements of birds in the initial phase (1 to 28 days), growth (29 to 56 days) and termination (57 to 91 days). The centesimal composition of rations purchased in local commerce is shown in Table 1.
Table 1. Centesimal composition of the commercial rations provided in the initial phase, growth and termination.
Centesimal Composition Rations
Initial Growth and Termination Metabolizable Energy (kcal kg-1
) 2,909.81 2,926
Crude Protein (g) 204.04 188.03 Ethel Extract (g) 26.28 26.88 Crude Fiber (g) 31.72 30.25
Calcium (g) 9.70 0.748
Phosphorus Available 6.70 0.55 Total Lysine total (g) 9.78 8.88 Total Methionine (g) 2.81 2.60
Sodium (g) 1.47 1.47
Source: Provided by feed manufacturer.
The individual body weight of the chickens was measured weekly, (1, 7, 14, 21,28, 35, 42, 49, 56, 63, 70, 77, 84 and 91 days of age).
For the determination of the growth curves of the body weight of the birds, the collected data were evaluated through the growth models:
Gompertz: y=a*exp(-b*exp(-k*age)); Logistica: y=a*((1+b*exp(-k* age))**-1); Bertalanffy: y=a*(1-b*exp(-k* age))**3; Richards: y=a*(1-b*(exp(-k* age)))**m; Brody: y=a*((1-b*exp(-k* age))**1);
Statistical analyzes were performed using the procedure for analysis of non-linear models (PROC NLIN) do software Statistical Analysis System (SAS, 2002) by the iterative method of Gauss-Newton.
The criteria used to choose the best fit model of the growth curve were the coefficient of determination (R²), calculated by the 1 – (SQR/SQTc), being SQR the sum of squares of the residue and SQTc the total sum of squares corrected by the mean. The asymptotic standard deviation (ASD), calculated from the square root of the mean square of the residue of each model. The absolute mean deviation (AMD), as proposed by Sarmento (2006), calculated as:
= ∑ −
Growth curves of Caipira type chickens Page 3 of 5
Results and discussion
The slaughter weight of chickens is 2.3 kg on average, so that the Pescoço Pelado lineage (PP) takes less time to reach the age of slaughter, followed by the
Pesadão Vermelho and Carijó lineages (Table 2). However, Veloso et al. (2015) verified that the lineages Pescoço Pelado, Pesadão Vermelho and Carijó reached a weight of 2.3 kg at 70 days of age.
The equations proposed by Von Bertalanfy, Gompertz and Logistic reached convergence, while the analysis carried out through the Richards Model only converged for the Pescoço Pelado and Pesadão
lineages. For the Carijó lineage that did not converge, showing that this model is not adequate for the description of the weights of this lineage. The equation proposed by Brody did not converge for any of the lineages studied (Table 3).
In all the models studied, the parameter "a" (weight at adult age) presented higher value for the Pescoço Pelado
(Table 3). This result shows that birds of the Pescoço Pelado lineage tend to have the greatest weight in adulthood, and the birds of the Pesadão lineage, which presented lower values of "a" in the Bertalanffy and Gompertz models, tend to have less weight at maturity. In the logistic model the values of "a" of Carijó and Pesadão lineages are close.
The "k" parameter represents the speed at which the animal goes through the growth period until it becomes an adult. In the Bertalanffy, Gompertz and Logistico models the value of "k" is higher for the Pescoço Pelado, indicating a higher growth rate, and lower for the Carijó, indicating a lower growth rate (Table 3).
According to Drumond et al. (2013), the value of R² would not be a good indicator for the choice of the
model, since they present high and very close values. However, in this study, R² values, although high, had a difference between the studied lineages, indicating the
Pescoço Pelado with the best adjustment and the Pesadão
the worse adjustment to the model.
The lowest absolute mean deviation (AMD), asymptotic standard deviation (ASD), and asymptotic index (AI) were found in the Pescoço Pelado lineage best adjustment to the models, while the Pesadão lineage presented the highest values of AMD, ASD and AI, indicating a worse adjustment to the models (Table 3).
The lowest AI value for the three studied lineages was observed in the logistic model, which is considered the best adjusted model, once AI is a criterion that takes R², AMD and ASD into consideration. It is considered a complete criterion and so recommended as a model of choice.
Veloso et al. (2015) analyzed the models of growth curves for the Pescoço Pelado, Pesadão Vermelho, Tricolor,
Carijó and Colorpak lineages and confirmed that the Richards and Brody models did not adjust to the description of the growth of Caipira birds, and that the models Gompertz, Bertalanffy and Logistico adjusted to the growth of the studied lineages. From the three of them, the Bertalanffy model was the one that showed the best adjustment.
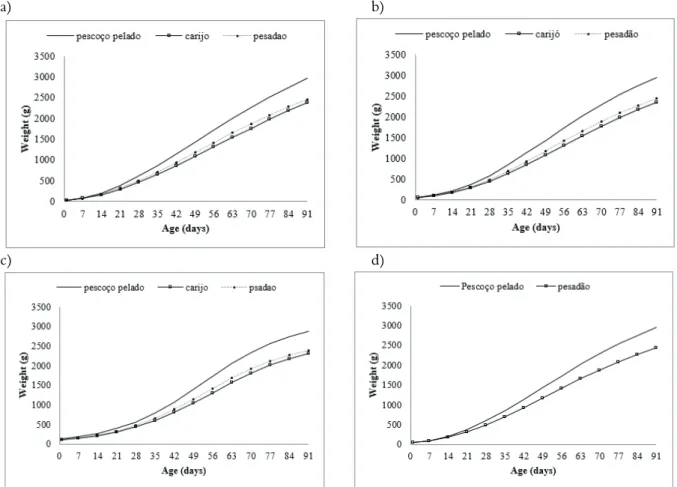
Up to 14 days of age, the different lineages showed a similar growth rate (Figure 1). However, after 14 days the highest growth rate was observed in the Pescoço Pelado lineage, possibly due to genetics and its better adaptation to warm climate regions. Next, it was the Pesadão and last, with lowest growth rate was the Carijó, probably for being a bird of double aptitude (meat and eggs).
Table 2. Mean of body weights (g) at different ages for lineages (L) Pescoço Pelado (PP), Carijó (CJ) and Pesadão (PD).
L
Body Weight (g)
1day 7days 14 days 21 days 28 days 35 days 42 days 49 days 56 days 63 days 70 days 77 days 84 days 91 days PP 28.2 87.1 206.8 385.5 599.6 834.4 1107.2 1420.7 1696. 2 2000.7 2245.8 2497.7 2723. 2 2899.5 CJ 34.6 85.0 176.9 307.4 646.6 622.5 837.0 1064.0 1298.0 1552.0 1772.0 1984.0 2196.0 2331.0 PD 35.5 82.1 177.6 325.0 500.5 682.8 931.2 1093.4 1428.6 1663.3 1874.5 2089.1 2250.3 2449.8
Table 3. Estimated parameters for the growth curves of lineages (L) Pescoço Pelado (PP), Carijó (CJ), and Pesadão (PD), according to the models Von Bertalanffy, Gompertz, Logístico and Richards.
L
Estimated Parameters R²
AMD ASD A
a b k m
Bertalanffy
PP 4686.30 0.86 0.01 - 0.96 165.39 249.83 83.47
CJ 4449.00 0.83 0.01 - 0.91 228.54 352.46 123.00
PD 4056.50 0.84 0.01 0.87 305.13 460.18 154.17
Gompertz
PP 3876.90 44360 0.03 - 0.96 166.86 249.58 81.74
CJ 3414.80 43307 0.02 - 0.91 228.49 352.15 122.74
PD 3298.40 43457 0.02 - 0.87 305.42 460.06 153.76
Logístico
PP 3149.40 25.44 0.06 - 0.96 180.87 254.78 72.93
CJ 2613.70 25.38 0.05 - 0.91 235.67 353.57 116.98
PD 2639.30 24.60 0.05 0.87 315.30 461.84 145.67
Richards
PP 4098.10 0.44 0.02 8.12 0.96 165.39 249.48 83.11
CJ NC NC NC NC NC NC NC NC
PD 3466.00 0.37 0.02 9.66 0.87 304.50 460.03 154.66
a= weight to adulthood; b= constant integration; k= maturity rate; R2= determination coefficient; AMD= absolute mean deviation; ASD= asymptotic standard deviation; AI=
a) b)
c) d)
Figure 1. Growth curves of the different lineages according to the models: a) Von Bertalanffy; b) Gompertz; c) Logístico; d) Richards.
Morais et al. (2015) found different growth curves of the lineages, Carijó, Pesadão, Pescoço Pelado, and Mista, in which there was a divergence in the growth of birds from 35 days of age. The Pescoço Pelado lineage was the one that presented the slowest growth and the Pesadão lineage presented the fastest growth.
Conclusion
The model that best fit the data was the Logistic because it contained less asymptotic index.
References
Clementino, C. S., Martins, D. M., Britto, F. B., Barbosa, F. J. V., Lima, P. S. C., & Diniz, F. M. (2007). Variabilidade fenotípica e genotípica em galinhas caipiras (Gallus gallus domesticus): resultados preliminares. Embrapa Meio-Norte-Circular Técnica, 46, 1-4.
Drumond, E. S. C., Gonçalves, F. M., Veloso, R. C., Amaral, J. M., Balotin, L. V., Pires, A. V., & Moreira, J. (2013). Curvas de crescimento para codornas de corte.
Ciência Rural, 43(10), 1872-1877.
Hellmeister Filho, P., Menten, J. F. M., Silva, M. A. N., Coelho, A. A. D., & Savino, V. J. M. (2003). Efeito de
genótipo e do sistema de criação sobre o desempenho de frangos tipo caipira. Revista Brasileira de Zootecnia, 32(6), 1883-1889.
Laird, A. K., & Howard, A. (1967). Growth curves in inbred mice. Nature, 213(5078), 786-788.
Marcato, S. M., Sakomura, N. K., Fernandes, J. B. K., Siqueira, J. C., Dourado, L. R. B., & Freitas, E. R. (2010). Crescimento e deposição de nutrientes nos órgãos de frangos de corte de duas linhagens comerciais. Revista Brasileira de Zootecnia, 39(5), 1082-1091.
Morais, J., Ferreira, P. B., Jacome, I. M. T. D., Mello, R., Breda, F. C., & Rorato, P. R. N. (2015). Curva de crescimento de diferentes linhagens de frango de corte caipira. Ciência Rural, 45(10), 1872-1878.
Ratkowsky, D. A. (1993). Principles of nonlinear regression modeling. Journal of Industrial Microbiology, 12(3-5), 195-199.
Rondon, E. O. O., Murakami, A. E., & Sakaguti, E. S. (2002). Modelagem computacional para produção e pesquisa em avicultura. Revista Brasileira de Ciência Avícola, 4(1), 199-207.
Growth curves of Caipira type chickens Page 5 of 5
Statistical Analysis System [SAS]. (2002). SAS/STAT User’s guide, Version 9.1. Cary, NC: SAS Institute Inc. Tholon, P., & Queiroz, S. A. (2009). Modelos
matemáticos utilizados para descrever curvas de crescimento em aves aplicados ao melhoramento genético animal. Ciência Rural, 39(7), 2261-2269. Veloso, R. C., Ferreira, T. A., Winkelstroter, L. K., Silva,
M. T. P., Pires, A. V., Torres Filho, R. A., & Pinheiro, S. R. F. (2015). Genetic divergence between genotypes
for male and female broilers. Ciência Rural, 46(3), 554-559.
Received on August 03, 2017. Accepted on October 16, 2017.