Labor-Associated Gene Expression
in the Human Uterine Fundus, Lower Segment,
and Cervix
Radek Bukowski1*, Gary D. V. Hankins1, George R. Saade1, Garland D. Anderson1, Steven Thornton2
1Department of Obstetrics and Gynecology, University of Texas Medical Branch at Galveston, Galveston, Texas,2Warwick Medical School, University of Warwick, Coventry, United Kingdom
Funding:This project was funded by the Department of Obstetrics and Gynecology, University of Texas Medical Branch at Galveston. The Warwick parturition group is supported by Wellbeing and Action Medical Research. The funders had no role in study design, data collection and analysis, decision to publish, or preparation of the manuscript.
Competing Interests:The authors have declared that no competing interests exist.
Academic Editor:Nicholas Fisk, Imperial College London, United Kingdom
Citation:Bukowski R, Hankins GDV, Saade GR, Anderson GD, Thornton S (2006) Labor-associated gene expression in the human uterine fundus, lower segment, and cervix. PLoS Med 3(6): e169. DOI: 10.1371/ journal.pmed.0030169
Received:July 19, 2005 Accepted:January 31, 2006 Published:June 13, 2006
DOI:
10.1371/journal.pmed.0030169
Copyright:Ó2006 Bukowski et al. This is an open-access article distributed under the terms of the Creative Commons Attribution License, which permits unrestricted use, distribution, and reproduction in any medium, provided the original author and source are credited.
Abbreviations:ERA, estrogen receptor alpha; GAPDH, glyceraldehyde-3-phosphate dehydrogenase; REA, repressor of estrogen receptor activity; RXR, retinoid X receptor alpha
* To whom correspondence should be addressed. E-mail: rkbukows@ utmb.edu
A B S T R A C T
Background
Preterm labor, failure to progress, and postpartum hemorrhage are the common causes of maternal and neonatal mortality or morbidity. All result from defects in the complex mechanisms controlling labor, which coordinate changes in the uterine fundus, lower segment, and cervix. We aimed to assess labor-associated gene expression profiles in these functionally distinct areas of the human uterus by using microarrays.
Methods and Findings
Samples of uterine fundus, lower segment, and cervix were obtained from patients at term (mean6SD¼39.160.5 wk) prior to the onset of labor (n¼6), or in active phase of labor with spontaneous onset (n ¼ 7). Expression of 12,626 genes was evaluated using microarrays (Human Genome U95A; Affymetrix) and compared between labor and non-labor samples. Genes with the largest labor-associated change and the lowest variability in expression are likely to be fundamental for parturition, so gene expression was ranked accordingly. From 500 genes with the highest rank we identified genes with similar expression profiles using two independent clustering techniques. Sets of genes with a probability of chance grouping by both techniques less than 0.01 represented 71.2%, 81.8%, and 79.8% of the 500 genes in the fundus, lower segment, and cervix, respectively. We identified 14, 14, and 12 those sets of genes in the fundus, lower segment, and cervix, respectively. This enabled networks of co-regulated and co-expressed genes to be discovered. Many genes within the same cluster shared similar functions or had functions pertinent to the process of labor.
Conclusions
Our results provide support for many of the established processes of parturition and also describe novel-to-labor genes not previously associated with this process. The elucidation of these mechanisms likely to be fundamental for controlling labor is an important prerequisite to the development of effective treatments for major obstetric problems—including prematurity, with its long-term consequences to the health of mother and offspring.
Introduction
The onset and progression of normal labor involves complex maternal and fetal interactions leading to dilation of the cervix and coordinated uterine contractions.
Temporal disruption of this process can lead to preterm delivery, and ineffective uterine contractility can cause failure to progress in labor or postpartum hemorrhage. These problems have important consequences. Preterm delivery is a major cause of neonatal mortality and morbidity, including long-term neurological impairment [1]. Failure to progress in labor may lead to maternal morbidity and/or caesarean section [2] with its inherent risks, and postpartum hemorrhage is one of the main causes of maternal mortality worldwide [3].
Pregnancy is maintained by myometrial quiescence and cervical resistance. Toward term, there is a progressive activation of the myometrium and the cervix ripens in preparation for labor. Labor is associated with dramatic changes in myometrial contractions and cervical dilation resulting from increased stimulatory and reduced inhibitory processes [4]. These effects are due to simultaneous and interdependent changes in cellular proteins initiated by a multitude of genes. The molecular processes are spatially coordinated to result in uterine contractions with
simulta-neous cervical dilation. Additional spatial organization of contractile processes within the myometrium results in increased contractility of the fundus compared to the lower segment [4–7].
The specific changes in gene expression that cause these temporal and spatial effects are largely unknown. Our hypothesis is that labor results from the simultaneous change in expression of a large number of genes that are organized into co-regulated networks. We examined the labor-associated gene expression changes in the human fundus, lower segment, and cervix using Affymetrix genome DNA microarrays.
Methods
Sample Collection
Tissue was obtained from patients undergoing cesarean section and sterilization without medical or obstetrical complications of pregnancy and who were not exposed to medications immediately before enrollment. The procedure was approved by the Institutional Review Board and Coventry Research Ethics Committee (IRB 00-022, CREC 062/05/01), and informed consent was obtained from all eligible patients. Samples were obtained from patients at term (mean6SD¼
39.160.5 wk) prior to the onset of labor (n¼6), or in active phase of labor with spontaneous onset (n¼ 7). Labor was
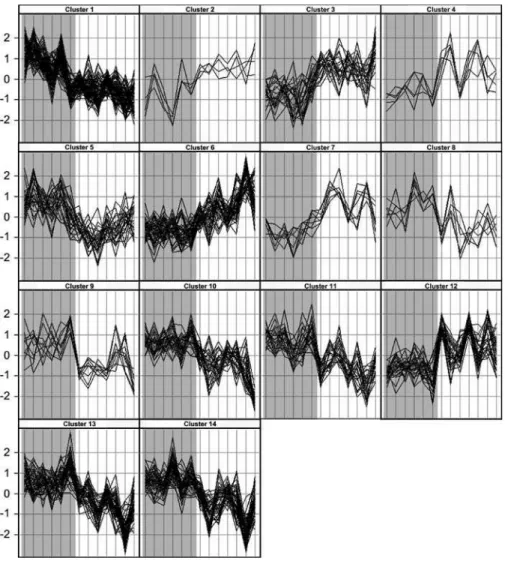
Figure 1.Profiles of Gene Expression in the Uterine Fundus from Women before or after the Onset of Labor
Each panel shows profiles of the genes within one of the clusters determined jointly by K-means and hierarchical clustering. On thex-axis, samples from individual patients are arranged and represented by vertical lines. Non-labor samples (gray background) are shown on the left and labor (white background) on the right. They-axis represents the level of gene expression as a number of standard deviations from the mean of all observations for each gene (z-score).
defined as cervical dilatation of.3 cm or progressive dilation accompanied by regular uterine contractions. Patients not in labor were delivered by cesarean section on maternal request following counseling by obstetrician because of previous cesarean section or because an abnormal fetal presentation in the index pregnancy made vaginal delivery unsafe. Patients in labor had failure to progress despite adequate contractility or fetal intolerance of labor.
For each patient, samples (approximately 1 cm3) were
taken from the uterine fundus (the outside surface of the uterus that does not include decidua), the lower segment at the upper edge of the incision, and the anterior lip of the cervix, through the vagina. We have previously shown that our lower-segment samples are more than 98% myometrial smooth muscle [8]. In one patient, a biopsy of the cervix could not be obtained. Samples were immediately snap-frozen in liquid nitrogen and stored at808C.
Microarray Analysis
All samples were analyzed separately without pooling of extracted RNA. RNA isolation was performed using TRIzol
Reagent (Gibco BRL Life Technologies, San Diego, California, United States) followed by phenol extraction and ethanol precipitation. Genomic contamination was removed by on-column treatment of RNA samples with DNAse (27 Kunitz units) for 20 min at 20 8C (Qiagen, Valencia, California, United States).
Isolated total RNA was quantified by spectrophotometry. Double-stranded cDNA was synthesized from total RNA using T7-(dT)24oligomer primer (Genset Corp., La Jolla, California,
United States) and Superscript II Reverse Transcriptase (Gibco BRL Life Technologies). For complete recovery of the cDNA, samples were subjected to phase-lock gel phenol-chloroform extraction and ethanol precipitation. 1 lg of cDNA was used for an in vitro transcription reaction, which involved the synthesis of the biotin-labeled cRNA from the cDNA with biotinylated CTP and UTP (Enzo Life Sciences, Farmingdale, New York, United States). The biotin-labeled RNA fragments were then hybridized to microarray chips (Human Genome U95A; Affymetrix, Santa Clara, California, United States). Microarrays from several different lots were used to analyze samples. Different lots of microarrays will
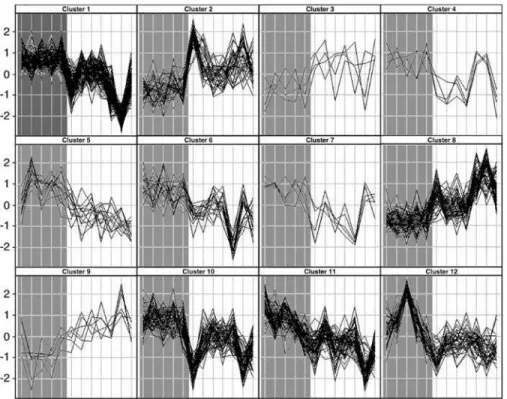
Figure 2.Profiles of Gene Expression in the Uterine Lower Segment from Women before or after the Onset of Labor
Each panel shows profiles of the genes within one of the clusters determined jointly by K-means and hierarchical clustering. On thex-axis, samples from individual patients are arranged and represented by vertical lines. Non-labor samples (gray background) are shown on the left and labor (white background) on the right. They-axis represents the level of gene expression as a number of standard deviations from the mean of all observations for each gene (z-score).
increase variability of findings but will minimize the chance of a bias or systematic error associated with a certain lot and resulting in false positive and negative findings. The chips were washed, stained on a fluidic station, and scanned by confocal microscope. Each chip was used only once. The average difference intensity was calculated and describes the difference between the intensities of emitted light from hybridized matched probes and their mismatched controls. The average for the 20 probes and their controls are calculated for each gene.
To allow comparison between genes and patients, average difference intensities were converted into percentiles andz -scores. To allow comparison between genes, the differences in RNA hybridizations between probes and controls were normalized by conversion into percentiles. To allow compar-ison of samples (chip to chip), the percentile values were converted intoz-scores for a given gene expression across all samples (expression value – mean/standard deviation).
Identification of the putative gene functions used NetAffx (Affymetrix), an integrated online resource from the Gen-Bank, UniGene, and Gene Ontology databases, and the Ingenuity database (http://www.ingenuity.com).
Statistical Methods
All samples were analyzed separately. To identify genes demonstrating a maximal labor-associated change in expres-sion, the p-value was calculated by Student’s t-test. This p -value was used as a measure of the magnitude of the change and inter-subject variability rather than to determine significance. Genes were ordered according to the p-value. The 500 genes in each of the fundus, lower segment, and
cervix with the lowest p-values were selected for further analysis.
These genes were clustered using two different techniques: K-means and hierarchical. K-means is a non-hierarchical clustering method that groups data points into a predeter-mined number of clusters. It is an iterative process in which each gene profile is assigned to the closest centroid, which is the center point of a cluster. The centroid is then recomputed until a steady state has been reached. Euclidian distance was used as a similarity measure for gene profiles. Centroids were initialized using a data-based centroid search. The number of clusters was selected to provide a wide range of genes per cluster without uninformative clusters contain-ing no or scontain-ingle genes.
Hierarchical clustering arranges the genes on a treelike system. Clusters are merged if the expression profiles are similar. The similarity between gene expression profiles was calculated using Euclidian distance and between clusters using unweighted pair-group method with arithmetic mean. Genes clustered together by both techniques were identified. Coincidence testing [9] was used to determine whether co-clustering was likely to have arisen by chance. Figures 1–3 depict clusters of genes grouped together by both methods where probability of chance co-clustering wasp,0.01.
Within each of the coincidence clusters, we identified genes with functions similar to other genes within the same cluster or functions pertinent to the process of labor. For this purpose we used an interactive database of gene functions and interactions (Ingenuity pathway analysis) and biological knowledge database (http://www.ingenuity.com).
Figure 3.Profiles of Gene Expression in the Uterine Cervix from Women before or after the Onset of Labor
Each panel shows profiles of the genes within one of the clusters determined jointly by K-means and hierarchical clustering. On thex-axis, samples from individual patients are arranged and represented by vertical lines. Non-labor samples (gray background) are shown on the left and labor (white background) on the right. They-axis represents the level of gene expression as a number of standard deviations from the mean of all observations for each gene (z-score).
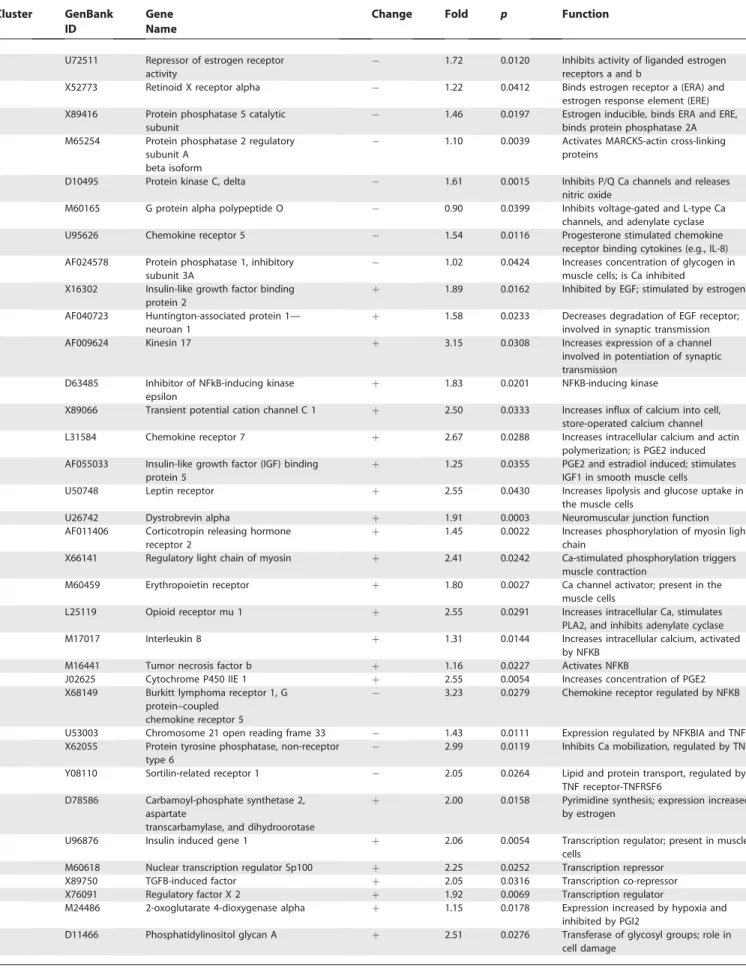
Table 1.Fundus: Selected Genes within Each of the Coincidence Clusters with Functions Similar to Other Genes within the Same Cluster or Functions Pertinent to the Process of Labor
Cluster GenBank
ID
Gene Name
Change Fold p Function
1 U72511 Repressor of estrogen receptor activity
1.72 0.0120 Inhibits activity of liganded estrogen receptors a and b
1 X52773 Retinoid X receptor alpha 1.22 0.0412 Binds estrogen receptor a (ERA) and
estrogen response element (ERE) 1 X89416 Protein phosphatase 5 catalytic
subunit
1.46 0.0197 Estrogen inducible, binds ERA and ERE, binds protein phosphatase 2A 1 M65254 Protein phosphatase 2 regulatory
subunit A beta isoform
1.10 0.0039 Activates MARCKS-actin cross-linking proteins
1 D10495 Protein kinase C, delta 1.61 0.0015 Inhibits P/Q Ca channels and releases
nitric oxide
1 M60165 G protein alpha polypeptide O 0.90 0.0399 Inhibits voltage-gated and L-type Ca
channels, and adenylate cyclase
1 U95626 Chemokine receptor 5 1.54 0.0116 Progesterone stimulated chemokine
receptor binding cytokines (e.g., IL-8) 1 AF024578 Protein phosphatase 1, inhibitory
subunit 3A
1.02 0.0424 Increases concentration of glycogen in muscle cells; is Ca inhibited 2 X16302 Insulin-like growth factor binding
protein 2
þ 1.89 0.0162 Inhibited by EGF; stimulated by estrogens
2 AF040723 Huntington-associated protein 1— neuroan 1
þ 1.58 0.0233 Decreases degradation of EGF receptor; involved in synaptic transmission
2 AF009624 Kinesin 17 þ 3.15 0.0308 Increases expression of a channel
involved in potentiation of synaptic transmission
2 D63485 Inhibitor of NFkB-inducing kinase epsilon
þ 1.83 0.0201 NFKB-inducing kinase
3 X89066 Transient potential cation channel C 1 þ 2.50 0.0333 Increases influx of calcium into cell, store-operated calcium channel
3 L31584 Chemokine receptor 7 þ 2.67 0.0288 Increases intracellular calcium and actin
polymerization; is PGE2 induced 3 AF055033 Insulin-like growth factor (IGF) binding
protein 5
þ 1.25 0.0355 PGE2 and estradiol induced; stimulates IGF1 in smooth muscle cells
3 U50748 Leptin receptor þ 2.55 0.0430 Increases lipolysis and glucose uptake in
the muscle cells
4 U26742 Dystrobrevin alpha þ 1.91 0.0003 Neuromuscular junction function
4 AF011406 Corticotropin releasing hormone receptor 2
þ 1.45 0.0022 Increases phosphorylation of myosin light chain
4 X66141 Regulatory light chain of myosin þ 2.41 0.0242 Ca-stimulated phosphorylation triggers
muscle contraction
4 M60459 Erythropoietin receptor þ 1.80 0.0027 Ca channel activator; present in the
muscle cells
4 L25119 Opioid receptor mu 1 þ 2.55 0.0291 Increases intracellular Ca, stimulates
PLA2, and inhibits adenylate cyclase
4 M17017 Interleukin 8 þ 1.31 0.0144 Increases intracellular calcium, activated
by NFKB
4 M16441 Tumor necrosis factor b þ 1.16 0.0227 Activates NFKB
4 J02625 Cytochrome P450 IIE 1 þ 2.55 0.0054 Increases concentration of PGE2
5 X68149 Burkitt lymphoma receptor 1, G protein–coupled
chemokine receptor 5
3.23 0.0279 Chemokine receptor regulated by NFKB
5 U53003 Chromosome 21 open reading frame 33 1.43 0.0111 Expression regulated by NFKBIA and TNF
5 X62055 Protein tyrosine phosphatase, non-receptor type 6
2.99 0.0119 Inhibits Ca mobilization, regulated by TNF
5 Y08110 Sortilin-related receptor 1 2.05 0.0264 Lipid and protein transport, regulated by
TNF receptor-TNFRSF6 6 D78586 Carbamoyl-phosphate synthetase 2,
aspartate
transcarbamylase, and dihydroorotase
þ 2.00 0.0158 Pyrimidine synthesis; expression increased by estrogen
6 U96876 Insulin induced gene 1 þ 2.06 0.0054 Transcription regulator; present in muscle
cells
6 M60618 Nuclear transcription regulator Sp100 þ 2.25 0.0252 Transcription repressor
6 X89750 TGFB-induced factor þ 2.05 0.0316 Transcription co-repressor
6 X76091 Regulatory factor X 2 þ 1.92 0.0069 Transcription regulator
7 M24486 2-oxoglutarate 4-dioxygenase alpha þ 1.15 0.0178 Expression increased by hypoxia and
inhibited by PGI2
7 D11466 Phosphatidylinositol glycan A þ 2.51 0.0276 Transferase of glycosyl groups; role in
Validation of the Microarray Findings
Labor-associated changes in the expression of selected genes were examined using RT-PCR. Reaction products were separated, detected, and quantified with chip-based gel electrophoresis (Agilent 2100 bioanalyzer; Agilent Technolo-gies, Palo Alto, California, United States) as described previously [10]. The number of PCR cycles (35) was selected from the linear portions of the dynamic ranges of amplifi-cation. The quantification and sizing coefficients of variation are ,6.7% and ,2.1%, respectively [11]. All mRNA abun-dance data were expressed relative to constitutively expressed
18S rRNA. The non-labor and labor samples were compared using the Mann-Whitney U test.
Results
We analyzed the expression of 12,626 known genes in biopsies taken from the fundus, lower segment, and cervix either before (n¼6) or after the onset of labor (n¼7). The expression of each gene was quantified using an Affymetrix gene microarray. Student’st-test was used to determine the
p-value for the difference in gene expression in samples taken before or after labor. This test identifies those genes with the
Table 1.Continued
Cluster GenBank
ID
Gene Name
Change Fold p Function
8 M68941 Protein tyrosine phosphatase, non-receptor type 4
þ 1.87 0.0136 Signal transduction downstream of the glutamate receptor
8 X90530 GTP-binding protein ragB þ 2.13 0.0302 Signal transduction
8 X86019 Wiskott-Aldrich syndrome protein interacting protein
þ 1.27 0.0365 Signal transduction from cell surface receptors to actin cytoskeleton
8 AL030996 THO complex 2 þ 1.67 0.0078 Transcription complex element
9 L22475 BCL2-associated X protein 1.87 0.0024 Decreases intracellular Ca storage
9 M80563 S100 calcium-binding protein A4 1.85 0.0440 Ca-binding protein decreasing ATPase
activity of myosin 9 Y12336 RAS guanyl releasing protein 2—
guanine nucleotide exchange factor
2.13 0.0364 Stimulates RhoA Ca sensitization–dependent maintenance of contraction
9 M13981 Inhibin alpha 2.21 0.0345 Stimulated by antiprogestins, synergistic with
progesterone, and inhibited by indomethacin
10 M27318 Interferon alpha 4 1.75 0.0188 Increases expression of IFNG (gamma)
10 U11870 Interleukin 8 receptor alpha 2.26 0.0393 Upregulated by INFG
10 D14838 Fibroblast growth factor 9 1.75 0.0220 Activated by INFG
10 W27605 Cone-rod homeobox gene 3.02 0.0226 Increases PDE6-cGMP-specific phosphodiesterase
10 X67594 Melanocortin 1 receptor 1.72 0.0195 Activates adenylate cyclase; binds POMC
10 AA846749 Apolipoprotein M 1.76 0.0003 Lipid transporter in energy pathway; inhibited
by POMC
11 U80017 Baculoviral IAP repeat-containing 1 1.72 0.0006 Apoptosis inhibitor
11 D29013 Polymerase beta 1.38 0.0367 Apoptosis inhibitor
11 M15024 v-myb myeloblastosis viral oncogene 1.20 0.0432 Apoptosis inhibitor
11 U76388 Steroid hormone nuclear receptor 5 A1 1.96 0.0054 Increases cAMP-mediated progesterone synthesis
11 U15422 Protamine 2 0.75 0.0290 Dephosphorylates glycogen synthase
12 U96781 Caþþtransporting ATPase in sarcoplasmic reticulum
1.82 0.0021 Ca-ransporting ATPase in sarcoplasmic reticulum; K activated
12 X63575 Caþþtransporting ATPase in plasma membrane 1.58 0.0256 Ca-transporting ATPase in plasma membrane; K activated
12 D49919 Chemokine receptor 8 1.04 0.0311 Increases intracellular Ca; inhibited by E2
12 X83228 Cadherin 17 2.07 0.0100 Ca-dependent protein transporter and cell-adhesion
molecule
12 D78011 Dihydropyrimidinase 1.69 0.0096 Inhibits L-type voltage-gated Ca channel
12 AL034562 Prodynorphin 1.48 0.0268 Ca stimulated, induces release of CGRP, which
increases cAMP and Ca
12 AF035594 Protein kinase C-alpha 0.99 0.0357 Ca-dependent regulation of Na/K ATPase in
sarcolemma
12 J05428 UDP glycosyltransferase 2 1.24 0.0166 Increases glucuronidation of E but not of P
12 D32202 Adrenergic alpha-1A receptor 1.84 0.0254 Increases smooth muscle tone via RhoGEF
activation 12 AB008430 FERM, RhoGEF-Rho guanine nucleotide exchange
factor
1.08 0.0432 Stimulates RhoA Ca sensitization–dependent maintenance of contraction
12 L26584 Ras protein-specific guanine nucleotide-releasing/exchange factor 1
1.07 0.0238 Stimulates RhoA Ca sensitization–dependent maintenance of contraction
12 W27674 Guanylate cyclase activator 1A 1.15 0.0262 Ca-sensitive guanylate cyclase activator
Cluster number identifies a coincidence cluster of genes grouped together by K-means and hierarchical clustering methods where probability of chance co-clustering wasp,0.01. The fold change is a ratio of the difference between labor and non-labor medians of gene expression to the non-labor median level of gene expression. The change sign indicates the direction of the expression change in the labor samples compared to non-labor. Thep-value is given for the difference in gene expression in samples taken before and after labor. Gene function is derived from the database of gene functions and interactions Ingenuity Pathway Analysis and Biological Knowledge Database.
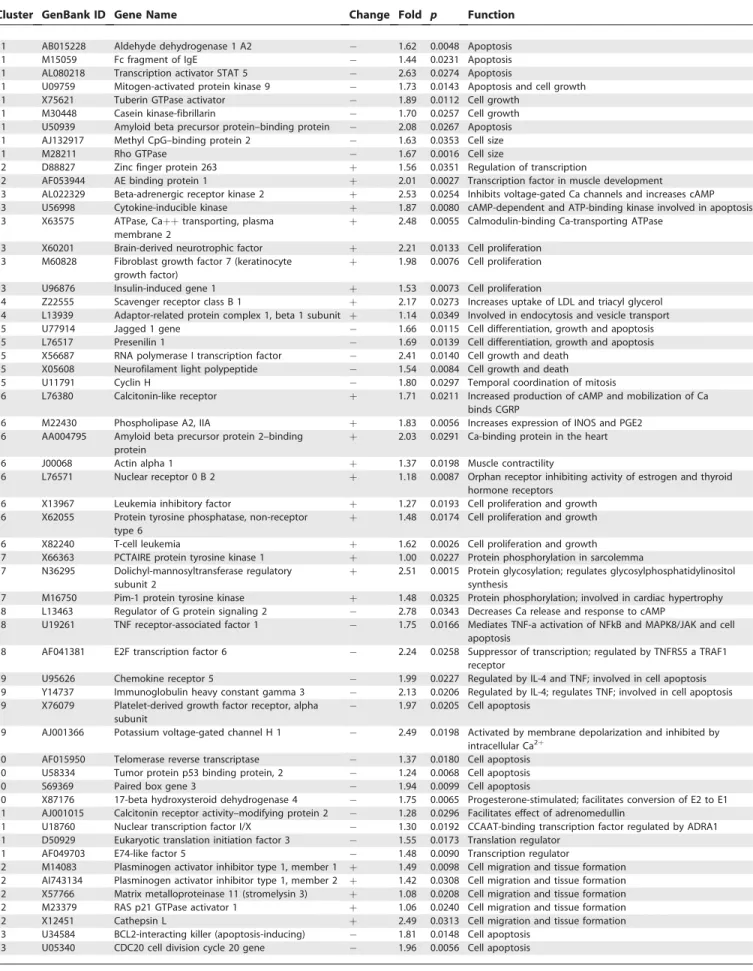
Table 2.Lower Segment: Selected Genes within Each of the Coincidence Clusters with Functions Similar to Other Genes within the Same Cluster or Functions Pertinent to the Process of Labor
Cluster GenBank ID Gene Name Change Fold p Function
1 AB015228 Aldehyde dehydrogenase 1 A2 1.62 0.0048 Apoptosis
1 M15059 Fc fragment of IgE 1.44 0.0231 Apoptosis
1 AL080218 Transcription activator STAT 5 2.63 0.0274 Apoptosis
1 U09759 Mitogen-activated protein kinase 9 1.73 0.0143 Apoptosis and cell growth
1 X75621 Tuberin GTPase activator 1.89 0.0112 Cell growth
1 M30448 Casein kinase-fibrillarin 1.70 0.0257 Cell growth
1 U50939 Amyloid beta precursor protein–binding protein 2.08 0.0267 Apoptosis
1 AJ132917 Methyl CpG–binding protein 2 1.63 0.0353 Cell size
1 M28211 Rho GTPase 1.67 0.0016 Cell size
2 D88827 Zinc finger protein 263 þ 1.56 0.0351 Regulation of transcription
2 AF053944 AE binding protein 1 þ 2.01 0.0027 Transcription factor in muscle development
3 AL022329 Beta-adrenergic receptor kinase 2 þ 2.53 0.0254 Inhibits voltage-gated Ca channels and increases cAMP 3 U56998 Cytokine-inducible kinase þ 1.87 0.0080 cAMP-dependent and ATP-binding kinase involved in apoptosis 3 X63575 ATPase, Caþþtransporting, plasma
membrane 2
þ 2.48 0.0055 Calmodulin-binding Ca-transporting ATPase
3 X60201 Brain-derived neurotrophic factor þ 2.21 0.0133 Cell proliferation 3 M60828 Fibroblast growth factor 7 (keratinocyte
growth factor)
þ 1.98 0.0076 Cell proliferation
3 U96876 Insulin-induced gene 1 þ 1.53 0.0073 Cell proliferation
4 Z22555 Scavenger receptor class B 1 þ 2.17 0.0273 Increases uptake of LDL and triacyl glycerol 4 L13939 Adaptor-related protein complex 1, beta 1 subunit þ 1.14 0.0349 Involved in endocytosis and vesicle transport
5 U77914 Jagged 1 gene 1.66 0.0115 Cell differentiation, growth and apoptosis
5 L76517 Presenilin 1 1.69 0.0139 Cell differentiation, growth and apoptosis
5 X56687 RNA polymerase I transcription factor 2.41 0.0140 Cell growth and death 5 X05608 Neurofilament light polypeptide 1.54 0.0084 Cell growth and death
5 U11791 Cyclin H 1.80 0.0297 Temporal coordination of mitosis
6 L76380 Calcitonin-like receptor þ 1.71 0.0211 Increased production of cAMP and mobilization of Ca binds CGRP
6 M22430 Phospholipase A2, IIA þ 1.83 0.0056 Increases expression of INOS and PGE2
6 AA004795 Amyloid beta precursor protein 2–binding protein
þ 2.03 0.0291 Ca-binding protein in the heart
6 J00068 Actin alpha 1 þ 1.37 0.0198 Muscle contractility
6 L76571 Nuclear receptor 0 B 2 þ 1.18 0.0087 Orphan receptor inhibiting activity of estrogen and thyroid hormone receptors
6 X13967 Leukemia inhibitory factor þ 1.27 0.0193 Cell proliferation and growth 6 X62055 Protein tyrosine phosphatase, non-receptor
type 6
þ 1.48 0.0174 Cell proliferation and growth
6 X82240 T-cell leukemia þ 1.62 0.0026 Cell proliferation and growth
7 X66363 PCTAIRE protein tyrosine kinase 1 þ 1.00 0.0227 Protein phosphorylation in sarcolemma 7 N36295 Dolichyl-mannosyltransferase regulatory
subunit 2
þ 2.51 0.0015 Protein glycosylation; regulates glycosylphosphatidylinositol synthesis
7 M16750 Pim-1 protein tyrosine kinase þ 1.48 0.0325 Protein phosphorylation; involved in cardiac hypertrophy 8 L13463 Regulator of G protein signaling 2 2.78 0.0343 Decreases Ca release and response to cAMP
8 U19261 TNF receptor-associated factor 1 1.75 0.0166 Mediates TNF-a activation of NFkB and MAPK8/JAK and cell apoptosis
8 AF041381 E2F transcription factor 6 2.24 0.0258 Suppressor of transcription; regulated by TNFRS5 a TRAF1 receptor
9 U95626 Chemokine receptor 5 1.99 0.0227 Regulated by IL-4 and TNF; involved in cell apoptosis 9 Y14737 Immunoglobulin heavy constant gamma 3 2.13 0.0206 Regulated by IL-4; regulates TNF; involved in cell apoptosis 9 X76079 Platelet-derived growth factor receptor, alpha
subunit
1.97 0.0205 Cell apoptosis
9 AJ001366 Potassium voltage-gated channel H 1 2.49 0.0198 Activated by membrane depolarization and inhibited by intracellular Ca2þ
10 AF015950 Telomerase reverse transcriptase 1.37 0.0180 Cell apoptosis 10 U58334 Tumor protein p53 binding protein, 2 1.24 0.0068 Cell apoptosis
10 S69369 Paired box gene 3 1.94 0.0099 Cell apoptosis
10 X87176 17-beta hydroxysteroid dehydrogenase 4 1.75 0.0065 Progesterone-stimulated; facilitates conversion of E2 to E1 11 AJ001015 Calcitonin receptor activity–modifying protein 2 1.28 0.0296 Facilitates effect of adrenomedullin
11 U18760 Nuclear transcription factor I/X 1.30 0.0192 CCAAT-binding transcription factor regulated by ADRA1 11 D50929 Eukaryotic translation initiation factor 3 1.55 0.0173 Translation regulator
11 AF049703 E74-like factor 5 1.48 0.0090 Transcription regulator
12 M14083 Plasminogen activator inhibitor type 1, member 1 þ 1.49 0.0098 Cell migration and tissue formation 12 AI743134 Plasminogen activator inhibitor type 1, member 2 þ 1.42 0.0308 Cell migration and tissue formation 12 X57766 Matrix metalloproteinase 11 (stromelysin 3) þ 1.08 0.0208 Cell migration and tissue formation 12 M23379 RAS p21 GTPase activator 1 þ 1.06 0.0240 Cell migration and tissue formation
12 X12451 Cathepsin L þ 2.49 0.0313 Cell migration and tissue formation
largest labor-associated change in expression and the lowest variability. The 500 genes with the lowest p-values were selected from fundus (Dataset S1), lower segment (Dataset S2), and cervix (Dataset S3). Of the 500 genes with the largest change in expression, 28 were common to both the fundus and lower segment. This finding suggests that a small core of genes is associated with labor in both the upper and lower segments of the uterus. Most changes in gene expression however, are not common, supporting the hypothesis of differential spatial regulation [12]. In both areas of the uterus, labor was associated with an overall reduction, rather than increase in gene expression. Expression was reduced in 71.4%, 72.4%, and 79.2% of the 500 genes after the onset of labor in the fundus, lower segment, and cervix, respec-tively.
Since many genes in reproductive tissues may be co-regulated or interdependent, we identified groups of genes with similar expression profiles. We placed the selected 500 genes into one of ten clusters. Two different techniques were used: K-means and hierarchical. The number of genes per cluster determined by K-means ranged between 31–83, 26–93, and 115–102 for fundus, lower segment, and cervix, respec-tively. The corresponding number of genes for each cluster by hierarchical clustering was 3–239, 3–181, and 2–333, respec-tively. To further refine the gene groups we determined those genes which were co-clustered using both techniques. Coincidence testing was done to determine the probability that each set of genes was co-clustered using both techniques by chance. Sets of genes with a probability of chance grouping less than 0.01 were analyzed further. These sets represented 71.2%, 81.8%, and 79.8% of the 500 genes in the fundus, lower segment, and cervix, respectively. Since genes grouped by one technique can also be grouped in any of the ten groups from the second technique, there are 100 possible co-clusters. We found only 14, 14, and 12 clusters in the fundus, lower segment, and cervix, respectively, suggesting that these co-clusters are likely to represent interdependent or co-regulated genes. Examples of genes clustered together by both techniques are shown in Tables 1–3. (Complete data
are available online and can be accessed at http://www.ebi.ac. uk/arrayexpress, accession number E-MEXP-106).
Examination of the data raises some interesting hypoth-eses. For example, in the lower segment, expression of the genes for the nuclear binding protein C/EBP, TNF receptor, alpha 1A–adrenergic receptor, phospholipase A2 (group IIA), and G protein–coupled receptor 18 have similar expression profiles. In the fundus, the expression of repressor of estrogen receptor activity (REA) is reduced, while prothymo-sin alpha remains unchanged with labor. The two genes constitute one of the reported regulatory pathways of estrogen receptor alpha (ERA) activity [13].
Numerous genes have been reported to change in expression dramatically in reproductive tissues at the onset of labor. Our results are consistent with these previous results and demonstrate in the lower segment a marked increase in expression of the genes for beta-adrenergic receptor kinase 2 [14], phospholipase A2 IIA [15], and calcium ion–transporting ATPase 2 [16]. Furthermore, there was a reduction in expression of regulator of G protein signaling 2 [17], calcitonin receptor activity–modifying protein 2 [18], and protein kinase C [19]. Nevertheless, some genes that would be expected to demonstrate a marked labor-associated increase, such as prostaglandin receptor EP 4 [20], were not selected by our technique, possibly due to a large inter-patient variability in expression. Since other genes’ expression patterns were consistent with prior findings, this variability may reflect gene polymorphism.
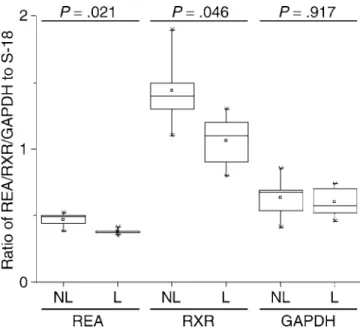
Expression changes of REA, retinoid X receptor alpha (RXR), and glyceraldehyde-3-phosphate dehydrogenase (GAPDH) in association with labor in the uterine fundus corresponded to the findings of microarray experiments. Both REA and RXR expressions decreased in labor, while expression of GAPDH remained unchanged (Figure 4).
Discussion
Our results demonstrate labor-associated changes in gene expression in three functionally important areas of the
Table 2.Continued
Cluster GenBank ID Gene Name Change Fold p Function
13 U58334 Tumor protein p53–binding protein, 2 1.42 0.0306 Cell apoptosis
13 AF001383 Bridging integrator 1 1.56 0.0038 Cell apoptosis
13 AF018253 Tumor necrosis factor receptor 11a 1.72 0.0228 Cell apoptosis
13 U83600 Tumor necrosis factor receptor 25 1.12 0.0202 Cell apoptosis
13 AI193606 Potassium channel K 3 2.57 0.0050 Decreases depolarization and excitation
13 U39196 Potassium inwardly rectifying channel J 3 1.22 0.0322 Increase of Kþefflux; shortening of action potential; activated by ADRA1A
13 D25235 Adrenergic alpha-1A receptor 2.22 0.0256 Activates KCNJ3
13 AJ224874 Voltage-gated calcium channel alpha 1F subunit 1.38 0.0301 Tonically active over large range of voltage 14 U60521 Caspase 9, apoptosis-related cysteine protease 3.14 0.0350 Cell apoptosis
14 M89470 Paired box gene 2 2.01 0.0229 Cell apoptosis
14 M22976 Cytochrome b-5 2.30 0.0047 Cell apoptosis
14 Y10659 Interleukin 13 receptor, alpha 1 2.46 0.0010 Regulated by IL4 and IL13
14 L41067 Nuclear transcription factor calcineurin-dependent 3 1.73 0.0213 Regulates IL4 and IL13
Cluster number identifies a coincidence cluster of genes grouped together by K-means and hierarchical clustering methods where probability of chance co-clustering wasp,0.01. The fold change is a ratio of the difference between labor and non-labor medians of gene expression to the non-labor median level of gene expression. The change sign indicates the direction of the expression change in the labor samples comparing to non-labor. Thep-value is given for the difference in gene expression in samples taken before and after labor. Gene function is derived from the database of gene functions and interactions Ingenuity Pathway Analysis and Biological Knowledge Database.
Table 3.Cervix: Selected Genes within Each of the Coincidence Clusters with Functions Similar to Other Genes within the Same Cluster or Functions Pertinent to the Process of Labor
Cluster GenBank ID Gene Name Change Fold p Function
1 L32976 Mitogen-activated protein kinase 11 1.89 0.0386 Cell apoptosis
1 U07418 DNA mismatch repair gene 1.95 0.0057 Cell apoptosis
1 X87843 Transcription regulator factor gene MNAT1 1.89 0.0412 Cell apoptosis
1 AF015950 Telomerase reverse transcriptase 1.48 0.0335 Cell growth; cell cycle progression 1 AF034780 Sphingolipid G protein–coupled receptor 5 1.50 0.0347 Cell growth; cell cycle progression 1 U82130 Tumor susceptibility gene 101-transcription
regulator gene
2.16 0.0491 Cell growth; cell cycle progression
1 AL049386 Transcription regulator gene Notch2 1.61 0.0069 Cell growth
1 M34423 Beta 1 galactosidase 1.45 0.0427 Lysosomal enzyme
1 X76488 Lipase A 1.91 0.0140 Lysosomal enzyme
1 AF046888 Tumor necrosis factor (TNF) 13 1.09 0.0413 Activates NFKB and cell apoptosis
1 U59863 TNF receptor–associated (TRAF) NFKB activator 1.70 0.0265 Increases IL-8 and TRAF2–mediated activation of NFKB 1 S74720 Orphan nuclear steroid hormone receptor B1 0.88 0.0465 Decreases activity of ERA and ERB
1 U51903 GTPase-activating protein 2 2.03 0.0070 Cross-linkage of actin filaments
2 AL022310 Tumor necrosis factor 4 þ 1.14 0.0220 Increases activation of NFKB
2 U48730 Signal transducer and activator of transcription 5B þ 1.41 0.0289 Transcription factor activated by TNF and other cytokines 2 M33684 Protein tyrosine phosphatase, non-receptor type 1 þ 1.41 0.0366 Signal transduction gene regulated by TNF
2 AA292277 Nuclear transcription co-activator 4 þ 1.41 0.0441 Inhibits expression of TNF and IL8; NFKB decreases its nuclear import
2 AI961040 Tubulin, gamma complex–associated protein 2 þ 2.10 0.0113 Protein binding to IL8 receptors A and B
2 M36653 POU domain 2 transcription factor 2 þ 1.64 0.0372 Increases activity of CCR5 chemokine receptor for IL8 2 X07109 Protein kinase C beta 1 þ 1.35 0.0077 Increases activity of NFKB and is activated by IL8 and TNF 3 D43945 Transcription factor EC þ 1.93 0.0407 GTP-binding translation initiating factor
3 L19161 Translation initiation factor 2, subunit 3 þ 2.12 0.0309 Transcription regulating factor
3 U78575 Phosphatidylinositol-4-phosphate 5-kinase alpha I þ 1.96 0.0354 Increases activity of EGFR, which stimulates interstitial collagenase MMP1
3 X90579 Cytochrome P450 IIIA, polypeptide 5 pseudogene 2 þ 2.16 0.0312 Metabolizes progesterone
4 L37042 Casein kinase 1, alpha 1 2.14 0.0375 Cell apoptosis
4 U59435 Proliferation-associated metallopeptidase 2G4 1.51 0.0420 Proteo and peptidolysis
5 M36803 Hemopexin 2.07 0.0273 Enhances TIMP inhibition of MMP degradation of
extracellular matrix
5 U33821 Tax1-binding protein 1 1.74 0.0324 Apoptosis inhibitor
5 M11186 Prepro-oxytocin (neurophysin I) 1.76 0.0018 Increases prostaglandin E2 synthesis
5 U07620 Mitogen-activated protein kinase 10 1.25 0.0053 Mediates cytokine-induced prostaglandin synthesis 6 M18079 Fatty acid–binding protein 2, intestinal 1.23 0.0254 Increases fat oxidation and insulin resistance; is inhibited
by collagen
6 D31766 Glucosamine-6-phosphate isomerase 1.72 0.0326 Energy pathway
6 X13916 Low-density lipoprotein-related protein 1 1.80 0.0121 Mediates catabolism of MMP-9
7 X65293 Protein kinase C, epsilon 1.35 0.0033 Activates NFKB and cell apoptosis
7 AF053977 Anaphase-promoting complex protein member gene 1.50 0.0384 Decreases cell proliferation
8 X72308 Chemokine ligand 7 þ 1.31 0.0240 Chemotaxis of monocytes and leukocytes
8 U03905 Chemokine receptor 2 þ 1.14 0.0217 Receptor for CCL7; chemotaxis of monocytes and
leukocytes 8 X80343 Cyclin-dependent protein kinase 5 activator—
regulatory subunit
þ 1.14 0.0489 Cell growth and differentiation
8 W28588 Neurofilament light polypeptide þ 1.57 0.0273 Cell growth and differentiation
8 L41827 Neuregulin 1 þ 1.16 0.0268 Cell growth and differentiation
8 X07024 TAF1 RNA polymerase II transcription co-activator þ 2.13 0.0426 Cell growth
8 M25269 ELK1 transcription regulator þ 1.62 0.0121 Cell growth
8 U94902 Transmembrane receptor–binding collagen and hyaluronic acid
þ 2.03 0.0387 Cell growth and proliferation of connective tissue cells
8 M69136 Mast cell’s chymase 1 þ 2.00 0.0291 Peptidase degrading extracellular matrix
8 AC002366 Amelogenin þ 1.37 0.0036 Extracellular matrix glycoprotein
8 M31153 Cytochrome P450 XVII—steroid 17-alpha-hydroxylase þ 1.73 0.0486 Key enzyme in steroidogenesis of estrogens and androgens 9 U69108 TNF receptor–associated factor 5 þ 0.95 0.0372 Mediates TNF-induced NFKB activation and protection
from cell death
9 U40705 Telomeric repeat binding factor 1 þ 1.68 0.0198 Induces mitotic entry and apoptosis 10 X84709 Adaptor protein for TNF receptors—FAS associated 4.68 0.0419 Apoptosis of fibroblasts
10 X91648 Purine-rich element binding protein A 1.29 0.0108 Apoptosis of fibroblasts
10 M29870 Rho small GTP binding protein Rac1 2.18 0.0094 Apoptosis of fibroblasts; regulates various MAPK 10 U07620 Mitogen-activated protein kinase 10 2.26 0.0474 Cell death and apoptosis
10 U33052 Protein kinase C–like 2 1.98 0.0112 Cell death and apoptosis regulated by rho proteins 10 Z75311 Single-stranded specific endoDNAase RAD50 1.27 0.0116 Cell death and apoptosis
10 AL046322 Karyopherin alpha 6 1.56 0.0374 Cell apoptosis
10 Y12670 Leptin receptor 1.57 0.0498 Cell apoptosis
human uterus. The primary objective of this study was to identify novel-to-labor genes important for the process of parturition. The second main objective was to identify groups of genes with similar expression profiles in order to recognize those with common regulatory mechanisms. Rather than providing a list of genes, this results provides a map of gene interactions in labor. We postulated that the onset of labor is likely to be caused by a reduction in inhibitory and an increase in stimulatory processes, and our data support this theory; for example, we demonstrated that in the lower segment in labor expression of genes for the stimulatory tumor necrosis factor receptor is increased, whereas that of the relaxatory potassium channel is reduced.
The study was specifically designed to investigate gene expression in human labor because the mechanisms of labor vary between species. Previous gene array studies have documented changes in expression in a rodent model [21,22]. Such animal models are useful since variability is reduced because of the animals’ similar genotypes and exposure to a controlled environment. Expression data from such studies can be compared and contrasted with those from human tissue, thus providing an insight into the similarities and differences between species. However, we consider that data from human studies are the most important for understanding human physiology.
Previous human gene array data [22,23], has marked differences in methodology from our study. Bethin and colleagues [22] determined the expression profile in human extracts obtained either preterm, prior to labor or preterm, and at term following the onset of labor. In contrast, we designed our study to specifically determine labor-associated alterations and to exclude the marked changes in expression at the end of pregnancy. A further difference in our study was that we analyzed human uterine samples from all three functionally distinct areas of the uterus in the same women. It is the cooperation of these components of the uterus (contraction of the fundus, relaxation of the lower segment, and dilation of the cervix) that result in the process of labor. Our study also differed in that the method of analysis and sample size enabled the individual variation between women to be taken into account—i.e., to preserve these
character-istics samples were not pooled. This individual analysis enabled the expression of each gene to be identified in each sample. The genes were then grouped into clusters based on their similarity of expression across individual samples. This similarity of genes’ expressions in different samples dramat-ically increases the power of the cluster analysis and is possible only because the individual sample characteristics are maintained. However, one limitation of an individual analysis is that individual variation in expression in human tissue is likely to be high, not only because there are marked genetic and environmental effects but also because the time to the onset of spontaneous labor in non-labor samples is not known.
Aguan and colleagues utilized a different experimental design and methodology to investigate gene expression in the lower uterine segment before and after the onset of labor [23]. The type of array, number of investigated genes (588), and normalization procedures make valid comparison with our study difficult. The studies differ also in how the fold change in the gene expression calculation was done. How-ever, there are several consistent changes in gene expression. For example, we demonstrated a 91% decrease in G protein– coupled receptor 161 in lower-segment samples, which is consistent with the 84% reduction reported by Aguan et al. We also demonstrated consistent changes in guanine nucleo-tide binding protein alpha expression.
Chan and colleagues [24] studied uterine samples in labor using a subtractive hybridization technique. Although this study used a different technique from ours, and the number of genes upregulated in labor was small, their findings have shown a consistent with our results, significant increase in the expression of interleukin-8.
Gene array data provide a wealth of information, which presents unique analytical challenges. We determined ex-pression in six samples taken before and seven after the onset of labor at term. In order to compare the differences in samples taken before and after labor, the t-test for the difference in expression was performed and thep-value was calculated. The genes were ranked according to this value, not to determine significance, which would be inappropriate for this number of comparisons, but to determine genes that
Table 3.Continued
Cluster GenBank ID Gene Name Change Fold p Function
11 Z46606 Matrix-associated, actin-dependent regulator of chromatin a3
1.93 0.0233 Transcription regulator that binds CA4, which in turn binds SURB7, known to bind CREBBP
12 U65093 Cbp/p300-interacting transactivator 2 2.42 0.0514 Transcription regulator binding CREBBP 12 U30246 Solute carrier 12 - sodium/potassium/chloride
transporter 2
2.51 0.0496 Expression increased by MYOD1 regulated by CREBBP
12 X75252 Prostatic binding protein 1.59 0.0316 Decreases activity of chymotrypsin; binds RAF1 regulating TP53, also regulated by CREBBP
12 U35139 Necdin 1.59 0.0287 Binds CREBBP; colony formation of mast, connective tissue,
and blood cells
12 AB006909 Microphthalmia-associated transcription factor 1.42 0.0502 Colony formation of mast, connective tissue, and blood cells 12 AB028972 Colony-stimulating factor 2 receptor alpha 2.31 0.0231 Colony formation of mast, connective tissue, and blood cells
Cluster number identifies a coincidence cluster of genes grouped together by K-means and hierarchical clustering methods where probability of chance co-clustering wasp,0.01. The fold change is a ratio of the difference between labor and non-labor medians of gene expression to the non-labor median level of gene expression. The change sign indicates the direction of the expression change in the labor samples comparing to non-labor. Thep-value is given for the difference in gene expression in samples taken before and after labor. Gene function is derived from the database of gene functions and interactions Ingenuity Pathway Analysis and Biological Knowledge Database.
demonstrated the greatest and most consistent change in labor. We did not correct for multiple comparisons since the expression of the different genes is not independently regulated. This method of analysis is likely to provide more consistent data than techniques using fewer samples, dupli-cate arrays on the same samples, or identification of an arbitrary change in expression [21,22]. By this method, any difference in expression during labor of those genes with the smallestp-values is unlikely to have arisen by chance due to observer and instrument variability. Hence, the genes with the most consistent change in expression during labor are most likely to have an important function, although current methodology does not allow primary changes in expression to be distinguished from those secondary to increased contrac-tility.
Although we cannot exclude false positives and negatives, the lower thep-value the smaller the probability of a false positive results. However, as the number of genes selected increases, so does the chance of inclusion of a false positive result, while the chance of a false negative one decreases. False negative results may also occur due to wide patient variability. There are many potential causes of inter-patient variability. Particularly important is that it cannot be determined in non-laboring patients when parturition would otherwise commence—that is, how close to the onset of labor a non-laboring patient is.
It is likely that many changes in gene expression precede the clinical signs of labor: for example, the steroid hormones estrogen and progesterone are fundamentally important for the maintenance of pregnancy and the onset of labor [4,7]. In some species, such as the sheep, pregnancy is maintained by progesterone and labor is caused by a dramatic fall in progesterone. The decrease in progesterone concentration increases the estrogen/progesterone ratio leading to
contrac-tions [25]. A fall in plasma progesterone has not been demonstrated in women, although administration of anti-progestins can induce labor [26]. This suggests that the mechanism may be slightly different in women.
Our demonstration of a fall in the expression of a modulator of estrogen receptor activity provides a mecha-nism whereby the functional estrogen/progesterone ratio could be increased without a change in plasma concentration of either. REA is a protein that competitively and selectively binds to the nuclear receptor reducing its function [13]. Although identified in breast cancer and placental cells, this modulator has not been described in the human myome-trium. REA and RXR (which also inhibits estrogen activity) were both clustered into one group based on their decreased expression pattern in labor. The expression of prothymosin alpha (an antagonist of REA) is unchanged in labor and further supports this hypothesis. Jointly, they demonstrate existence of a pathway that may represent a novel mechanism of uterine control [13].
During labor there are concomitant physiological changes in the fundus, lower uterine segment, and cervix. The fundus generates coordinated forceful uterine contractions while the contractile lower segment elongates over the presenting part. The cervix undergoes softening in late pregnancy with a dramatic shortening and dilation during labor. Our data demonstrate related marked spatial differences in gene expression, consistent with previous publications using alternative techniques for quantification [12]. Some of these differences in gene expression may, however, be due to cell type. We have previously demonstrated that more than 98% of cells in our lower segment biopsies are myometrial [8], and fundal samples were taken from the peritoneal (outer) surface to prevent decidual contamination. It is therefore unlikely that changes in gene expression in the fundus and lower segment were derived from non-myometrial cells. In contrast, the cellular composition of the cervix is more heterogeneous, and expression within the different cell types cannot be discerned. Nevertheless, we considered that maintenance of the physiological cellular environment was more important than a homogenous cell population.
Oxytocin and prostaglandins are known to have a fundamental role in human parturition [6]. Our gene array data are consistent with existing evidence on these oxytocics. Oxytocin is produced by the choriodecidua during human labor [8] and acts on myometrial oxytocin receptors to cause contraction. Since oxytocin is not produced in the myome-trium but in other gestational tissues, it is reassuring that there was no increase in myometrial expression of oxytocin in our study. The increase in myometrial oxytocin receptor formation precedes the onset of labor, and uterine expres-sion increases from mid-pregnancy to term rather than at the onset of labor [27]. Consistent with these data, we did not demonstrate an increase in oxytocin expression in labor. In contrast, we have previously demonstrated that expression of myometrial secretory phospholipase A2 is increased in samples taken after the onset of labor [15]. This enzyme catalyzes mobilization of arachidonic acid from membrane phospholipids for the synthesis of prostaglandins. Our gene array results confirm an increase in secretory phospholipase A2 expression in myometrial samples taken after the onset of labor and are consistent with a regulatory role for prosta-glandins
Figure 4.Validation of the Microarray Findings by RT-PCR
There is no generally accepted statistical method to analyze differences in gene expressions between groups, due to correlation of expressions of individual genes. To validate our findings, we confirmed expression of genes with different technique and demonstrated functional relationship of co-expressed genes. We validated a proportion of our micro-array findings by RT-PCR, and we were reassured that the results using both techniques were consistent among all tested genes. We also analyzed the patterns of expression by two techniques: K-means and hierarchical clustering. Although these techniques may not be completely independ-ent, the method of gene clustering is different and hence the combination provides additional confidence for the identi-fication of networks of co-regulated genes. Prior studies have shown that co-expressed genes have been demonstrated to be functionally related and to participate in common biological processes defined by the Gene Ontology database. These relationships are identified across species and functional categories [28–31]. The identification within each cluster of genes with similar functions pertinent to labor strengthens our hypothesis that these genes are co-regulated. It is likely that expression of a particular gene can regulate expression of a second, which may itself influence a third. In this way, a single controlling mechanism may induce a multitude of phenotypic alterations leading to a change in function. Furthermore, transcription regulating factors (such as CAAT enhancer binding protein, CEBP, which is increased after labor in the lower segment) may promote transcription for numerous contraction-associated genes. Indeed, CEBP bind-ing to the oxytocin receptor promoter has recently been demonstrated [32]. We anticipate that elucidating the net-works of genes associated with labor will enable a more holistic understanding of the process, leading to more rational methods for manipulating uterine contraction.
In summary, we have demonstrated consistent changes in gene expression in the human lower segment, fundus, and cervix in association with labor. A number of novel-to-labor genes have been identified in addition to networks of co-expressed genes. There are marked tissue and spatial differ-ences in gene expression in the uterus during parturition.
Supporting Information
Dataset S1.Cervix: Selected Genes
Found at DOI: 10.1371/journal.pmed.0030169.sd001 (565 KB XLS).
Dataset S2.Fundus: Selected Genes
Found at DOI: 10.1371/journal.pmed.0030169.sd002 (558 KB XLS).
Dataset S3.Lower Segment: Selected
Found at DOI: 10.1371/journal.pmed.0030169.sd003 (574 KB XLS).
Accession Numbers
The GenBank (http://www.ncbi.nlm.nih.gov/Genbank) accession num-bers for the genes and gene products discussed in this paper are: alpha 1D–adrenergic receptor (M76446), beta-adrenergic receptor kinase 2 (AL022329), CEBP (M83667), calcitonin receptor activity– modifying protein 2 (AJ001015), calcium ion–transporting ATPase 2 (X63575), G protein–coupled receptor 161 (AI703188), G protein– coupled receptor 18 (L42324), GAPDH (U34995), guanine nucleotide-binding protein alpha (AC002077), interleukin-8 (M28130), oxytocin (NM_000915), phospholipase A2 IIA (M22430), prostaglandin re-ceptor EP 4 (L28175), protein kinase C beta1(X07109), prothymosin alpha (M26708), REA (U72511), regulator of G protein signaling 2 (L13463), RXR (X52773), and tumor necrosis factor receptor (X60592).
Acknowledgments
Author contributions.RB, GDVH, GRS, GDA, and ST designed the study. RB analyzed the data. RB, GDVH, GRS, GDA, and ST enrolled patients. RB, GDVH, GRS, GDA and ST contributed to writing the
paper. &
References
1. Lorenz JM, Wooliever DE, Jetton JR, Paneth N (1998) A quantitative review of mortality and developmental disability in extremely premature new-borns. Arch Pediatr Adolesc Med 152: 425–435.
2. Thomas J, Callwood A, Brocklehurst P, Walker J (2000) The National Sentinel Caesarean Section Audit. BJOG 107: 579–580.
3. Bonnar J (2000) Massive obstetric haemorrhage. Baillieres Best Pract Res Clin Obstet Gynaecol 14: 1–18.
4. Challis JRG, Matthews SG, Gibb W, Lye SJ (2000) Endocrine and paracrine regulation of birth at term and preterm. Endocr Rev 21: 514–550. 5. Challis JR (1997) Prostaglandins and reproduction—What do knockouts
really tell us? Nat Med 3: 1326–1327.
6. Norwitz ER, Robinson JN, Challis JR (1999) The control of labor. N Engl J Med 341: 660–666.
7. Nathanielsz PW, Jenkins SL, Tame JD, Winter JA, Guller S, Giussani DA (1998) Local paracrine effects of estradiol are central to parturition in the rhesus monkey. Nat Med 4: 456–459.
8. Blanks AM, Vatish M, Allen MJ, Ladds G, de Wit NC, Slater DM, Thornton S (2003) Paracrine oxytocin and estradiol demonstrate a spatial increase in human intrauterine tissues with labor. J Clin Endocrinol Metab 88: 3392– 3400.
9. Tavazoie S, Hughes JD, Campbell MJ, Cho RJ, Church GM (1999) Systematic determination of genetic network architecture. Nat Genet 22: 281–285. 10. Gottwald E, Muller O, Polten A (2001) Semiquantitative reverse
tran-scription-polymerase chain reaction with the Agilent 2100 Bioanalyzer. Electrophoresis 22: 4016–4022.
11. Panaro NJ, Yuen PK, Sakazume T, Fortina P, Kricka LJ, Wilding P (2000) Evaluation of DNA fragment sizing and quantification by the agilent 2100 bioanalyzer. Clin Chem 46: 1851–1853.
12. Sparey C, Robson SC, Bailey J, Lyall F, Europe-Finner GN (1999) The differential expression of myometrial connexin-43, cyclooxygenase-1 and -2, and Gs alpha proteins in the upper and lower segments of the human uterus during pregnancy and labor. J Clin Endocrinol Metab 84: 1705–1710. 13. Montano MM, Ekena K, Delage-Mourroux R, Chang W, Martini P, Katzenellenbogen BS (1999) An estrogen receptor-selective coregulator that potentiates the effectiveness of antiestrogens and represses the activity of estrogens. Proc Natl Acad Sci U S A 96: 6947–6952.
14. Brenninkmeijer CB, Price SA, Lopez BA, Phaneuf S (1999) Expression of G-protein-coupled receptor kinases in pregnant term and non-pregnant human myometrium. J Endocrinol 162: 401–408.
15. Slater DM, Miles L, Sykes AL, Poston L, Bennett PR (2000) Expression of secretory and cytosolic phospholipase A2 in human myometrium: Changes in relation to gestational age and labour. J Soc Gynecol Investig 7: 129. 16. Tribe RM, Moriarty P, Poston L (2000) Calcium homeostatic pathways
change with gestation in human myometrium. Biol Reprod 63: 748–755. 17. Suarez VR, Park ES, Hankins GD, Soloff MS (2003) Expression of regulator
of G protein signaling-2 in rat myometrium during pregnancy and parturition. Am J Obstet Gynecol 188: 973–977.
18. Thota C, Gangula PR, Dong YL, Yallampalli C (2003) Changes in the expression of calcitonin receptor-like receptor, receptor activity-modify-ing protein (RAMP) 1, RAMP2, and RAMP3 in rat uterus duractivity-modify-ing pregnancy, labor, and by steroid hormone treatments. Biol Reprod 69: 1432–1437. 19. Phillippe M (1994) Protein kinase C, an inhibitor of oxytocin-stimulated
phasic myometrial contractions. Biol Reprod 50: 855–859.
20. Teoh TG, Chen ZQ, Qi SL, Lye SJ (1997) Paradoxical expression of inhibitory and stimulatory prostanoid receptors in the human myome-trium during labor. J Soc Gynecol Investig 4: 565.
21. Girotti M, Zingg HH (2003) Gene expression profiling of rat uterus at different stages of parturition. Endocrinology 144: 2254–2265.
22. Bethin KE, Nagai Y, Sladek R, Asada M, Sadovsky Y, Hudson TJ, Muglia LJ (2003) Microarray analysis of uterine gene expression in mouse and human pregnancy. Mol Endocrinol 17: 1454–1469.
23. Aguan K, Carvajal JA, Thompson LP, Weiner CP (2000) Application of a functional genomics approach to identify differentially expressed genes in human myometrium during pregnancy and labour. Mol Hum Reprod 6: 1141–1145.
24. Chan EC, Fraser S, Yin S, Yeo G, Kwek K, Fairclough RJ, Smith R (2002) Human myometrial genes are differentially expressed in labor: A suppression subtractive hybridization study. J Clin Endocrinol Metab 87: 2435–2441.
25. Nathanielsz PW (1978) Parturition in rodents. Semin Perinatol 2: 223–234. 26. Elliott CL, Brennand JE, Calder AA (1998) The effects of mifepristone on cervical ripening and labor induction in primigravidae. Obstet Gynecol 92: 804–809.
tissues prior to and following the onset of labour. J Endocrinol 161: 143– 151.
28. Stuart JM, Segal E, Koller D, Kim SK (2003) A gene-coexpression network for global discovery of conserved genetic modules. Science 302: 249–255. 29. Griffith OL, Pleasance ED, Fulton DL, Oveisi M, Ester M, Siddiqui AS, Jones
SJ (2005) Assessment and integration of publicly available SAGE, cDNA microarray, and oligonucleotide microarray expression data for global coexpression analyses. Genomics 86: 476–488.
30. Wolfe CJ, Kohane IS, Butte AJ (2005) Systematic survey reveals general applicability of‘‘guilt-by-association’’within gene coexpression networks. BMC Bioinformatics 6: 227.
31. Lee HK, Hsu AK, Sajdak J, Qin J, Pavlidis P (2004) Coexpression analysis of human genes across many microarray data sets. Genome Res 14: 1085–1094. 32. Schmid B, Wong S, Mitchell BF (2001) Transcriptional regulation of oxytocin receptor by interleukin-1beta and interleukin-6. Endocrinology 142: 1380–1385.
Editors’ Summary
Background. Childbirth, or labor, although a basic event in life, is actually a complex process that involves three parts of the uterus (womb) working together to expel the baby. One particularly important part of the process, which is poorly understood, is how labor begins. The actual changes that occur in the uterus once labor has begun are well known, and include contractions in the muscle of the uterus wall (the myometrium) and dilation of the cervix (the neck of the womb). Some of the triggers for these changes are also known: for example, in non-primate animals changes in the blood levels of the hormones estrogen and progesterone and changes in the membranes that surround the fetus. Previous studies have suggested that these effects are likely, in turn, to be triggered by changes in many genes, but exactly which ones is not clear.
Why Was This Study Done? Learning more about which genes are important in the various stages of labor may help to design treatments for the various problems that occur in labor (such as failure of labor to begin, or, alternatively, preterm labor). Little is known about the genes that trigger, or are necessary for, labor to start and to continue in a coordinated fashion. A technology known as DNA microarrays allows researchers to take a sample from any part of the body and use it to look at how active many thousands of genes are, all at the same time. By analyzing these results, it is possible to suggest either single genes or groups of genes that may be important in a particular process.
What Did the Researchers Do and Find?The authors took samples from the uterus top, lower part, and cervix of six women before their labor started, and seven from those whose labor had started. All women were having cesarean sections either for medically indicated reasons, or for choice. Then, in each of the samples in each woman, they looked at 12,626 known genes to see how active they were (scientists call these active genes ‘‘expressed’’). They found that the changes in gene expression were not, generally, the same across the three parts of the uterus. Of the 500 genes with the largest change in expression, 28 were common to both the upper and lower parts of the uterus, and this small group of genes may be important in labor in both the upper and lower parts of the uterus. The authors also classified the 500 genes into related groups, and they believe that these relationships may be important in controlling how labor happens.
What Do These Findings Mean?Identifying new genes or groups of genes involved in labor is important for understanding how labor occurs. One limitation of this study is the small number of women who were studied—which is understandable, given the difficulty of obtaining such samples—and the differences between the women studied. Another difficulty with such studies is that the methods used to analyze the expression patterns can affect the results. However, as is the custom with these types of studies, all the results were placed in a public database so anyone can look at them and, if they wish, do further analyses. In a related Perspective article that was commissioned to comment on this paper, Roberto Romero, one of the original reviewers of the paper, has done just that. He finds that there were differences in the results of his analyses and those of the authors’. He goes on to discuss the question of how hard it is to use these techniques to look at complex problems, such as how labor starts. Clearly, much more work needs to be done before it is clear what all these results really mean. Nonetheless, these studies have the potential to help to understand more about the basic science behind labor.
Additional Information.Please access these Web sites via the online version of this summary at http://dx.doi.org/10.1371/journal.pmed. 0030169.