453
AbstractObjective: To describe the health care service provided in pediatric intensive care units in the city of São Paulo, by identifying and describing the units and analyzing their geographic distribution.
Methods: A descriptive cross-sectional study was carried out during a two-year period (August 2000 to July 2002). Data were collected through questionnaires answered by medical directors of each pediatric and neonatal intensive care unit.
Results: São Paulo is served by 107 pediatric and neonatal intensive care units, of which 85 (79.4%) completed and returned the questionnaire. We found a very unequal distribution of units as there were more units in places with the least pediatric population. Regarding to pediatric intensive care units specialization, 7% were pediatric, 41.2% were neonatal and 51.7% were mixed (pediatric and neonatal). Regarding hospital funds, 15.3% were associated with philanthropic institutions, 37.6% were private and 47% were public. A total of 1,067 beds were identified, of which 969 were active. The ratio bed/patient aged 0-14 was 1/2,728, varying from 1/604 at health districts - I to 1/6,812 at health districts - III. The units reported an average of 11.7 beds (2 to 60). The neonatal intensive care unit had a median of 16.9 beds per unit and pediatric intensive care units a median of 8.5 beds/unit.
Conclusion: In São Paulo, we found an uneven distribution of pediatric and neonatal intensive care units among the health districts. There was also an uneven distribution between public and private units, and neonatal and pediatric ones. The current report is the first step in the effort to improve the quality of medical assistance in pediatric and neonatal intensive care units in São Paulo.
J Pediatr (Rio J). 2004;80(6):453-60: Evaluation, services structure, pediatric intensive care unit, neonatal intensive care unit, questionnaires.
Availability of pediatric and neonatal
intensive care units in the city of São Paulo
Daniela C. de Souza,1 Eduardo J. Troster,2 Werther Brunow de Carvalho,3 Shieh H. Shin,4 Andréa M. G. Cordeiro5
Copyright © 2004 by Sociedade Brasileira de Pediatria
O
RIGINALA
RTICLE1. M.Sc., School of Medicine, Universidade de São Paulo (USP), São Paulo, SP, Brazil.
2. Ph.D., School of Medicine, USP, São Paulo, SP, Brazil.
3. Adjunct professor, associate professorship, Department of Pediatrics, Universidade Federal de São Paulo (UNIFESP), São Paulo, SP, Brazil. 4. Assistant physician, Pediatric Intensive Care Unit, Hospital Universitário,
USP, São Paulo, SP, Brazil.
5. M.Sc., School of Medicine, USP, São Paulo, SP, Brazil.
* This study is based on the first author’s dissertation. The data presented in this article are part of the dissertation presented at the School of Medicine of Universidade de São Paulo for the Master of Science Degree in September 2003: Souza DC. Avaliação da estrutura das unidades de terapia intensiva pediátrica e neonatal do município de São Paulo.
Manuscript received Apr 22 2004, accepted for publication Sep 08 2004.
Suggested citation: de Souza DC, Troster EJ, de Carvalho WB, Shin SH, Cordeiro AMG. Availability of pediatric and neonatal intensive care units in the city of São Paulo. J Pediatr (Rio J). 2004;80:453-60.
Introduction
Pediatric intensive care is a relatively recent medical specialty, having been consolidated around 50 years ago, after the poliomyelitis in Scandinavia. In Brazil, the first
pediatric intensive care units (PICUs) were opened during the seventies at the Hospital dos Servidores do Estado do Rio de Janeiro in 1971 and at the Universidade de São Paulo in 1974. Even during the sixties there was a Pediatric Intensive Care Room at the Professor Pedro de Alcântara Childrens Institute, part of the Hospital das Clínicas, belonging to the Medical Faculty of the Universidade de São Paulo (HC-FMUSP). This was annexed to the Emergency Room of the Instituto Central do Hospital das Clínicas and there the most critically ill children were cared for by the doctors, pediatricians from a number of different subspecialties, with no specific training in intensive care. In 1974, the PICU was born at HC-FMUSP and pediatricians trained in intensive care were integrated with the Pediatric Intensive Care Room team.
In the light of these circumstances we designed the present study which aims to characterize the care provided in pediatric and neonatal intensive treatment in the city of São Paulo. Specifically, this equates to identifying working units, verifying the geographic distribution of the units found and comparing the numbers of operational beds with the needs of the relevant populations, or, to put it another way, evaluate the equity, access and adequacy of intensive care provision in São Paulo city.
Methods
This was a cross-sectional, descriptive study in which the PICUs and neonatal intensive care units (NICUs) of São Paulo city were studied during the period from August 2000 to July 2002. The units were identified by searching the records of the Brazilian Association of Intensive Medicine (Associação de Medicina Intensiva Brasileira - AMIB), the São Paulo State Regional Medical Council (Conselho Regional de Medicina - CREMESP), the São Paulo State Health Department (Secretaria Estadual de Saúde - SES/SP) and the São Paulo City Health Department (Secretaria Municipal de Saúde - SMS/SP). To complete this census a systematic consultation was made of the 2002 São Paulo business telephone directory, in which subscribers are indexed according to the trading name given when the service contract was first signed and the accuracy of which is the responsibility of the directorys publisher.
Units that had been closed or were temporarily inactive during the study period were excluded as were units opened after January 2001.
After contact had been made with the PICUs/NICUs by telephone, questionnaires relating to the intensive care units infrastructure were delivered to a member of the ICU team, preferably the medical director or head nurse, and a time limit of 30 days was set for their return.
The answers provided by each ICU and their respective parent institutions were represented exclusively in aggregated forms and anonymity was therefore preserved throughout the project with data presentation and analysis being characterized by alphabetical order.
Data was described by means of proportions and averages for the statistical analysis. When information was stratified by source of funding and age group treated, we applied the chi-square test to compare proportions.
The research protocol was submitted to the Ethics Commission for Research Project Analysis at the HC-FMUSP, which approved it.
Results
One hundred and nine PICUs and NICUs were listed at 80 different hospitals in São Paulo city. Thirty-four (31.2%) were identified by the AMIB, whose list was taken as the starting point because it was the most up-to-date at the beginning of the study. After filtering out duplicates, a further nine (8.3%) were identified at the CREMESP, eight (7.3%) more were listed by the SES/SP, 11 (10.1%) were
on the books of SMS/SP and 47 (43.1%) were found by consulting the 2002 business telephone directory.
Two units were excluded. One hundred and seven were invited to participate in the study by voluntarily filling-out the questionnaire. Eighty-five (79.4%) ICUs returned the questionnaire and these constituted the study population.
The ICUs characteristics, in terms of participation, geographic location, age group and source of funding are shown in Table 1.
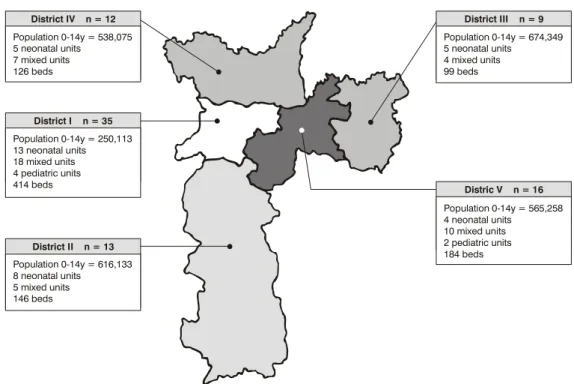
Assessing the geographic distribution of the PICUs/ NICUs across the five Regional Health Nuclei (RHN) into which São Paulo city is divided,1 it was observed that RHN-I and V, the most central of the nuclei, had the lowest pediatric populations in São Paulo city, and yet, these were also the RHN with the greatest numbers of ICUs. Regional Health Nucleus III, the most populous in the city and also the nucleus with the largest pediatric population had the lowest number of ICUs (Figure 1).
At the time of the study, the city of São Paulo had a pediatric population (0 14 years) of 2,643,928,2 working out to one bed in intensive care for every 2,728 children. Overall these beds were unevenly distributed across the five regions, varying from one bed/604 to one bed/6,812 pediatric patients, in RHN-I and RHN-III, respectively (Table 2).
With respect of the age groups, 44 (51.7%) units treated mixed populations, 35 (41.2%) cared for neonates and six (7%) treated pediatric patients exclusively (Figure 2). With respect of source of funding, 40 (47.1%) units were within public hospitals and 32 (37.6%) in private hospitals. The remaining 13 (15.3%) were in philanthropically maintained hospitals (charity hospitals hereafter). Fifteen (37.5%) of the 40 public units were run by the State, 16 (40%) by the city and nine (22.5%) were part of public universities. It was observed that neonatal and exclusively pediatric units predominated in the public sector, while mixed units predominated at the private services (Figures 3 and 4).
The majority of the 85 ICUs assessed were located within general hospitals (82.4%). The remaining ICUs were distributed as follows: eight (9.4%) in pediatric hospitals, five (5.9%) in maternity hospitals and two (2.4%) in hospitals for both women and children. With respect of the size of the parent hospitals, it was observed that more than half (67.1%) of the ICUS were located within large or special sized hospitals (more than 151 beds). Around a quarter (26.9%) were located in medium-sized hospitals (51-150 beds) and a small proportion (6%) were within small-scale hospitals (50 beds or less).
Two of the 85 units did not provide information either on the number of beds planned nor on the number that were operational. Taken together, the 83 units that did provide this information had 1067 ICU/NICU beds (installed capacity). There were 104 inactive PICU/NICU beds (9.7%). One of the units had six more active beds than the number planned for and so the total number of operational beds in the city of São Paulo was 969.
Participant Nonparticipant Total
n (%) n (%)
Information source
AMIB 30 4 34
SMS 7 2 11
CRM 7 2 9
SES 7 1 8
Other 34 13 47
Geographical location
RHN-I 35 (77.8) 10 (22.2) 45 (100)
RHN-II 13 (72.2) 5 (27.8) 18 (100)
RHN-III 9 (90.0) 1 (10.0) 10 (100)
RHN-IV 12 (92.3) 1 ( 7.7) 13 (100)
RHN-V 16 (76.2) 5 (23.8) 21 (100)
Age group cared for, n (%)
Pediatric * 50 (83.3) 10 (16.7) 60 (100)
Neonatal 35 (74.5) 12 (25.5) 47 (100)
Source of funding, n (%) §
Public 40 (87.0) 6 (13.0) 46 (100)
Private 32 (69.6) 14 (30.4) 46 (100)
Philantropic 13 (86.7) 2 (13.3) 15 (100)
Total 85 (79.4) 22 (20.6) 107 (100)
Table 1 - Characteristics of the intensive care units participating and not participating in the study
n = number; AMIB = Brazilian Association of Intensive Medicine; SMS = São Paulo City Health Department; CRM = São Paulo State Regional Medical Council; SES = São Paulo State Health Department; NRS = Regional Health Nucleus.
* Mixed, exclusive and specialized intensive care units. † Two units excluded.
‡ p value (0.38) for participant and nonparticipant units regarding the age group cared for (pediatric or neonatal). § p value (0.09) for participant and nonparticipant units regarding the source of funding (public or private).
Table 2 - Distribution of PICU/NICU beds in the city of São Paulo according to the pediatric age group or RHN
PICU = pediatric intensive care unit; NICU = neonatal intensive care unit; RHN = Regional Health Nucleus; ICU = intensive care unit.
* Estimate of the population of São Paulo city on July 1st 1998.25 † Ratio bed/pediatric population including nonparticipant intesive care
units.
RHN Pediatric ICU Ratio Ratio population beds bed/ bed/ (0-14 years)* pediatric pediatric
population population
I 250,113 414 1/604 1/471
II 616,133 146 1/4,220 1/3,020
III 674,349 99 1/6,812 1/6,075
IV 538,075 126 1/4,270 1/3,899
V 565,258 184 1/3,072 1/2,335
Total 2,643,928 969 1/2,728 1/2,156
(35.6%) were in private hospitals and 167 (17.2%) were in charity hospitals. It is worth pointing out that these proportions are in line with those calculated for installed
capacity. A statistically significant difference was observed in the proportion of operational beds in relation to the source of funding (p < 0.001) (Table 3). The 969 beds were divided by age group into 556 neonatal beds (57.4%), 371 (38.3%) mixed age group beds and 42 (4.3%) exclusively pediatric beds.
The number of operational beds per unit varied from 2 to 60, with a mean of 11.7 and a median of 10. The neonatal units had a mean of 16.9 beds each (median of 16) and the mixed pediatric units had a mean of 8.5 (median of 7.5). The exclusively pediatric ICUs had a mean of seven beds each (median also 7).
Figure 1 - Geographic distribution of the PICUs/NICUs across the five Regional Health Nuclei into which São Paulo city is divided according to age group (n = 85)
District III n = 9
Distric V n = 16 Population 0-14y = 674,349 5 neonatal units
4 mixed units 99 beds
Population 0-14y = 565,258 4 neonatal units
10 mixed units 2 pediatric units 184 beds District IV n = 12
District I n = 35
District II n = 13 Population 0-14y = 538,075 5 neonatal units
7 mixed units 126 beds
Population 0-14y = 250,113 13 neonatal units 18 mixed units 4 pediatric units 414 beds
Population 0-14y = 616,133 8 neonatal units
5 mixed units 146 beds
Table 3 - Number of beds of intesive care units in relation to the source of funding in the city of São Paulo and the proportion of operational beds
* p < 0.001
Public Private Philanthropic Total
n (%) n (%) n (%) n (%)
Installed capacity 529 (49.6) 364 (34.1) 174 (16.3 ) 1,067 (100)
Operational beds by source of funding 457 (47.2) 345 (35.6) 167 (17.2) 969 (100)
Operational beds by installed capacity * 457/529 (86.4) 345/364 (94.8) 167/174(96) 969/1,067(90.8) Discussion
Better intensive care provision can be achieved by identifying those variables that are significantly associated with a greater chance of survival. The results of the present study indicate that there is a substantial variation in operational PICU and NICU bed availability in São Paulo city: there was a disproportionate distribution of intensive care units and beds across the city with respect of each districts pediatric population. In general there was an excess of private beds and a deficit in the public sector and also a disproportionate division between neonatal and pediatric beds, with a lack of neonatal beds.
The distribution of PICUs and NICUs across the city of São Paulo was disproportionate with greater concentrations in the central regions (RHN-I and V: 61.7%) and lower concentrations in peripheral regions of the city (RHN-III: 9.3%), which, in turn, have the largest pediatric populations, resulting in a failure to regionalize these services in São Paulo city.
Private 32
(37.6)
9 40
(47.1)
16
n = 85 n = 40
13 (15.3)
Philanthropic Public State Cities Public universities
Figure 3 - Types of intensive care units with respect of source of funding - n (%)
Figure 2 - Types of intensive care units with respect of the age groups - n (%)
Neonatal
35 (41.2)
44 (51.7)
n = 85 6
(7)
Pediatric Mixed
states that this pattern of distribution suggests that when one discusses intensive care in Brazil, one is dealing with the situation in the Southeast of Brazil, specifically the State and the city of São Paulo.
In an analysis of PICUs, Barbosa4 observed that
75.8% of the PICUs in the metropolitan region of Rio de Janeiro state were located within Rio de Janeiro city. Of these 50 units, 28% were located in the citys South Zone and 20% in the Center and the Docklands area, leading to the conclusion that in the city of Rio de Janeiro there is also a tendency to concentrate PICUs in the central regions and in the regions with the most financial resources (the South Zone).
These observations lead us to question several aspects of pediatric intensive care in São Paulo and even Brazil overall: does every child in need of intensive care have access to it? Once admitted to an ICU, do patients receive the best available treatment, both in terms of human resources and in terms of technology? Taking into account the lack of ICUs in certain regions and the need for locomotion between different services, is patient transportation being performed in an adequate and safe manner?
Regionalization is an organized process of utilization of a geographical areas resources which assures patients access to the required level of care, maintaining efficient use of available resources without unnecessary duplication. It requires statewide coordination and evaluation and, regionally, depends on the participation of the emergency services, transportation and intensive care.6,7
A number of different authors have already demonstrated that tertiary services, with large patient volumes, doctors who are both more experienced and more specialized in pediatric intensive care and suitable transport for more critically ill patients obtain the best results. Similarly, the access that more critically ill patients have to more specialized centers depends upon the availability of services in every region, upon a formal regionalization facilitating patients entry to necessary services and upon the distance between patients residences and these specialized centers. The overriding objective is to assure specialized care for every patient who requires this type of care.8-18
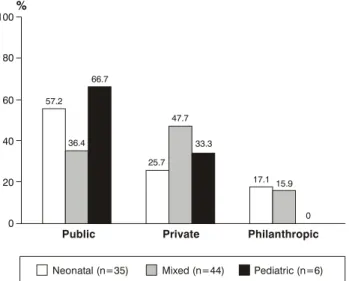
Figure 4 - Distribution of intensive care units according to the age group cared for - n = 85
100
%
80
57.2 66.7
60
40
Public Private Philanthropic
20
0
25.7 47.7
33.3
17.1 15.9
0
Neonatal (n=35) Mixed (n=44) Pediatric (n=6)
36.4
Figure 5 - Distribution of the intensive care units according to the number of beds and age groups (n = 83) - n (%)
n
< 5 beds 5 to 10 beds > 10 beds
0 5 10 15 20 25 30 35
Neonatal (n=33) Mixed (n=44) Pediatric (n=6)
2 (6.1)
2 (4.5) 1
(16.7)
1 (16.7) 5
(15.2) 28
(63.8) 26 (78.8)
4 (66.7)
14 (31.8)
reduced morbidity, with a reduction in adverse events related to intensive care.
It is well known that in São Paulo city, at least within the public sector, there is no specialized pediatric transport system, nor one for the transport of critically ill children, who are taken to ICUs by doctors who have not been familiarized with such patients. This being so, in addition to problems with access to the pediatric intensive care services because of the poor distribution of units across the city, critical patients may have their clinical condition worsened by inadequate transportation.
There are yet other factors to be analyzed with respect of pediatric intensive care provision, such as the number of beds available to the population, the type of source of funding and the level of care by age group.
When intensive care bed requirements are being calculated certain factors must be taken into account, such as average length of stay, the percentage of pediatric hospital admissions and that for PICUs, the regions pediatric population and the number of hospital admissions for the general population and the pediatric one, which varies from region to region.20,21
Taking all of these factors into question, Barbosa4
came to the conclusion that, in the State of Rio de Janeiro the ratio of intensive beds to pediatric population should be of the order of 1:3,000.
Both the ratio of 1:2,728 (calculating based on only the 969 beds of which we were informed) and the ratio of 1:2,156 (extrapolating to adjust for non-responding units) are comparable with the ratio suggested in literature of 1:3,000.
In a similar manner to the disproportionate distribution of ICUs across the five RHN, there is also a disproportion in terms of beds per RHN, varying from 99 beds in RHN-III to 414 for Nucleus I. The ratio of beds/pediatric population is highly heterogeneous: varying from 1:604 in RHN-I (43% of the beds for 10% of the pediatric population) to 1:6,812 in RHN-III (10% of the beds for 26% of the population). A concentration of beds was observed in central regions that are more highly developed in socioeconomic terms (60% of the beds for 30% of the population). The same distribution has been reported by other authors.4,18
With respect of source of funding, it was observed that around half of the beds in PICUs and NICUs were in the public sector. According to data from the Brazilian Association of Health Maintenance Organizations (Associação Brasileira de Medicina de Grupo - ABRAMGE) from June of 2002, the private health system in Brazil, provides care to a quarter of the population (41.6 million) through pre-paid plans. Taking these data into account, the number of pediatric intensive care beds in the private sector should be 25% of the total for the city, i.e. there should be around 240 private PICU beds. What was actually observed in this study was an excess of PICU beds (35.6%) in the private sector and a shortage of public sector beds (a requirement for 725 versus 457 actually in existence), i.e. there is a public intensive care bed deficit of 37% in São Paulo city. This is based on just the 85 ICUs that participated.
Barbosa,4 writing about age-groups cared for, proposes that 80% of intensive beds should provide care for neonates and 20% to patients beyond the neonatal period. The observed distribution by age group for the State of Rio de Janeiro was not adequate (52% neonatal
beds versus 48% of pediatric ones). What was observed
percentage of beds destined for neonatal care at mixed units and that this proportion may be closer to the recommended.
The requirement for neonatal beds varies from country to country and region to region depending upon the number of live births, the percentage of admissions to NICUs, the average length of stay and the frequency of premature and low birth weight cases.22
The frequency of low weight births varies from less than 5% in some European countries to rates as elevated as 15 to 20%. In São Paulo, this number is around 9%.1 Based on this, the literature puts the need for neonatal intensive beds at from 0.4 to 1.5 for every 1,000 live births,23,24 which has increased in recent years in virtue of advance sin the care of high-risk newborns. This number also varies depending on prenatal care: regions that put emphasis on prenatal care will require less investment in intensive units; which doesnt appear to be the case with our country.
In the USA, Goodman et al.,25 found that the provision of neonatal intensive care beds varied substantially from region to region, (1.4 to 5.93 beds for every 1,000 live births, with an average of 3.37). These authors did not find any consistent relation between the number neonatal intensive care beds and neonatal mortality. However, since the only outlook that they assessed was mortality, question could be asked in relation to the babies morbidity.
Barbosa4 assessed the requirements for intensive
neonatal beds in the State of Rio de Janeiro, taking into account an average length of stay of 20 days and a percentage of 7% of births requiring admission to an ICU concluded that in that State there was a need for 3.8 beds for every 1,000 live births and that one third of these would be intensive.
Adopting the bed requirements calculation used by Barbosa4 gives a requirement of 790 NICU beds for a total of 207,462 live births in the city for the year 2000.2 This study identified a total of 556 neonatal beds. Extrapolating to account for the non-participating centers, São Paulo city had around 700 NICU beds, which corresponds to a deficit of 11.4% (90 beds).
The average of 11.7 beds per unit was a little below the North American average, reinforcing the Brazilian tendency towards a greater number of units with smaller numbers of beds each.. Analyzing the exclusively neonatal and pediatric units, the average number of beds per unit (16.9 for NICUs and 8.5 for ICUs) was also below he North American average .12 For a country like Brazil, in financial difficulties, this distribution does not appear to be adequate when dealing with intensive care, which represents a large proportion of the costs of a hospital. In addition to the lower patient volumes cared for in such units, as wash pointed out earlier, there may be a negative effect on the progress of these patients.
A greater concentration (82.4%) of the PICUs was found at General Hospitals, which is a positive factor for the quality of medical care since such hospitals have a wider range of support, diagnosis and treatment services.
The same tendency was also observed by Barbosa4 in the State of Rio de Janeiro.
The ICUs found in teaching hospitals accounted for 10.6% of the participating units, double the proportion found in Rio de Janeiro,4 but still very different from North American data. Pollack et al.12 reported that 76.6% of North American PICUs were affiliated to medical schools.
This situation: lack of planning in respect of pediatric and neonatal intensive care services in São Paulo city, can be explained by the disorderly growth of the health services during the 70s and 80s. Knowledge of the real status of pediatric and neonatal intensive care will make more adequate health planning possible, together with a better distribution of investment and resources with more efficient and effective results and also facilitate the execution of multicenter research projects. Changes must be implemented so that we can ensure intensive care provision for every child that needs it. This study has been the first effort in a push to achieve improved quality in pediatric and neonatal intensive care provision in the city of São Paulo.
References
1. Informações de Saúde. Dados demográficos/SES-SP. Secretaria de Estado da Saúde [site na Internet]. Disponível em: http:// www.saude.sp.gov.br. Acessado: 29 de outubro de 2004. 2. Projeção da população residente no município de São Paulo em
1° de julho de 1998. IBGE - Instituto Brasileiro de Geografia e Estatística [site na Internet]. Disponível em: http:// tabnet.datasus.gov.br/cgi/ibge/popmap.htm. Acessado: 29 de outubro de 2004.
3. Kimura M, Miyadahira AMK. Aspectos da assistência hospitalar no município de São Paulo. A situação da assistência intensiva. Rev Esc Enf USP. 1991;25:61-72.
4. Barbosa AP. Qualidade da assistência em tratamento intensivo neonatal e pediátrico no estado do Rio de Janeiro[tese]. Universidade Federal do Rio de Janeiro; 1998.
5. Goodman DC, Fisher ES, Little GA, Stukel TA, Chang C. Are neonatal intensive care resources located according to need? Regional variation in neonatologists, bed, and low birth weight newborns. Pediatrics. 2001;108:426-31.
6. American Academy Of Pediatrics. Committee on Pediatric Emergency Medicine. American College of Critical Care Medicine. Society of Critical Care Medicine. Consensus report for regionalization of services for critically ill or injured children. Pediatrics. 2000;105:152-5.
7. Consensus Report For Regionalization Of Services For Critically Ill Or Injured Children. Council Of The Society Of Critical Care Medicine. Crit Care Med. 2000;28:236-9.
8. West JG, Cales RH, Gazzaniga AB. Impact of regionalization. The orange county experience. Arch Surg. 1983;118:740-4. 9. Flood AB, Scott WR, Ewy W. Does practice make perfect? Part
I: The relation between hospital volume and outcomes for selected diagnostic categories. Med Care. 1984a;22:98-114. 10. Pollack MM, Katz RW, Ruttimann EU, Getson PR. Improving the
outcome and efficiency of intensive care: the impact of an intensivist. Crit Care Med. 1988;16:11-7.
11. Pollack MM, Alexander SR, Clarke N, Ruttimann EU, Tesselaar HM, Bachulis AC. Improved outcomes from tertiary center pediatric intensive care: a statewide comparison of tertiary and nontertiary care facilities. Crit Care Med. 1991;19:150-9. 12. Pollack MM, Cuerdon TC, Getson PR. Pediatric intensive care
units: results of a national survey. Crit Care Med. 1993;21: 607-14.
14. Gemke RJ, Bonsel GJ. Comparative assessment of pediatric intensive care: a national multicenter study. Pediatric Intensive Care Assessment of Outcome (Picasso) Study Group. Crit Care Med. 1995;23:238-45.
15. Bronstein JM, Capilouto E, Carlo WA, Haywood JL, Goldenberg RL. Access to neonatal intensive care for low-birthweight infants: the role of maternal characteristics. Am J Public Health. 1995;85:357-61.
16. Pollack MM, Patel KM, Ruttimann E. Pediatric critical care training programs have a positive effect on pediatric intensive care mortality. Crit Care Med. 1997;25:1637-42.
17. Tilford JM, Simpson PM, Green JW, Lensing S, Fiser DH. Volume-outcome relationships in pediatric intensive care units. Pediatrics. 2000;106:289-94.
18. Kanter RK. Regional variation in child mortality at hospitals lacking a pediatric intensive care unit. Crit Care Med. 2002;30: 94-9.
19. Edge WE, Kanter RK, Weigle CGM, Walsh RF. Reduction of morbidity in interhospital transport by specialized pediatric staff. Crit Care Med. 1994;22:1186-91.
20. Milne E, Whitty P. Calculation of the need for paediatric intensive care beds. Arch Dis Child. 1995;73:505-7.
21. Pearson GA, Ralston C. Calculation of the need for paediatric intensive care beds. Arch Dis Child. 1996;75:89.
Corresponding author: Daniela Carla de Souza
Rua Alves Guimarães, 518/112, Jardim América CEP 05410-000 São Paulo, SP
Brazil
Phone: +55 (11) 9629.2427/3039.9248 Fax: +55 (11) 3812.8004
E-mail: daniela_cds@ig.com.br
22. Walsh-Sukys M, Fanaroff AA. Perinatal services and resources. In: Fanaroff AA, Martin RJ, editors. Neonatal-perinatal medicine diseases of the fetus and infant. 6th ed. St. Louis: Mosby; 1997. p. 13-22.
23. Turrill S. Is access to a standardized neonatal intensive care possible? J Nurs Manag. 2000;8:49-56.
24. Field DJ, Hodges S, Mason E, Burton P, Yates J, Wale S. The demand for neonatal intensive care. BMJ. 1989;299:1305-8. 25. Goodman DC, Fisher ES, Little GA, Thérése AS, Chang C,