www.biogeosciences.net/9/2419/2012/ doi:10.5194/bg-9-2419-2012
© Author(s) 2012. CC Attribution 3.0 License.
Biogeosciences
Production of oceanic nitrous oxide by ammonia-oxidizing archaea
C. R. L¨oscher1, A. Kock2, M. K¨onneke3, J. LaRoche2, H. W. Bange2, and R. A. Schmitz1
1Institut f¨ur Allgemeine Mikrobiologie, Christian-Albrechts-Universit¨at Kiel, Am Botanischen Garten 1–9, 24118 Kiel, Germany
2Forschungsbereich Marine Biogeochemie, GEOMAR/Helmholtz-Zentrum f¨ur Ozeanforschung Kiel, D¨usternbrooker Weg 20, 24105 Kiel, Germany
3Organic Geochemistry, MARUM, Universit¨at Bremen, P.O. Box 330 440, 28334 Bremen, Germany
Correspondence to:C. R. L¨oscher ([email protected])
Received: 29 January 2012 – Published in Biogeosciences Discuss.: 23 February 2012 Revised: 4 June 2012 – Accepted: 7 June 2012 – Published: 4 July 2012
Abstract.The recent finding that microbial ammonia oxida-tion in the ocean is performed by archaea to a greater ex-tent than by bacteria has drastically changed the view on oceanic nitrification. The numerical dominance of archaeal ammonia-oxidizers (AOA) over their bacterial counterparts (AOB) in large parts of the ocean leads to the hypothesis that AOA rather than AOB could be the key organisms for the oceanic production of the strong greenhouse gas nitrous ox-ide (N2O) that occurs as a by-product of nitrification. Very recently, enrichment cultures of marine ammonia-oxidizing archaea have been reported to produce N2O.
Here, we demonstrate that archaeal ammonia monooxy-genase genes (amoA)were detectable throughout the water column of the eastern tropical North Atlantic (ETNA) and eastern tropical South Pacific (ETSP) Oceans. Particularly in the ETNA, comparable patterns of abundance and expression of archaealamoAgenes and N2O co-occurred in the oxygen minimum, whereas the abundances of bacterialamoAgenes were negligible. Moreover, selective inhibition of archaea in seawater incubations from the ETNA decreased the N2O pro-duction significantly. In studies with the only cultivated ma-rine archaeal ammonia-oxidizer Nitrosopumilus maritimus SCM1, we provide the first direct evidence for N2O pro-duction in a pure culture of AOA, excluding the involvement of other microorganisms as possibly present in enrichments. N. maritimusshowed high N2O production rates under low oxygen concentrations comparable to concentrations exist-ing in the oxycline of the ETNA, whereas the N2O produc-tion from two AOB cultures was comparably low under sim-ilar conditions. Based on our findings, we hypothesize that
the production of N2O in tropical ocean areas results mainly from archaeal nitrification and will be affected by the pre-dicted decrease in dissolved oxygen in the ocean.
1 Introduction
The traditional view that oceanic NH3oxidation is exclu-sively performed by AOB has been challenged by (1) the presence of archaeal amoAgenes in metagenomes of vari-ous environments (Lam et al., 2009; Schleper et al., 2005; Treusch et al., 2005; Venter et al., 2004), (2) the success-ful isolation of the ammonia-oxidizing archaeon N. mar-itimus(K¨onneke et al., 2005) and (3) the fact that archaea capable of ammonia oxidation have been detected in vari-ous oceanic regions throughout the water column and in sed-iments (Church et al., 2009; Francis et al., 2005; Lam et al., 2009; Santoro et al., 2010; Wuchter et al., 2006). Moreover, N. maritimus appears to be adapted to perform ammonia oxidation even under the oligotrophic conditions (Martens-Habbena et al., 2009) that dominate in large parts of the open ocean. These observations point towards an important role of ammonia-oxidizing archaea (AOA, now constitut-ing the novel archaeal lineage ofThaumarchaeota; Brochier-Armanet et al., 2008; Spang et al., 2010) for the oceanic ni-trogen (N) cycle, which has been overlooked until recently (Francis et al., 2007; Schleper, 2010). Archaeal N2O produc-tion has been proposed to contribute significantly to the up-per ocean N2O production in the central California Current and has recently been demonstrated to occur in two AOA en-richment cultures (Santoro et al., 2011). However, the ability of AOA to independently produce N2O as a by-product of ni-trification has not been directly demonstrated in pure cultures or in the ocean.
The eastern tropical North Atlantic (ETNA) and the east-ern tropical South Pacific (ETSP) Oceans represent two con-trasting oceanic O2regimes: while O2concentrations in the ETNA are commonly above 40 µmol l−1, the ETSP regime is characterized by a pronounced depletion of O2in interme-diate waters between∼75 and 600 m, resulting in an oxy-gen minimum zone (OMZ) with O2concentrations close to or even below the detection limit (∼2 µmol l−1)of conven-tional analytical methods.
TheamoA gene coding for the alpha subunit of the am-monia monooxygenase is present in archaea as well as inβ -andγ-proteobacterial ammonia-oxidizers and is commonly used as a functional biomarker for this group (Hallam et al., 2006b; Schleper et al., 2005; Treusch et al., 2005; Venter et al., 2004). Thus, in order to identify whether archaeal or bacterial amoAwas associated with the maximum in N2O concentration in the ocean, we determined the archaeal and bacterialamoAgene abundances and expression in relation to N2O concentrations along vertical profiles during three cruises (in February 2007, February 2008, and June 2010) to the ETNA and one cruise (in January 2009) to the ETSP. Fur-ther, we demonstrated N2O production in a pure culture ofN. maritimusSCM1, which was found to be strongly O2 sensi-tive and is thus suggested to be of highest impact at times of ocean deoxygenation (Stramma et al., 2010). N2O pro-duction from pure cultures of the two marine nitrifying bac-teriaNitrosococcus oceaniNC10 andNitrosomonas marina
NM22 was low compared to the rates achieved by the ar-chaeal isolate in our experiments.
2 Methods summary
2.1 Hydrographic parameters and nutrients
Samples for salinity, O2 concentrations and nutrients were taken from a 24-Niskin-bottle rosette equipped with a CTD-sensor. Oxygen concentrations were determined following the Winkler method using 50 or 100 ml sampling volumes, and salinity and nutrient concentrations were determined as described in Grasshoff et al. (1999).
2.2 Determination of dissolved N2O concentrations
Triplicate samples for N2O analysis were taken from CTD casts during the cruises P348 (February 2007), ATA03 (February 2008), P399 (June 2010) to the ETNA and M77/3 (January 2009) to the ETSP. N2O concentrations were mea-sured with a GC headspace equilibration method as described in Walter et al. (2006);1N2O and AOU were calculated as described therein.
2.3 Molecular genetic methods
2.3.1 Sampling
Seawater samples were taken from a minimum of 12 depths from the CTD casts. For the extraction of DNA and RNA a volume of about 2 l seawater was rapidly filtered (∼30 min filtration time for samples from the ETNA, for samples from the ETSP exact filtration volumes and times were determined and recorded continuously) through 0.2 µm polyethersulfone membrane filters (Millipore, Billerica, MA, USA). The filters were immediately frozen and stored at−80◦C until further
analysis.
2.3.2 Nucleic acid purification
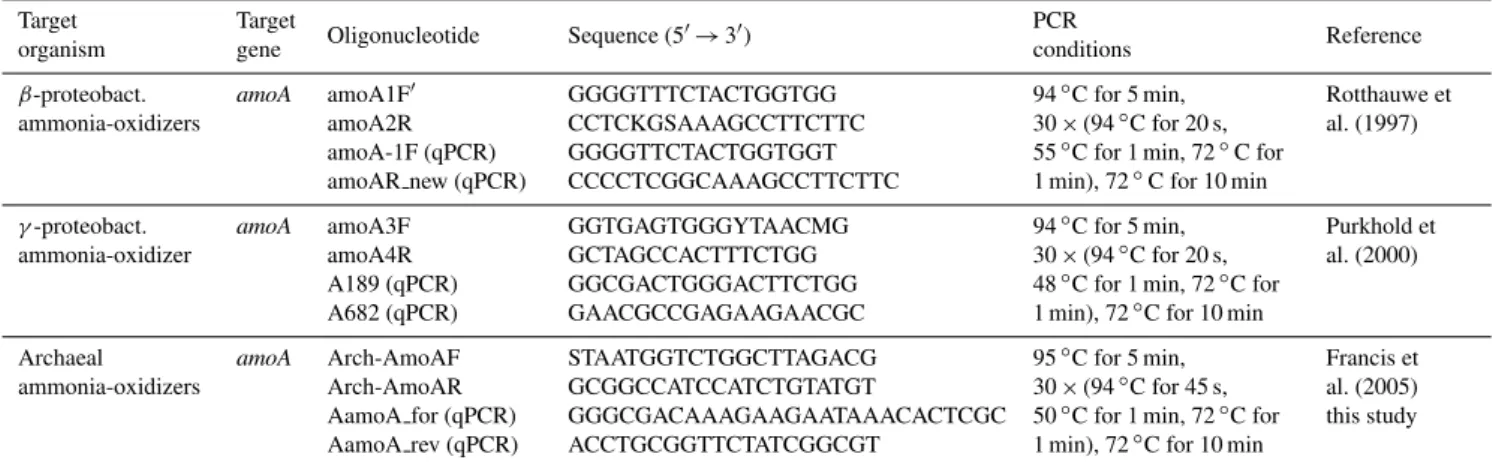
Table 1.Primers and PCR conditions: for real-time qPCR the initial denaturing step was 10 min at 95◦C, annealing temperatures were the same as in the end point PCRs, no final extension step took place, 40 cycles were performed followed by melting curve analysis. A fragment of 175 bp was amplified in qPCRs of archaealamoA.
Target Target
Oligonucleotide Sequence (5′→3′) PCR Reference
organism gene conditions
β-proteobact. ammonia-oxidizers
amoA amoA1F′
amoA2R amoA-1F (qPCR) amoAR new (qPCR)
GGGGTTTCTACTGGTGG CCTCKGSAAAGCCTTCTTC GGGGTTCTACTGGTGGT CCCCTCGGCAAAGCCTTCTTC
94◦C for 5 min,
30×(94◦C for 20 s, 55◦C for 1 min, 72◦C for
1 min), 72◦C for 10 min
Rotthauwe et al. (1997)
γ-proteobact. ammonia-oxidizer
amoA amoA3F amoA4R A189 (qPCR) A682 (qPCR)
GGTGAGTGGGYTAACMG GCTAGCCACTTTCTGG GGCGACTGGGACTTCTGG GAACGCCGAGAAGAACGC
94◦C for 5 min,
30×(94◦C for 20 s, 48◦C for 1 min, 72◦C for
1 min), 72◦C for 10 min
Purkhold et al. (2000)
Archaeal ammonia-oxidizers
amoA Arch-AmoAF Arch-AmoAR AamoA for (qPCR) AamoA rev (qPCR)
STAATGGTCTGGCTTAGACG GCGGCCATCCATCTGTATGT
GGGCGACAAAGAAGAATAAACACTCGC ACCTGCGGTTCTATCGGCGT
95◦C for 5 min, 30×(94◦C for 45 s, 50◦C for 1 min, 72◦C for 1 min), 72◦C for 10 min
Francis et al. (2005) this study
2.3.3 PCR and quantitative PCR
The extracted RNA was reverse transcribed to cDNA by using the QuantiTect® Reverse Transcription Kit (Qiagen, Hilden, Germany) following the manufacturers’ protocol.
Bacterial and archaealamoAas marker genes for nitrifica-tion were PCR-amplified from DNA and cDNA. PCR and quantitative PCR conditions and primers are listed in Ta-ble 1.nirS, nirKandnosZas marker genes for denitrification and the key functional marker gene for anammox,hzo, were PCR amplified according to established protocols (Lam et al., 2007; Schmid et al., 2008). The presence of key genes for anammox and denitrification was tested by PCR in the ETNA but quantified exclusively in samples of the ETSP. Assuming that the PCR detection system has a detection limit compara-ble to the respective qPCR (using the same Primers and PCR conditions), it should be in the range of 1 copy l−1 fornirS up to 4 copies l−1in case of the other genes (deduced from the standard calibration curve in the qPCR assays). All PCRs were performed using 0.1 µl FlexiTaq (Promega Corporation, USA).
Absolute quantification of bacterial and archaeal amoA was performed with standard dilution series; quantifica-tion was performed in duplicates. Standards for quantitative PCRs were obtained fromNitrosococcus oceaniNC10, Ni-trosomonas marinaNM22 and NM51 for bacterialamoAand from an environmental clone for archaealamoA(GenBank accession number JF796147). The specifity of the newly de-veloped qPCR primers detecting archaealamoAwas checked according to the Miqe guidelines (Bustin et al., 2009) by cross amplification tests and re-cloning and sequencing of the products. Reactions were performed in a final volume of 25 µl using 0.5 µl of each primer, 6.5 µl nuclease free wa-ter and 12.5 µl SYBR qPCR Supermix W/ROX (Invitrogen,
Carlsbad, CA). Reactions were performed using an ABI 7300 Real Time PCR system (Applied Biosystems, Carlsbad, CA) according to Lam et al. (2007).
2.3.4 Construction of clone libraries and phylogenetic analysis
Cloning of PCR amplicons was performed using the Topo TA Cloning® Kit (Invitrogen, Carlsbad, CA) according to the manufacturer’s instructions.
Sequencing was carried out by the Institute of Clini-cal Molecular Biology, Kiel. Sequences for archaealamoA were analyzed using the ClustalW multiple alignment tool on a 495 bp fragment (sequences were submitted to Gen-Bank under accession numbers JF796145–JF796179); se-quence differences were set on a minimum of 5 %, and phy-logenetic trees were made using distance-based neighbour-joining analysis (Saitou and Nei, 1987).
2.4 Seawater incubations
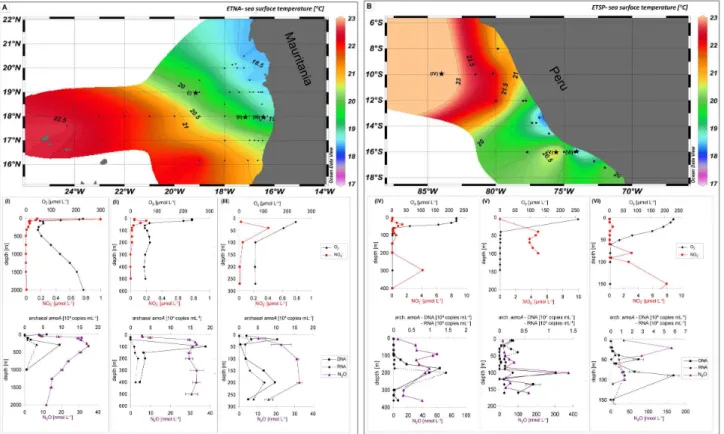
Fig. 1.Maps of sea surface temperatures(A)from the eastern tropical North Atlantic Ocean and(B)from the eastern tropical South Pacific Ocean. The locations of sampling stations are indicated with asterisks in the maps. Selected vertical profiles (I–VI) of O2, NO−2, N2O
(measured in triplicates) and archaealamoA(measured in duplicates by qPCR) are shown; (I) and (IV) are located offshore, (II) and (V) are located on the continental slope, and (III) and (VI) are onshore/coastal stations.
or growth behavior in AOB. In contrast,N. maritimusshowed a decrease in ammonia oxidation and growth when applying GC7concentrations higher than 0.2 mM and shut down nitri-fication when applying GC7in a concentration of∼0.8 mM. Incubations were kept for the duration of the experiment (24 h) in the dark at 8◦C. The experiment was stopped by HgCl2 addition, followed by the determination of the final N2O concentrations.
2.5 Culture experiments
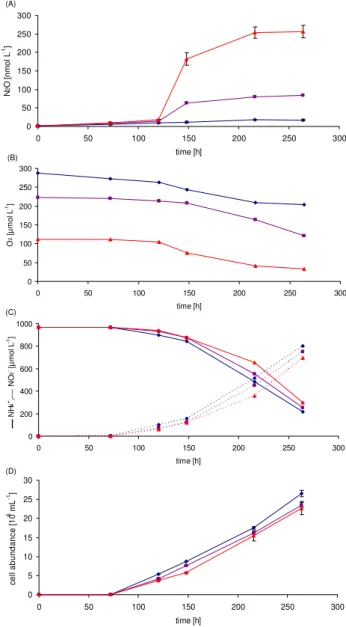
Pure cultures of N. maritimus, N. oceani and N. marina were grown in triplicates in 125 ml serum bottles (contain-ing 75 ml culture and 50 ml headspace) at 28◦C according to
K¨onneke et al. (2005) and Goreau et al. (1980). Serum bot-tles were closed with an air-tight butyl rubber stopper and aluminum crimp-capped. Cultures were kept for the dura-tion of the experiment in the dark. Cell abundances from the triplicate samples were monitored by flow cytometry (FACScalibur, Becton, Dickinson) after staining with Sybr Green I (Invitrogen, Carlsbad). The accuracy of the flow cy-tometry was previously checked microscopically after stain-ing the cells with the fluorescent DNA-bindstain-ing dye 40, 6 0-diamidino-2-phenylindole (DAPI). Cultures were checked
for contaminants microscopically and by 16S rDNA anal-ysis. While tests for the bacterial 16S rDNA gene were negative, the analysis of 84 clones of archaeal 16S rDNA showed that all analyzed sequences matched the identity of theN.maritimusculture. The 16S rDNA gene was PCR am-plified with universal primers, followed by Topo TA cloning and sequencing. Sequence analysis did not show any contam-inants.
N2O concentrations were measured by gas chromatogra-phy using the headspace method as described above, oxygen concentrations were determined using Winkler titration in 50mL Winkler bottles. NH+4 and NO−2 concentrations were determined at several time points over the complete incuba-tion time frame (Grasshoff et al., 1999). In order to exclude chemical N2O production from the medium, cultures toxified with mercury chloride were measured in parallel; no N2O production could be detected.
AOU [µmolL-1] nitrate [µmolL-1]
∆
N2
O [nmolL
-1]
∆
N2
O [nmolL
-1]
potential density [kg m-3] potential density [kg m-3]
Fig. 2.1N2O versus the apparent oxygen utilization (AOU) and nitrate in the ETNA (data from cruises ATA03, P348 and P399), the potential density is colour-coded.
3 Results and discussion
3.1 Vertical distribution of AOA and AOB along N2O depth profiles
Vertical profiles of N2O showed a distribution with concen-trations between 10 and 35 nmol l−1in the ETNA, whereas the N2O concentrations in the ETSP were in the range from 10 to 374 nmol l−1(Fig. 1). In the majority of the sampled stations in the ETNA and the ETSP, the accumulation of dissolved N2O was associated with minimum O2 concentra-tions, as expected (Codispoti, 2010). Maximum N2O concen-trations in the ETNA were generally lower compared to the ETSP, probably as a result of extremely depleted O2 concen-trations in the ETSP below 75 m resulting in enhanced N2O accumulation (Suntharalingam et al., 2000; Codispoti, 2010). The well-established linear correlation between 1N2O and AOU as well as NO−3 (Nevison et al., 2003) was found for the ETNA (Fig. 2), indicating that nitrification was the likely pathway for N2O production. A comparable pattern of the distribution of archaealamoA genes and N2O was ob-served in the water column of the ETNA (Fig. 3), strongly suggesting a correlation between AOA abundance and [N2O] accumulation (Pearson correlation coefficientr=0.63, sta-tistical significance is indicated) in the layers with low O2 (Fig. 4). The key genes for denitrification and anammox (nirS andnirK coding for nitrite reductases and hzo coding for the hydrazine oxidoreductase; Lam et al., 2007; Schmid et al., 2008) were not present in detectable amounts. A co-occurrence of N2O and archaealamoAgenes was detected at certain depths, e.g. at profile V at 100 m water depth (Fig. 1) in the ETSP, but was not a general feature, possibly result-ing from additional N2O production via other processes such as denitrification, nitrifier-denitrification or anammox (Kartal et al., 2007) at present suboxic conditions. The presence of key genes of anammox and denitrification assayed and pre-dominantly detected at coastal stations of the ETSP but also present in large parts of the area off Peru further points to
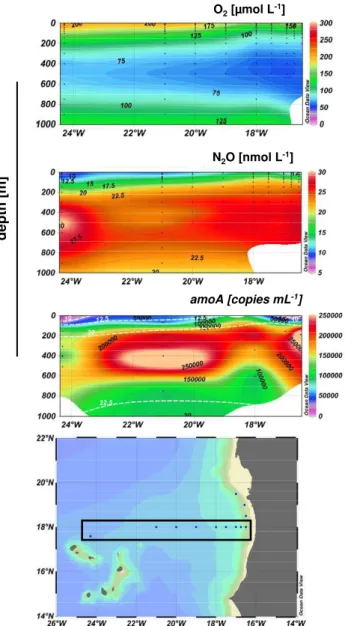
amoA [copies mL-1] N2O [nmol L-1]
O2[µmol L-1]
depth
[m]
Fig. 3.Distribution of O2[µmol l−1], N2O [nmol l−1] and archaeal
amoA[copies ml−1] along 18◦N in the ETNA, detected during the cruise P399. ArchaealamoA abundances are overlaid by the de-tected N2O concentration (dashed white line).
an active contribution of mixed processes to N2O produc-tion in the ETSP (the complete dataset of the ETSP can be seen in L¨oscher (2011). N2O production by mixed processes may explain the lack of correlation between 1N2O and AOU as well as NO−3 in the ETSP (Ryabenko et al., 2012). Gene abundances of archaealamoAin the ETNA and ETSP were detectable throughout the water column and reached values of up to 1.9×10⁵ and 6×10⁴copies ml−1,
10 100 1000 10000 100000 1000000
0 50 100 150 200 250 300
O2 [µmol L-1]
log
am
o
A
[
c
opi
e
s
m
L
-1]
0 10 20 30 40 50
N
2
O [
n
m
o
l L
-1]
amoA ATA03 & P348 amoA P399
N2O ATA03 & P348 N2O P399
Fig. 4.ArchaealamoAand N2O versus O2in the ETNA (data from
the cruises ATA03, P348 and P399/2). A similar trend has been de-tected during the three cruises.
in various oceanic regions (Wuchter et al., 2006; Santoro et al., 2010; Lam et al., 2009; Francis et al., 2005; Church et al., 2009). Thus, we hypothesize that a significant part of the N2O production occurs via archaeal nitrification in the ETNA and might also be present in parts of the water col-umn of the ETSP. A difference of one order of magnitude between archaeal amoA copies in RNA and in DNA has been observed in vertical profiles of the ETSP, with copy numbers up to 7×10⁴copies ml−1 in the DNA and up to 1.5×10³copies ml−1in the RNA. A similar tendency is de-tectable in the ETNA; however, the difference is less pro-nounced compared to the ETSP. This discrepancy, already reported by Lam et al. (2009), is hypothesized to be due to a diurnal cycle of ammonia-oxidation and therefore changing amoA expression. Moreover, a sampling bias due to com-parably long filtration times (up to 30 min) might have led to RNA degradation, as previous studies reported transcript half-lives of down to 0.5 min inProchlorococcus(Steglich et al., 2010).
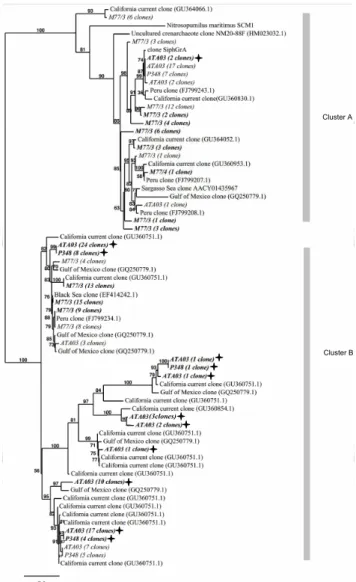
3.2 Phylogenetic diversity of archaeal amoA
The diversity of AOA present in the ETNA was determined based on the analysis of∼300amoAsequences from 15 sta-tions of 3 cruises (P348, ATA03, and P399). Sequences were derived from up to 3 depths between the ocean surface and 1000 m, which showed archaealamoApresence by PCR. The sequences split into two main clusters, with sequences from the O2 minimum clustering mainly in cluster B (Fig. 5, Ta-ble S1 in the Supplement). Only 11.5 % of sequences derived from samples from the O2minimum fall into cluster A. Se-quences derived from depths between the surface and the up-per oxycline were present in both clusters to equal amounts (Fig. 5, Table S1 in the Supplement). In the ETSP, sequences from within as well as from depths above the OMZ separated into both clusters, with the majority of absolute sequence numbers from the OMZ affiliating with cluster B (Fig. 5, Ta-ble S1 in the Supplement), as already observed for the se-quences from the O2minimum in the Atlantic Ocean.
Cluster B Cluster A
Cluster B Cluster A
Cluster B Cluster A
Cluster B Cluster A
Cluster B Cluster A
(3clones)
) (
Fig. 5.Distance-based neighbour-joining phylogenetic tree of ar-chaealamoAsequences from the ETNA (cruises ATA03 and P348) and ETSP (cruise M77/3). Sequences derived from the oxygen min-imum zone (OMZ) of the ETNA are in italics, bold and marked with solid stars; sequences from above the OMZ are in italics. Sequences from the OMZ of the ETSP are in italics and bold; sequences from above the OMZ are in italics.
3.3 Potential importance of cluster B affiliated Thaumarchaeota for N2O production
Fig. 6.N2O production determined from seawater incubations at three different stations (1–3) from the ETNA (P399).1N2O was
calculated as the difference of N2O concentrations over the
incuba-tion time (i.e. 24 h). Open columns represent samples with no in-hibitor, filled columns represent samples with the archaeal inhibitor GC7. Error bars indicate the standard deviation of three technical replicates.
concentrations in tropical ocean areas (Stramma et al., 2010), we hypothesize that cluster B affiliated AOA might dominate the production of N2O and the balance between reduced and oxidized nitrogen species in the ocean, as those organisms are likely more adapted to low O2concentrations.
Both observed clusters were present in a similar distribu-tion along vertical profiles during all cruises to the ETNA (Figs. 4 and 5, Table S1 in the Supplement). The community of AOA in this area appears therefore to be stable over the time investigated.
3.4 N2O production in the ETNA
At three different stations in the ETNA, 24h seawater incu-bations using seawater from the N2O maximum (at the depth of the OMZ) were performed. In two out of three experi-ments, N2O production was significantly lower in samples treated with N1-guanyl-1,7-diaminoheptane (GC7)(Fig. 6), a hypusination inhibitor shown to selectively inhibit the cell cycle of archaea (Jansson et al., 2000), but which appears not to affect AOB (for detailed experimental data see Sect. 2). In the third experiment performed at a coastal station, a simi-lar trend was observed; however it was not statistically sig-nificant. These findings further support our hypothesis that N2O production in large parts of the ETNA occurs within the OMZ and is mainly carried out by archaea.
3.5 N2O production inN. maritimus
Direct evidence for the production of N2O by archaea was obtained from experiments with pure cultures of N. mar-itimus. The purity of the cultures was confirmed by exten-sive 16S rDNA analysis (see Sect. 2). N. maritimus cul-tures grew at comparable rates under the varying O2 con-ditions and showed similar nitrification rates. Production of
0 50 100 150 200 250 300
0 50 100 150 200 250 300
time [h]
N
2
O [
n
m
o
l L
-1]
0 200 400 600 800 1000
0 50 100 150 200 250 300
time [h]
- N
H
4
+, --- N
O
2
- [µ
m
o
l L
-1]
0 50 100 150 200 250 300
0 50 100 150 200 250 300
time [h]
O
2 [µ
m
o
l L
-1]
0 5 10 15 20 25 30
0 50 100 150 200 250 300
time [h]
c
e
ll
ab
und
ance [
1
0
6 mL -1]
(A)
(D) (C) (B)
Fig. 7. N2O (A), O2 (B), NH+4 and NO−2 (C) as well as cell abundances(D)determined from incubation experiments with pure cultures of N. maritimus. Experiments are colour-coded accord-ing to their initial O2 concentrations: red (112 µmol l−1); violet
(223 µmol l−1); and blue (287 µmol l−1). N2O and cell abundances
were measured in triplicates and the associated error ranges are in-dicated (please note that in the most cases the error bars are too small to be visible in the figure).
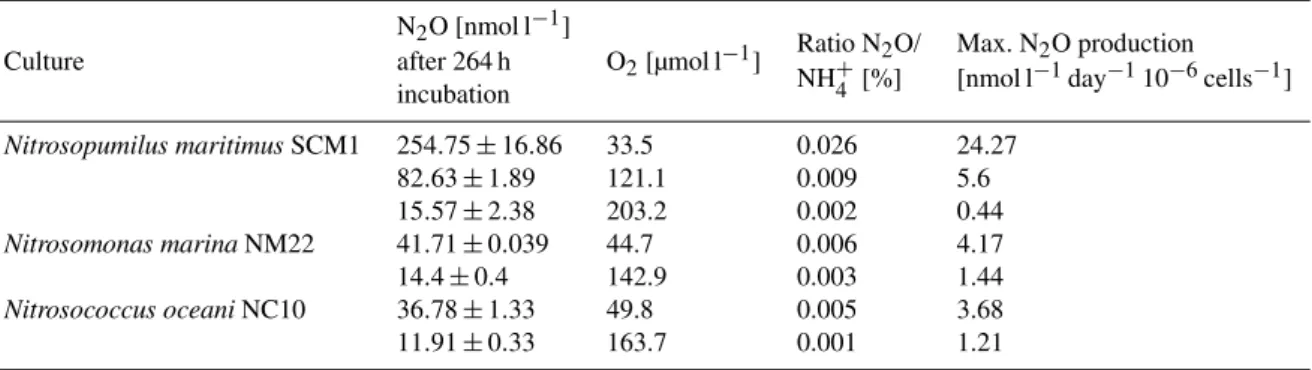
Table 2.N2O production in culture experiments: mean O2and N2O concentrations (in triplicate samples) of pure cultures ofN. maritimus,
N. marinaandN. oceaniafter 264 h incubation, the initial NH+4 concentration (∼1 mmol l−1)was completely converted to NO−2 in the end of the experiment in AOB cultures, NO−2 was below the detection limit at the initial time point of the incubation.
N2O [nmol l−1] Ratio N
2O/ Max. N2O production
Culture after 264 h O2[µmol l−1]
NH+4 [%] [nmol l−1day−110−6cells−1] incubation
Nitrosopumilus maritimusSCM1 254.75±16.86 33.5 0.026 24.27
82.63±1.89 121.1 0.009 5.6
15.57±2.38 203.2 0.002 0.44
Nitrosomonas marinaNM22 41.71±0.039 44.7 0.006 4.17
14.4±0.4 142.9 0.003 1.44
Nitrosococcus oceaniNC10 36.78±1.33 49.8 0.005 3.68
11.91±0.33 163.7 0.001 1.21
in the culture of N. maritimus to 0.001 %–0.006 % in the AOB cultures. The N2O production rates per cell derived from our AOB experiments are in agreement with those re-ported by Goreau et al. (1980), even though a different ex-perimental setup was used. Culture experiments, such as those presented here, were performed with AOB cell den-sities (∼105cells ml−1), which are much higher than usu-ally found in the ocean (102–103cells ml−1)(Wuchter et al., 2006; Lam et al., 2009). Thus, the N2O production rates from the AOB cultures are probably overestimated and not repre-sentative as N2O production per cell by AOB also depends on the present cell densities (Frame and Casciotti, 2010), with high cell densities leading to enhanced N2O production. In contrast, the AOA cell densities in our culture experiment (∼105–107cells ml−1)were comparable to those present in the oceanic environment (∼105cells ml−1)and thus seem to be reasonably representative of the rates expected in natural populations of AOA.
Using the observed archaeal N2O production rate for low O2 conditions derived from our experimental results (140 nmol l−1d−1; normalized to 106cells ml−1 yielding
∼24 nmol l−1d−1, see Table 2), an upper estimate for the potential archaeal N2O production would be around 14 nmol m−2s−1 (however, NH+
4 concentrations in our cul-ture experiments were significantly higher than in the envi-ronment), assuming a thickness of about 50 m for the low O2layer as typically found in the ETNA. Compared to esti-mates of N2O emissions from the ETNA to the atmosphere of up to 2 nmol m−2s−1(Wittke et al., 2010), potential oceanic archaeal N2O production might be indeed significant.
3.6 Potential pathways for archaeal N2O production
AOB can produce N2O from NH2OH during nitrification or from NO−2 during nitrifier-denitrification (Kool et al., 2010; Shaw et al., 2006). In AOA however, the pathway of ammo-nia oxidation is yet not understood. So far, no equivalent to the hydroxylamine-oxidoreductase, which catalyses the oxi-dation of NH2OH to NO−2 during nitrification in AOB, has
been identified (K¨onneke et al., 2005; Martens-Habbena et al., 2009; Walker et al., 2010), indicating that AOA likely use a different pathway than AOB do when producing N2O. The detection of the nitrite reductase gene nirK in the se-quenced genomes of cultured Thaumarchaeota (Walker et al., 2010) led to the theory that AOA might produce N2O by nitrifier-denitrification, which might particularly impact at low O2concentrations. To identify the origin of N2O for-mation, isotopomeric studies were performed withN. mar-itimuspure cultures. Using the lowest O2 concentration of the three chosen (112 µM), a 15N site preference (SPN2O)
in N2O of 34±12 ‰ was detected, consistent with results
from AOA enrichments (Santoro et al., 2011), which is in agreement with the SPN2Oof∼33 ‰ typically found in AOB
cultures performing ammonia oxidation (Sutka et al., 2006) (for comparison: nitrifier-denitrification of AOB results in a SPN2Oof about 0 ‰). Thus, our dataset points towards a
pro-duction of N2O via the oxidation of NH+4 to NO−2, poten-tially via an unknown intermediate as we were not able to detect NH2OH in N. maritimus cultures using the method described in Schweiger et al. (2007). However, takingδ18O data into account, Santoro et al. (2011) suggested a reduc-tion of NO−2 to N2O. As we have not performed O2 iso-topomeric studies, we cannot exclude N2O production via nitrifier-denitrification, particularly when O2becomes limit-ing as previously described for the Arabian Sea (Nicholls et al., 2007) where O2concentrations drop far more than in our experiments (lowest O2concentration∼112 µM).
4 Summary
bacterial nitrification. Further, the archaeal N2O production appears to be highly sensitive to the dissolved O2 concentra-tion, with highest N2O production rates at low O2 concen-trations such as those present in the OMZ of the ETNA. The predicted expansion of OMZs in the future in many parts of the ocean (Stramma et al., 2008) may lead to an enhanced N2O production in the ocean (Naqvi et al., 2010) and there-fore may have severe consequences for the budget of N2O in the atmosphere as well.
Supplementary material related to this article is available online at: http://www.biogeosciences.net/9/ 2419/2012/bg-9-2419-2012-supplement.pdf.
Acknowledgements. We would like to thank three anonymous referees for their constructive comments that helped to improve the manuscript. We further thank the authorities of Cape Verde, Mauritania and Peru for the permission to work in their territorial waters. We acknowledge the support of the captains and crews of R/V Poseidon, R/V L’Atalante, and R/V Meteor as well as the chief scientists of ATA03, A. K¨ortzinger, and M77/3, Martin Frank. Moreover, we thank T. Kalvelage for sampling during P348, and T. Großkopf and H. Schunck for sampling during M77/3; we further thank K. Stange, F. Malien, M. Lohmann, V. Leon and P. Fritsche for oxygen and nutrient measurements. We thank A. Pommerening-R¨oser for providing cultures of N. oceani
NC10 and N. marina NM22 and C. Fehling for performing the isotopomeric studies. Financial support for this study was provided by the DFG Sonderforschungsbereich 754 (www.sfb754.de) and the BMBF Verbundprojekt SOPRAN (www.sopran.pangaea.de; SOPRAN grants 03F0462A and 03F0611A). MK was financially supported by the DFG.
Edited by: M. Voss
References
Bange, H. W., Freing, A., Kock, A., and L¨oscher, C. R.: Ma-rine Pathways to Nitrous Oxide, in: Nitrous oxide and Climate Change, edited by: Smith, K. A., Earthscan, London, Washing-ton, 36–62, 2010.
Brochier-Armanet, C., Boussau, B., Gribaldo, S., and Forterre, P.: Mesophilic crenarchaeota: proposal for a third archaeal phylum, the Thaumarchaeota, Nat. Rev. Microbiol., 6, 245–252, 2008. Bustin, S. A., Benes, V., Garson, J. A., Hellemans, J., Huggett,
J., Kubista, M., Mueller, R., Nolan, T., Pfaffl, M. W., Ship-ley, G. L., Vandesompele, J., and Wittwer, C. T.: The MIQE Guidelines: Minimum Information for Publication of Quantita-tive Real-Time PCR Experiments, Clin. Chem., 55, 611–622, doi:10.1373/clinchem.2008.112797, 2009.
Church, M. J., Wai, B., Karl, D. M., and DeLong, E. F.: Abun-dances of crenarchaealamoAgenes and transcripts in the Pacific Ocean, Environ. Microbiol., 12, 679–688, doi:10.1111/j.1462-2920.2009.02108.x, 2009.
Codispoti, L. A.: Interesting Times for Marine N2O, Science, 327,
1339–1340, doi:10.1126/science.1184945, 2010.
Denman, K. L., Brasseur, G., Chidthaisong, A., Ciais, P., Cox, P. M., Dickinson, R. E., Hauglustaine, D., Heinze, C., Holland, E., Jacob, D., Lohmann, U., Ramachandran, S., da Silva Dias, P. L., Wofsy, S. C., and Zhang, X.: Couplings Between Changes in the Climate System and Biogeochemistry, in: Climate Change 2007: The Physical Science Basis. Contribution of Working Group I to the Fourth Assessment Report of the Intergovernmental Panel on Climate Change, edited by: Solomon, S., Qin, D., Manning, M., Chen, Z., Marquis, M., Averyt, K. B., Tignor, M., and Miller, H. L., Cambridge University Press, Cambridge, UK, New York, NY, 2007.
Fehling, C. and Friedrichs, G.: A precise high-resolution near in-frared continuous wave cavity ringdown spectrometer using a Fourier transform based wavelength calibration, Rev. Sci. In-strum., 81, 053109 doi:10.1063/1.3422254, 2010.
Forster, P., Ramaswamy, V., Artaxo, P., Berntsen, T., Betts, R., Fa-hey, D. W., Haywood, J., Lean, J., Lowe, D. C., Myhre, G., Nganga, J., Prinn, R., Raga, G., Schulz, M., and Van Dorland, R.: Changes in Atmospheric Constituents and in Radiative Forc-ing, in: Climate Change 2007: The Physical Science Basis. Con-tribution of Working Group I to the Fourth Assessment Report of the Intergovernmental Panel on Climate Change, edited by: Solomon, S., Qin, D., Manning, M., Chen, Z., Marquis, M., Averty, K. B., Tignor, M., and Miller, H. L., Cambridge Univer-sity Press, Cambridge, UK and New York, NY, USA, 129–234, 2007.
Frame, C. H. and Casciotti, K. L.: Biogeochemical controls and isotopic signatures of nitrous oxide production by a marine ammonia-oxidizing bacterium, Biogeosciences, 7, 2695–2709, doi:10.5194/bg-7-2695-2010, 2010.
Francis, C. A., Roberts, K. J., Beman, J. M., Santoro, A. E., and Oakley, B. B.: Ubiquity and diversity of ammonia-oxidizing archaea in water columns and sediments of the ocean, P. Natl. Acad. Sci. USA, 102, 14683–14688, doi:10.1073/pnas.0506625102, 2005.
Francis, C. A., Beman, J. M., and Kuypers, M. M. M.: New pro-cesses and players in the nitrogen cycle: the microbial ecology of anaerobic and archaeal ammonia oxidation, ISME J., 1, 19– 27, doi:10.1038/ismej.2007.8, 2007.
Goreau, T. J., Kaplan, W. A., Wofsy, S. C., McElroy, M. B., Val-ois, F. W., and Watson, S. W.: Production of NO2- and N2O by
Nitrifying Bacteria at Reduced Concentrations of Oxygen, Appl. Environ. Microb., 40, 526–532, 1980.
Grasshoff, G., Kremling, K., Erhardt, M.: Methods of seawater analysis, 3rd Edn., Wiley VCH, Weinheim, 1999.
Hallam, S. J., Mincer, T., Schleper, C., Preston, C., Roberts, K., Richardson, P., and DeLong, E.: Pathways of carbon assimi-lation and ammonia oxidation suggested by environmental ge-nomic analyses of marine crenarchaeota, Plos Biol., 4, 2412– 2412, doi:10.1371/journal.pbio.0040437, 2006a.
Jansson, B. P. M., Malandrin, L., and Johansson, H. E.: Cell Cycle Arrest in Archaea by the Hypusination Inhibitor N1-Guanyl-1,7-Diaminoheptane, J. Bacteriol., 182, 1158–1161, doi:10.1128/jb.182.4.1158-1161.2000, 2000.
Kartal, B., Kuypers, M. M. M., Lavik, G., Schalk, J., den Camp, H., Jetten, M. S. M., and Strous, M.: Anammox bacteria disguised as denitrifiers: nitrate reduction to dinitrogen gas via nitrite and am-monium, Environ. Microbiol., 9, 635–642, doi:10.1111/j.1462-2920.2006.01183.x, 2007.
K¨onneke, M., Bernhard, A. E., de la Torre, J. R., Walker, C. B., Waterbury, J. B., and Stahl, D. A.: Isolation of an autotrophic ammonia-oxidizing marine archaeon, Nature, 437, 543–546, doi:10.1038/nature03911, 2005.
Kool, D. M., Wrage, N., Zechmeister-Boltenstern, S., Pfeffer, M., Brus, D., Oenema, O., and Van Groenigen, J.-W.: Nitrifier deni-trification can be a source of N2O from soil: a revised approach
to the dual-isotope labelling method, Eur. J. Soil Sci., 61, 759– 772, 2010.
Lam, P., Jensen, M. M., Lavik, G., McGinnis, D. F., Muller, B., Schubert, C. J., Amann, R., Thamdrup, B., and Kuypers, M. M. M.: Linking crenarchaeal and bacterial nitrification to anam-mox in the Black Sea, P. Natl. Acad. Sci. USA, 104, 7104–7109, doi:10.1073/pnas.0611081104, 2007.
Lam, P., Lavik, G., Jensen, M. M., van de Vossenberg, J., Schmid, M., Woebken, D., Dimitri, G., Amann, R., Jetten, M. S. M., and Kuypers, M. M. M.: Revising the nitrogen cycle in the Peruvian oxygen minimum zone, P. Natl. Acad. Sci. USA, 106, 4752– 4757, doi:10.1073/pnas.0812444106, 2009.
L¨oscher, C. R.: Sensitivity to the biological oceanic nitrogen cycle to changes in dissolved oxygen, PhD, Microbiology, Christian Albrechts University, Kiel, Kiel, 120 pp., 2011.
Martens-Habbena, W., Berube, P. M., Urakawa, H., de la Torre, J. R., and Stahl, D. A.: Ammonia oxidation kinetics determine niche separation of nitrifying Archaea and Bacteria, Nature, 461, 976–979, doi:10.1038/nature08465, 2009.
Molina, V., Belmar, L., and Ulloa, O.: High diversity of ammonia-oxidizing archaea in permanent and seasonal oxygen-deficient waters of the eastern South Pacific, Environ. Microbiol., 12, 2450–2465, doi:10.1111/j.1462-2920.2010.02218.x, 2010. Nakayama, T., Fukuda, H., Kamikawa, T., Sugita, A., Kawasaki,
M., Morino, I., and Inoue, G.: Measurements of the 3v3 band of
14N15N16O and15N14N16O using continuous-wave cavity
ring-down spectroscopy, Appl. Phys. B-Lasers O., 88, 137–140, 2007. Naqvi, S. W. A., Bange, H. W., Far´ıas, L., Monteiro, P. M. S., Scran-ton, M. I., and Zhang, J.: Marine hypoxia/anoxia as a source of CH4and N2O, Biogeosciences, 7, 2159–2190,
doi:10.5194/bg-7-2159-2010, 2010.
Nevison, C., Butler, J. H., and Elkins, J. W.: Global distribution of N2O and DN2O-AOU yield in the subsurface ocean, Global
Biogeochem. Cy., 17, 1119, doi:10.1029/2003GB002068, 2003. Nicholls, J. C., Davis, C. A., and Trimmer, M.: High-resolution pro-files and nitrogen isotope tracing reveal a dominant source of ni-trous oxide and multiple pathways of nitrogen gas formation in the central Arabian Sea, Limnol. Oceanogr., 52, 156–168, 2007. Poth, M. and Focht, D. D.:15N kinetic analysis of N2O production
byNitrosomas europaea: An examination of nitrifier denitrifica-tion, Appl. Environ. Microb., 49, 1134–1141, 1985.
Purkhold, U., Pommerening-Roser, A., Juretschko, S., Schmid, M. C., Koops, H. P., and Wagner, M.: Phylogeny of all recognized
species of ammonia oxidizers based on comparative 16S rRNA and amoA sequence analysis: Implications for molecular diver-sity surveys, Appl. Environ. Microb., 66, 5368–5382, 2000. Ravishankara, A. R., Daniel, J. S., and Portmann, R. W.:
Ni-trous Oxide (N2O): The Dominant Ozone-Depleting
Sub-stance Emitted in the 21st Century, Science, 326, 123–125, doi:10.1126/science.1176985, 2009.
Rotthauwe, J. H., Witzel, K. P., and Liesack, W.: The ammonia monooxygenase structural gene amoA as a functional marker: Molecular fine-scale analysis of natural ammonia-oxidizing pop-ulations, Appl. Environ. Microb., 63, 4704–4712, 1997. Ryabenko, E., Kock, A., Bange, H. W., Altabet, M. A., and Wallace,
D. W. R.: Contrasting biogeochemistry of nitrogen in the Atlantic and Pacific Oxygen Minimum Zones, Biogeosciences, 9, 203– 215, doi:10.5194/bg-9-203-2012, 2012.
Saitou, N. and Nei, M.: On the Maximum-Likelihood Method for Molecular Phylogeny, Jpn. J. Genet., 62, 547–548, 1987. Santoro, A. E., Casciotti, K. L., and Francis, C. A.: Activity,
abun-dance and diversity of nitrifying archaea and bacteria in the central California Current, Environ. Microbiol., 12, 1989–2006, doi:10.1111/j.1462-2920.2010.02205.x, 2010.
Santoro, A. E., Buchwald, C., McIlvin, M. R., and Casciotti, K. L.: Isotopic Signature of N2O Produced by Marine
Ammonia-Oxidizing Archaea, Science, 333, 1282–1285, 2011.
Schleper, C.: Ammonia oxidation: different niches for bacteria and archaea?, ISME J., 4, 1092–1094, doi:10.1038/ismej.2010.111, 2010.
Schleper, C., Jurgens, G., and Jonuscheit, M.: Genomic stud-ies of uncultivated archaea, Nat. Rev. Microbiol., 3, 479–488, doi:10.1038/nrmicro1159, 2005.
Schmid, M. C., Hooper, A. B., Klotz, M. G., Woebken, D., Lam, P., Kuypers, M. M. M., Pommerening-Roeser, A., op den Camp, H. J. M., and Jetten, M. S. M.: Environmental detection of octahaem cytochrome c hydroxylamine/hydrazine oxidoreduc-tase genes of aerobic and anaerobic ammonium-oxidizing bac-teria, Environ. Microbiol., 10, 3140–3149, doi:10.1111/j.1462-2920.2008.01732.x, 2008.
Schweiger, B., Hansen, H. P., and Bange, H. W.: A time series of hydroxylamine (NH2OH) in the southwestern Baltic Sea,
Geo-phys. Res. Lett., 34, L24608, doi:10.1029/2007gl031086, 2007. Shaw, L. J., Nicol, G. W., Smith, Z., Fear, J., Prosser, J. I., and
Baggs, E. M.:Nitrosospiraspp. can produce nitrous oxide via a nitrifier denitrification pathway, Environ. Microbiol., 8, 214– 222, 2006.
Spang, A., Hatzenpichler, R., Brochier-Armanet, C., Rattei, T., Tischler, P., Spieck, E., Streit, W., Stahl, D. A., Wagner, M., and Schleper, C.: Distinct gene set in two different lineages of ammonia-oxidizing archaea supports the phylum Thaumar-chaeota, Trends Microbiol., 18, 331–340, 2010.
Steglich, C., Lindell, D., Futschik, M., Rector, T., Steen, R., and Chisholm, S. W.: Short RNA half-lives in the slow-growing ma-rine cyanobacterium Prochlorococcus, Genome Biol., 11, R54, doi:10.1186/gb-2010-11-5-r54, 2010.
Stein, L. Y. and Yung, Y. L.: Production, isotopic com-position, and atmospheric fate of biologically produced nitrous oxide, Annu. Rev. Earth Pl. Sc., 31, 329–356, doi:10.1146/annurev.earth.31.110502.080901, 2003.
320, 655–658, doi:10.1126/science.1153847, 2008.
Stramma, L., Schmidtko, S., Levin, L. A., and Johnson, G. C.: Ocean oxygen minima expansions and their biological impacts, Deep-Sea Res. Pt. I, 57, 587–595, doi:10.1016/j.dsr.2010.01.005, 2010.
Suntharalingam, P., Sarmiento, J. L., and Toggweiler, J. R.: Global significance of nitrous-oxide production and transport from oceanic low-oxygen zones: A modeling study, Global Bio-geochem. Cy., 14, 1353–1370, 2000.
Sutka, R. L., Ostrom, N. E., Ostrom, P. H., Breznak, J. A., Gandhi, H., Pitt, A. J., and Li, F.: Distinguishing nitrous oxide pro-duction from nitrification and denitrification on the basis of isotopomer abundances, Appl. Environ. Microb., 72, 638–644, doi:10.1128/aem.72.1.638-644.2006, 2006.
Treusch, A. H., Leininger, S., Kletzin, A., Schuster, S. C., Klenk, H. P., and Schleper, C.: Novel genes for nitrite reductase and Amo-related proteins indicate a role of uncultivated mesophilic crenar-chaeota in nitrogen cycling, Environ. Microbiol., 7, 1985–1995, doi:10.1111/j.1462-2920.2005.00906.x, 2005.
Venter, J. C., Remington, K., Heidelberg, J. F., Halpern, A. L., Rusch, D., Eisen, J. A., Wu, D., Paulsen, I., Nelson, K. E., Nel-son, W., Fouts, D. E., Levy, S., Knap, A. H., Lomas, M. W., Nealson, K., White, O., Peterson, J., Hoffman, J., Parsons, R., Baden-Tillson, H., Pfannkoch, C., Rogers, Y. H., and Smith, H. O.: Environmental genome shotgun sequencing of the Sargasso Sea, Science, 304, 66–74, 2004.
Walker, C. B., de la Torre, J. R., Klotz, M. G., Urakawa, H., Pinel, N., Arp, D. J., Brochier-Armanet, C., Chain, P. S. G., Chan, P. P., Gollabgir, A., Hemp, J., Hugler, M., Karr, E. A., Konneke, M., Shin, M., Lawton, T. J., Lowe, T., Martens-Habbena, W., Sayavedra-Soto, L. A., Lang, D., Sievert, S. M., Rosenzweig, A. C., Manning, G., and Stahl, D. A.: Ni-trosopumilus maritimus genome reveals unique mechanisms for nitrification and autotrophy in globally distributed ma-rine crenarchaea, P. Natl. Acad. Sci. USA, 107, 8818–8823, doi:10.1073/pnas.0913533107, 2010.
Walter, S., Bange, H. W., Breitenbach, U., and Wallace, D. W. R.: Nitrous oxide in the North Atlantic Ocean, Biogeosciences, 3, 607–619, doi:10.5194/bg-3-607-2006, 2006.
Wittke, F., Kock, A., and Bange, H. W.: Nitrous oxide emissions from the upwelling area off Mauritania (NW Africa), Geophys. Res. Lett., 37, L12601, doi:10.1029/2010GL042442, 2010. Wuchter, C., Abbas, B., Coolen, M. J. L., Herfort, L., van
Blei-jswijk, J., Timmers, P., Strous, M., Teira, E., Herndl, G. J., Mid-delburg, J. J., Schouten, S., and Damste, J. S. S.: Archaeal nitrifi-cation in the ocean, P. Natl. Acad. Sci. USA, 103, 12317–12322, doi:10.1073/pnas.0600756103, 2006.