FOREST
R. M. Etto1, L. M. Cruz1, E. C. Jesus2, C. W. Galvão3, F. Galvão4, E. M. Souza1, F. O. Pedrosa1, M. B. R. Steffens1*
1
Departamento de Bioquímica e Biologia Molecular, Universidade Federal do Paraná, Curitiba, PR, Brasil; 2Empresa Brasileira de Pesquisa Agropecuária - Agrobiologia, Seropédica, RJ, Brasil; 3Departamento de Biologia Estrutural, Molecular e Genética, Universidade Estadual de Ponta Grossa, Ponta Grossa, PR, Brasil; 4Departamento de Ciências Florestais, Universidade Federal do
Paraná, Curitiba, PR, Brasil.
Submitted: July 05, 2011; Approved: June 07, 2012.
ABSTRACT
The acidic peatlands of southern Brazil are ecosystems essential for the maintenance of the Atlantic Forest, one of the 25 hot-spots of biodiversity in the world. In this work, we investigated the composition of prokaryotic communities in four histosols of three acidic peatland regions by constructing small-subunit (SSU) rRNA gene libraries and sequencing. SSU rRNA gene sequence analysis showed the prevalence of Acidobacteria (38.8%) and Proteobacteria (27.4%)of the Bacteria domain and Miscellaneous (58%) and Terrestrial (24%) groups of Crenarchaeota of the Archaea domain. As observed in other ecosystems, archaeal communities showed lower richness than bacterial communities. We also found a limited number of Euryarchaeota and of known methanotrophic bacteria in the clone libraries.
Key words: acidic peatland, prokaryotic communities, SSU rRNA gene, microbial ecology
INTRODUCTION
Peatlands are ecosystems with high quantity of organic matter due to high water table levels and low temperatures. In the water-saturated layer, the lack of oxygen significantly retards degradation of organic matter, causing plant residues to accumulate as peat. Worldwide, it is estimated that an area of about 400 million ha is covered with peatland, equivalent to 3 % of the Earth’s surface. Most of this area, about 350 million ha, is in the northern hemisphere, harbouring over one-third of the global reserves of soil organic carbon (44). In Brazil, it is
estimated that these environment cover approximately 611,883 ha, i.e., around 0.07 % of the national territory (55).
The acidic peatlands of the Paraná state in southern Brazil are contained within the high-altitude grasslands that cover 28,000 km2 of the state. This ecosystem contains herbaceous and bryophytes species and the soils are covered by Sphagnum mosses, the dominant component of the peat bog vegetation (15). This ecosystem belongs to the Brazilian Atlantic Forest and is essential for the maintenance of the biome, which is one of the 25 biodiversity hot-spot in the world (38). Occurring in altitudes higher than 1,000 meters above sea level, these
Sphagnum peat bogs are large reservoirs of carbon which filter and regulate the water flow of the main hydrographic basins of southern Brazil (Curcio et al., unpublished data).
Sphagnum peat bogs are one of the oldest known landscape type in Brazil (3) and their unique environment for many plants and animals are also an extreme habitat for microorganisms due to their high acidity (pH 3.0–5.0), low temperature and low concentration of mineral nutrients (43). Due to the environmental and ecological significance of Sphagnum peat bogs in the global carbon budget and in the emission of methane, their microbial communities are of considerable interest. Up to now there is no record of microbiological studies of Sphagnum peat bogs in southern Brazil. In this study, we have used culture-independent SSU rRNA gene sequencing approach to determine the composition of the archaeal and bacterial communities in three acidic peatland regions from the southern Brazilian Atlantic Forest.
MATERIALS AND METHODS
Localization and site description
Histosols were collected in February 2008 from three different physiographic units from sites where the water table was at the peat surface level. In the Serra do Mar (25o 53.5’S; 48o 57.5’W), thesamples were collected from a depth of 20 cm below of the water table (SM20); in the Second Plateau (25o 16.4’S; 49o 49.5’W) from depths 20 (CG20) and 50 cm (CG50) below the water table and in the Third Plateau (26o 34.4’S; 51o 41.7’W) from 20 cm below the water table (PA20). The three chosen areas are preserved Sphagnum peat bogs from the southern Brazilian Atlantic Forest. Differences in the landscape of these ecosystems are related to the use of their surrounding areas. Adjacent to the Serra do Mar peatland is the upper mountain Atlantic Rainforest; to the Second Plateau, are pasture fields and to the Third Plateau, agricultural crops. In these areas the climate is temperate and humid without major dry periods. The annual precipitation average is between 1,400
and 2,200 mm and the annual temperature ranges mainly between 12 and 18oC (3). The acidic peatland histosol is dominantly covered with Sphagnum moss, containing species of the Poaceae and Cyperaceae and small shrubs of Asteraceae, Melastomataceae, Ericaceae, Eriocaulaceae and Verbenaceae families. Ten histosol samples were randomly collected from an area of approximately 400 m2 (20m x 20m) and mixed into a composite sample of each site. From each sample, approximately 100 grams of soil were transferred to Falcon tubes and kept on ice for DNA extraction. The rest of the samples was collected in sealed plastic bags, stored at room temperature and sent for chemical analysis to the Department of Soil and Agricultural Engineering of the Federal University of Paraná (UFPR, Brazil) (Table 1).
Histosol DNA extraction and quantification
One gram of histosol was used for nucleic acids extraction with the “Ultraclean Soil DNA kit” (MO BIO Laboratories) according to the manufacturer’s instructions. The DNA integrity was determined by electrophoresis in 1X TAE-0.8%
agarose gels and stained with ethidium bromide (0.5 g/mL).
PCR amplification
Bacterial and archaeal SSU rRNA genes were amplified from 50 ng of soil DNA by PCR. Prior to the PCR, samples were incubated with 0.6 μg of BSA per ng of DNA in a total volume of 11 μl for 45 min at 37°C to scavenge PCR inhibiting substances. After chilling on ice, in a PCR final volume of 50
were used for the amplification of the archaeal SSU rRNA gene. The following conditions were used for PCR with both primer sets: 3 min at 95 oC; 25 cycles of 45 s at 95oC, 45 s at 55oC and 1.5 min at 72oC; and a final extension for 10 min at 72oC. The quantity and quality of the amplification products were verified by gel electrophoresis in 1X TAE-1% agarose and analysed with the LabWorks™ 4.0 Imaging Analysis and Acquisition software (UVP Inc.).
SSU rRNA gene cloning and sequencing
Approximately 75 ng of SSU rRNA gene amplicons were ligated to 50 ng of pGEM-T easy vector (Promega), according to the manufacturer’s instructions. The ligation product was
transformed into Escherichia coli DH5 competent cells. Eight
clone libraries were constructed: four contained bacterial SSU rRNA gene inserts (SM20Bac, CG20Bac, CG50Bac and PA20Bac) and four contained archaeal SSU rRNA sequences (SM20Arq, CG20Arq, CG50Arq and PA20Arq). Plasmids were extracted by the alkaline lysis method in 96 well plates. Sequencing was performed using 250 ng of plasmid DNA, 3.25 pmol of primer (27F for Bacteria and 21F/958R for Archaea), 3 μL of ET terminator mix(GE Healthcare) and ultrapure H2O
to a final volume of 7.5 L, in 1 cycle of 1 min at 95oC; 35 cycles of 20 s at 94oC and 2 min at 62oC. Products were precipitated with three volumes of absolute ethanol, washed with 70% ethanol, dried and dissolved in deionized formamide. Sequencing was performed using a MegaBACE 1000 sequencer (GE Healthcare). Reads were trimmed for the removal of low quality bases using the Phred program (19). For the Archaea domain, the Phrap program (26) was used to assemble the reads from both primers used for sequencing into the SSU rRNA partial gene sequence and the Consed program was used to view and edit the sequence assembly (25). The obtained SSU rRNA gene sequences were deposited in the GenBank database under the accession no. HQ613951-HQ614492 (archaeal sequences) and HQ614493-HQ615057 (bacterial sequences).
Sequence analyses
SSU rRNA gene sequences were aligned and analyzed with RDP tools (release 10) (14) and with the Mothur program (47). The chimeras, if detected, were removed with Bellerophon using the Huber–Hugenholtz correction, Chimera Check or Pintail using as template the Greengenes database for Bacteria and Silva database for Archaea. Alignments were edited manually or with GBlocks (9). Nucleotide substitution models were selected by using PAUP* version 4.0b10 (52) and ModelTest (41). Sequences were clustered into OTU (Operational Taxonomic Unit - identity ≥ 97%). Phylogenies were constructed with the neighbor-joining algorithm by using the program MEGA version 4.0 (53). The similarity in the composition of the clone libraries was examined by two
methods: -LibShuff (46) and R (42) programs, using an
abundance matrix of OTUs. Renyi diversity profiles to rank prokaryotic communities according to diversity (33). The chi-square test was used to verify differences in the frequencies of the phyla in samples.
RESULTS AND DISCUSSION
Bacterial and archaeal communities from acidic peatlands
Plateau (Fig. 1A, PA20Bac) contained a higher number of representatives of Proteobacteria than Acidobacteria. Since the Proteobacteria/Acidobacteria ratio has been correlated to the soil trophic status (27, 49), PA20 probably diverged from the other samples in this characteristic because of the anthropic interference caused by agriculture in the surrounding areas. The peatland of the Second Plateau, showed the highest content of organic matter (Table 1) and the highest abundance of Acidobacteria (Fig. 1A). The relationship between the prevalence of Acidobacteria and soil composition can be explained in part by their particular metabolism, since the acidophillic Acidobacteria are oligotrophs, characterized by slow growth rates and metabolism of more refractory carbon substrates, a characteristic of peat soils (18).
The composition of the dominant groups in the Second Plateau site changed with depth of sample collection, and the Ktedonobacter genus (Bacteria_incertae_sedis phylum), which includes spore-forming, gram-positive filamentous bacteria (10), was the second most abundant group at the 50 cm depth (Fig. 1A). An increase in the abundance of gram-positive bacteria with depth in a soil profile was also observed by Fierer et al. (22). However, cluster analysis by Bray-Curtis distances
(Fig. 2B) and -Libshuff analysis (P>0.05) revealed that the
samples from depths of 20 and 50 cm of the same peatland (CG20Bac and CG50Bac libraries) are the most similar communities. These soil samples had very similar chemical composition (Table 1) which probably explains the high similarity of the two libraries.
Phylogenetic analysis of dominant groups showed that representatives of the Acidobacteria (Gp1, Gp2 and Gp3) and of the classes of Proteobacteria (Alpha, Beta, Gamma and Delta) were present in all samples, contributing to the high similarity of the libraries (Fig. S1 and S2). The taxa responsible for the observed differences belonged mainly to the least abundant phyla: Firmicutes, Verrucomicrobia, Bacteria_ incertae_sedis, Bacteroidetes, Chloroflexi and Actinobacteria (Fig. 1A).
One study of a Sphagnum peat bog in Western Siberia showed that Verrucomicrobia was the third most abundant phylum (17) and other studies based on SSU rRNA sequencing suggested that Verrucomicrobia represent one of the most dominant phyla of soil environments (29, 32). They typically represent between 2% and 8% of the total bacterial community, with the highest densities observed in the rhizosphere (32). However, no representative of this phylum was found in the peatland of Serra do Mar (SM20Bac library) (Fig. 1A). This was the only peatland area surrounded by the Atlantic Rainforest. A recent study of soil of the Atlantic Rainforest also found no representatives of this phylum (20).
Distribution analysis showed a high percentage of unique OTUs in all four bacterial libraries varying from 58 to 80% (Table 1). Only two OTUs belonging to the Gp1 and Gp2 genera were present in all libraries. Representatives of the class Deltaproteobacteria were also present in all pairwise comparisons (Table 2).
A total of 542 sequences of archaeal SSU rRNA spanning V2-V5 region with an average length of 800 bp were also obtained. In contrast to that observed for peatlands of the northern hemisphere (8, 30), methanogens do not appear to dominate archaeal communities of the southern Brazilian Atlantic Forest peatlands. In these ecosystems 90% of the sequences belonged to the Crenarchaeota phylum, and only 9% were from methanogens, which belonged to the Euryarchaeota phylum (Fig. 1B).
distributed archaeal group in terrestrial habitats. However, the ecophysiology and function of Crenarchaeota remain unclear due to the lack of cultured isolates.
As observed for Bacteria, the archaeal communities detected in samples from different depths of the same peatland (CG20Arq and CG50Arq libraries) were the most similar, but in contrast to the bacterial libraries, the SM20Arq and PA20Arq archaeal libraries exhibited the highest similarity (Fig. 2C). Phylogenetic analysis of crenarchaeotal groups showed that the representatives of MCG were responsible for the high similarity of the SM20Arq and PA20Arq libraries (Fig. S3). The four libraries shared two OTUs of MCG and TG (Table 2).
Soil depth seemed to influence the distribution of the archaeal taxa. The archaeal community from the sample collected at 50 cm showed a lower percentage of unshared OTUs (40.8%) than that from 20 cm (66.7% of unique OTUs) (Table 1).
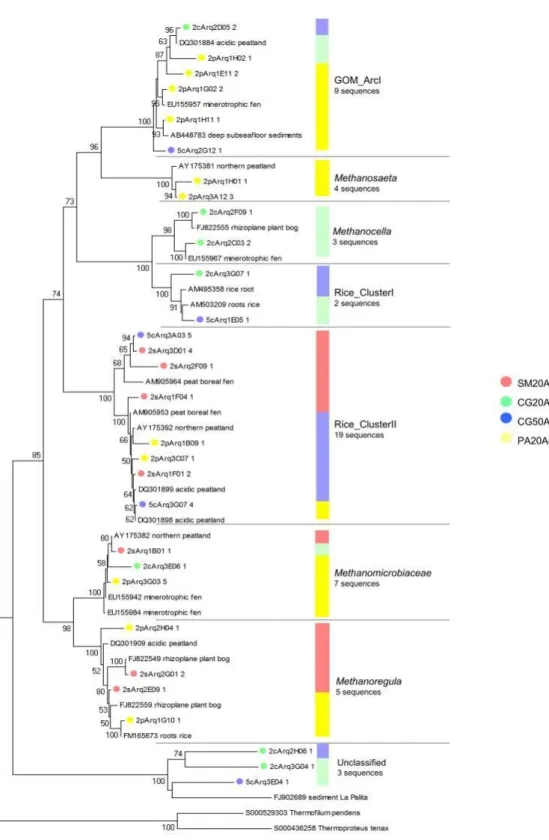
In this study, the SSU rRNA gene sequence of the following methanogens were found: Rice Cluster-I (RC-I), Rice Cluster-II (RC-II), Methanosaeta, Gulf of Mexico Arc I group (GOM Arc I), Methanomicrobiaceae, Candidatus Methanoregula and Methanocella (Fig. 3). Parwise comparisons between libraries indicated that SM20Arq and PA20Arq shared one OTU of the Methanomicrobiaceae family and one of the Rice_Cluster II group; CG20Arq and PA20Arq shared one OTU of the GOM_ArcI group; and CG50Arq and PA20Arq shared one OTU of the Rice_Cluster II (Table 2). No methanogenic OTU was shared between the libraries CG20Arq and CG50Arq or SM20Arq and CG20Arq.
The RC-I and RC-II groups have been found in different ecosystems with active methanogenesis, such as acidic peatlands and rice paddies (8, 12, 24). Members of the RC-I group, found only in the Second Plateau (CG20Arq and CG50Arq libraries) (Fig. 3), are characterized as hydrogenotrophic methanogens and have been found to produce methane near rice roots (45) by using the accumulated
H2, generated from the fermentation of secreted photosynthates (16). This group is particularly abundant in rice paddies, where it can make up 20 to 50% of the total number of methanogens (34). However it represented only 4% of the methanogens in our area of study, which is similar to other peatlands (7). RC-II was the most abundant methanogen group with representatives in the PA20Arq, SM20Arq and CG50Arq libraries (Fig. 3). Members of RC-II seem to tolerate a broad range of pH values, since sequences have been retrieved from acidic as well as neutral sites (2, 12, 31).
Sequences clustering with Methanoregula spp. were present in libraries SM20Arq and PA20Arq (Fig. 3). These are likely to represent hydrogenotrophic and/or formatotrophic methanogens, since members of this group are known to utilize H2/CO2 (4) or H2/CO2 or formate (57). This group is abundant in other oligotrophic peatlands (23, 50), and has been shown to grow in low-nutrient and low-ionic-strength medium and to be highly sensitive to oxygen (5), suggesting its adaptation to extreme anaerobic environments. Other sequences of the hydrogenotrophic orders Methanomicrobiales and Methanocellales were also found.
Taxa of the group GOM Arc I (36) present in PA20Arq, CG20Arq and CG50Arq (Fig. 3) were closest to uncultured archaea of sediment and peatland (6, 7, 39). Although this group is phylogenetically close to the group ANME-2 (Archaeal ANaerobic MEthane oxidizers, 36), there is no evidence of methane-oxidation by members of the GOM arc I.
The sequence related to acetoclastic Methanosaeta was found only in PA20Arq and comprised 11% of the total methanogens (Fig. 3). The absence of other acetotrophs belonging to the family Methanosarcinaceae in this peatland suggests a low concentration of acetate in this bog, since in ecosystems where acetate concentrations are high Methanosaeta are outcompeted by Methanosarcina (13, 21, 56).
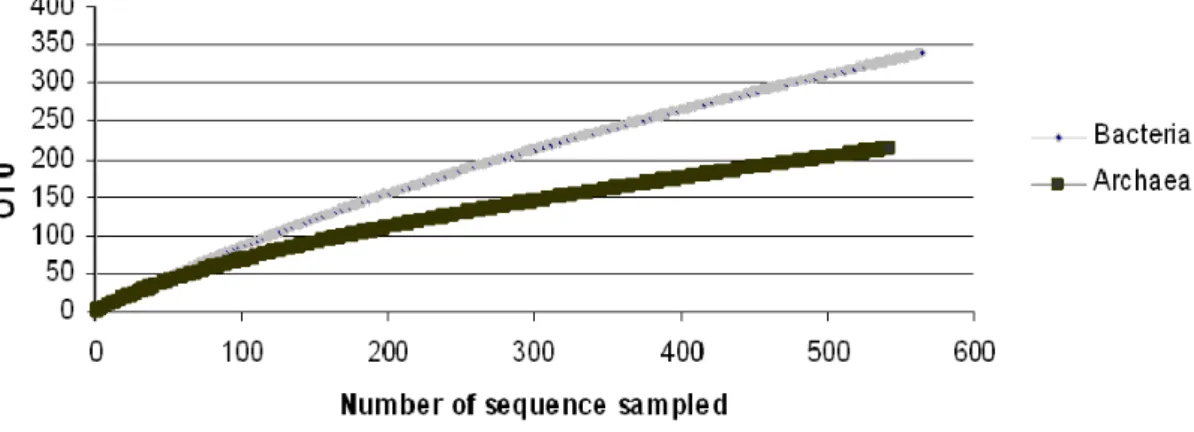
observed that in the majority of the studied ecosystems the bacterial richness was higher than archaeal richness, the southern Brazil acidic peatlands also had a higher richness of Bacteria than Archaea (Fig. 4). Besides, the Third Plateau (PA20) peatland showed higher procariotic diversity among the samples studied (Fig. 2A).
In conclusion, the predominance of hydrogenotrophic
methanogens (89% of the methanogens) suggests that the main production of CH4 occurs through the H2-CO2 pathway. This result is consistent with other studies, which showed that hydrogenotrophy is the dominant reaction in bogs (11, 23, 28, 35). Furthermore, this is also the first study to reveal the prokaryotic diversity in the southern Brazilian Atlantic Forest peatlands, showing a higher richness of Bacteria than Archaea.
Figure S1. Phylogenetic relationships among acidobacterial OTUs and their areas of origin. Each circle represents a different OTU and the number after its ID indicates the number of sequences that compose this OTU. Each colour represents a different area as shown in the picture. The bar indicates the proportion of sequences of each genus. Phylogenies were estimated by neighbor
Figure 2. Renyi diversity profiles and similarity dendograms based in OTU. (A) Comparison of the Renyi diversity profiles of the peatland
prokaryote communities. The profile values for alpha = 0, 1, 2 and infinity indicate the species richness, Shannon diversity index, logarithm of
the reciprocal Simpson diversity index and Berger Parker diversity index, respectively. If the profile for one sample was consistently higher than
the profile for another sample, the sample with the higher profile was considered more diverse. When curves for two communities intersect, this
means that they cannot be ranked. (B) and (C) show an average linkage clustering dendrogram based on the Bray–Curtis distances among
bacterial and archaeal communities, respectively.
Table 1. Distribution of OTUs and soil chemical attributesof the samples
Bacterial OTU Archaeal OTU
Sample
Unshared Shared Unshared Shared
pH CaCl2
g/kg C
g/kg OM
SM20 69 (80.2%) 17 (19.8%) 43 (74.1%) 15 (25.9%) 3.20 256.11 441.54
CG20 48 (60.7%) 31 (39.3%) 46 (66.7%) 23 (33.3%) 3.80 265.81 458.50
CG50 37 (58.7%) 26 (41.3%) 22 (40.8%) 32 (59.2%) 3.80 267.01 460.10
PA20 136 (80%) 34 (20%) 61 (69.3%) 27 (30.7%) 4.00 172.57 297.51
C= carbon; OM= organic matter.
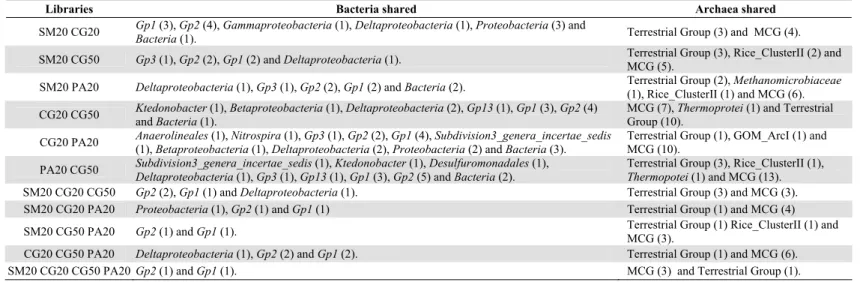
Table 2. Prokaryotic OTUs shared among the libraries. The sequences that compose the bacterial and archaeal OTUs were compared with
Ribosomal Database Project II and Silva database respectively. The number of OTUs that compose each taxon are shown in parentheses.
Libraries Bacteria shared Archaea shared
SM20 CG20 Gp1 (3), Gp2 (4), Gammaproteobacteria (1), Deltaproteobacteria (1), Proteobacteria (3) and
Bacteria (1). Terrestrial Group (3) and MCG (4).
SM20 CG50 Gp3 (1), Gp2 (2), Gp1 (2) and Deltaproteobacteria (1). Terrestrial Group (3), Rice_ClusterII (2) and MCG (5). SM20 PA20 Deltaproteobacteria (1), Gp3 (1), Gp2 (2), Gp1 (2) and Bacteria (2). Terrestrial Group (2), Methanomicrobiaceae
(1), Rice_ClusterII (1) and MCG (6). CG20 CG50 Ktedonobacter (1), Betaproteobacteria (1), Deltaproteobacteria (2), Gp13 (1), Gp1 (3), Gp2 (4)
and Bacteria (1).
MCG (7), Thermoprotei (1) and Terrestrial Group (10).
CG20 PA20 Anaerolineales (1), Nitrospira (1), Gp3 (1), Gp2 (2), Gp1 (4), Subdivision3_genera_incertae_sedis (1), Betaproteobacteria (1), Deltaproteobacteria (2), Proteobacteria (2) and Bacteria (3).
Terrestrial Group (1), GOM_ArcI (1) and MCG (10).
PA20 CG50 Subdivision3_genera_incertae_sedis (1), Ktedonobacter (1), Desulfuromonadales (1),
Deltaproteobacteria (1), Gp3 (1), Gp13 (1), Gp1 (3), Gp2 (5) and Bacteria (2).
Terrestrial Group (3), Rice_ClusterII (1),
Thermopotei (1) and MCG (13). SM20 CG20 CG50 Gp2 (2), Gp1 (1) and Deltaproteobacteria (1). Terrestrial Group (3) and MCG (3).
SM20 CG20 PA20 Proteobacteria (1), Gp2 (1) and Gp1 (1) Terrestrial Group (1) and MCG (4)
SM20 CG50 PA20 Gp2 (1) and Gp1 (1). Terrestrial Group (1) Rice_ClusterII (1) and
MCG (3).
CG20 CG50 PA20 Deltaproteobacteria (1), Gp2 (2) and Gp1 (2). Terrestrial Group (1) and MCG (6).
Figure S2. Phylogenetic relationships among proteobacterial OTU and their areas of origin. Each circle represents a different OTUand the number
after its ID indicates the number of sequences that compose this OTU. Each colour represents a different area as shown in the picture. The bar
indicates the proportion of sequences of each class. Phylogenies were estimated by neighbor joining with the TrN model and correction ( =
Figure 3. Phylogenetic relationships among methanogenics OTUsand their areas of origin. Each circle represents a different OTUand the number
after its ID indicates the number of sequences that compose this OTU. Each colour represents a different area as shown in the picture. The bar
indicates the proportion of sequences in each group. Sequences were compared with the NCBI and Silva database for the construction of the tree.
Phylogenies were estimated by neighbor joining with the TrN model and correction ( =1.0852). The tree was rooted using Thermofilum pendens
Figure S3. Phylogenetic relationships among crenarcheotal sequences and their origin. Each colour represents a different area as shown in
the picture. Sequences were classified using Silva database. Phylogenies were estimated by neighbor joining with the LogDet. Tree is
unrooted. The scale bar represents changes per nucleotide. Each symbol represents a different area. Clades of the Terrestrial Group (TG) and
Micellaneous Crearchaeota Group (MCG) are indicated on the tree.
ACKNOWLEDGEMENTS
We would like to thank the Brazilian Research Council (CNPq), INCT-Biological Nitrogen Fixation and Fundação Araucária of the Paraná State - Brazil for financial support. We thank Julieta Pie, Marilza Doroti Lamour and Roseli Prado for technical support, Valter Baura from sequencing reactions, Dr. Gustavo Ribas Curcio and Msc. Marcos Fernando Gluck Rachwal for help with data collection and soil physic-chemical analysis and Dr. M. Geoffrey Yates for critical reading of the manuscript.
REFERENCES
1. Aller, J.Y.; Kemp, P.F. (2008). Are Archaea inherently less diverse than Bacteria in the same environments? FEMS Microbiol. Ecol. 65(1), 74– 87.
2. Basiliko, N.; Yavitt, J.B.; Dees, P.M.; Merkel, S.M. (2003). Methane Biogeochemistry and Methanogen Communities in Two Northern Peatland Ecosystems, New York State. Geomicrobiol. J. 20(6), 563–577. 3. Behling, H. (2002). South and southeast Brazilian grasslands during Late
Quaternary times: a synthesis. Palaeogeogr. Palaeoclimatol. Palaeoecol.
177(2), 19–27.
4. Brauer, S.L.; Cadillo-Quiroz, H.; Ward, R.J.; Yavitt, J.B.; Zinder, S.H. (2011). Methanoregula boonei gen. nov., sp. nov., an acidiphilic methanogen isolated from an acidic peat bog. Int. J. Syst. Evol. Microbiol. 61(1), 45–52.
5. Bräuer, S.L.; Cadillo-Quiroz, H.; Yashiro, E.; Yavitt, J.B.; Zinder, S.H. (2006). Isolation of a novel acidiphilic methanogen from an acidic peat bog. Nature. 442(7099), 192–194.
6. Cadillo-Quiroz, H.; Brauer, S.; Yashiro, E.; Sun C.; Yavitt, J.; Zinder, S. (2006). Vertical profiles of methanogenesis and methanogens in two contrasting acidic peatlands in central New York State, USA. Environ. Microbiol. 8(8), 1428–1440.
7. Cadillo-Quiroz, H.; Yashiro, E.; Yavitt, J.B.; Zinder, S.H. (2008). Characterization of the archaeal community in a minerotrophic fen and terminal restriction fragment length polymorphism-directed isolation of a novel hydrogenotrophic methanogen. Appl. Environ.Microbiol. 74(7), 2059–2068.
8. Cadillo-Quiroz, H.; Yavitt, J.B.; Zinder S.H.; Thies J.E. (2010). Diversity and community structure of Archaea inhabiting the rhizoplane of two contrasting plants from an acidic bog. Microb. Ecol. 59(4), 757– 767.
9. Castresana, J. (2000). Selection of conserved blocks from multiple
alignments for their use in phylogenetic analysis. Mol. Biol. Evol. 17(4), 540–552.
10. Cavaletti, L.; Monciardini, P.; Bamonte, R.; Schumann, P.; Rohde, M.; Sosio, M.; Donadio, S. (2006). New lineage of filamentous, spore-forming, gram-positive bacteria from soil. Appl. Environ. Microbiol. 72(6), 4360–4369.
11. Chasar, L.S.; Chanton, J.P.; Glaser, P.H.; Siegel, D.I.; Rivers, J.S. (2000). Radiocarbon and stable carbon isotopic evidence for transport and transformation of dissolved organic carbon, dissolved inorganic carbon, and CH4 in a northern Minnesota peatland. Global Biogeochem. Cycles. 14(4), 1095–1108.
12. Chin, K.J.; Lukow, T.; Conrad, R. (1999). Effect of temperature on structure and function of the methanogenic archaeal community in an anoxic rice field soil. Appl. Environ. Microbiol. 65(6), 2341–2349. 13. Chin, K.J.; Lueders, T.; Friedrich, M.W.; Klose, M.; Conrad, R. (2004).
Archaeal community structure and pathway of methane formation on rice roots. Microb. Ecol. 47(1), 59–67.
14. Cole, J.R.; Wang, Q.; Cardenas, E.; Fish, J.; Chai, B.; Farris, R.J.; Kulam-Syed-Mohideen, A.S.; McGarrell, D.M.; Marsh, T.; Garrity, G.M.; Tiedje, J.M. (2009). The Ribosomal Database Project: improved alignments and new tools for rRNA analysis. Nucleic Acids Res. 37(Database issue), D141-145.
15. Daniels, R.; Eddy, A. (1985). Handbook of European Sphagna. Institute of Terrestrial Ecology. Abbots Ripton Huntingdon, Cambridgeshire, UK. 16. Dannenberg, S.; Conrad, R. (1999). Effect of rice plants on methane production and rhizospheric metabolism in paddy soil. Biogeochemistry. 45(1), 53–71.
17. Dedysh; S.N.; Pankratov, T.A.; Belova, S.E.; Kulichevskaya I.S.; Liesack W. (2006). Phylogenetic analysis and in situ identification of bacteria community composition in an acidic Sphagnum peat bog. Appl. Environ. Microbiol. 72(3), 2110–2117.
18. Eichorst, S.A.; Breznak, J.A.; Schmidt T.M. (2007). Isolation and characterization of soil bacteria that define Terriglobus gen. nov., in the phylum Acidobacteria. Appl. Environ. Microbiol. 73(8), 2708–2717. 19. Ewing, B.; Hillier, L.; Wendl, M.C.; Green, P. (1998). Base-calling of
automated sequencer traces using phred. I. Accuracy assessment.
Genome Res. 8(3), 175–185.
20. Faoro, H.; Alves, A.C.; Souza, E.M.; Rigo, L.U.; Cruz, L.M.; Al-Janabi, S.M.; Monteiro, R.A.; Baura, V.A.; Pedrosa, F.O. (2010). Influence of soil characteristics on the diversity of bacteria in the Southern Brazilian Atlantic Forest. Appl. Environ. Microbiol. 76(14), 4744–4749.
21. Fey, A.; Conrad, R. (2000). Effect of temperature on carbon and electron flow and on the archaeal community in methanogenic rice field soil.
Appl. Environ. Microbiol. 66(11), 4790–4797.
23. Galand, P.E.; Fritze, H.; Conrad, R.; Yrjälä, K. (2005). Pathways for methanogenesis and diversity of methanogenic archaea in three boreal peatland ecosystems. Appl. Environ. Microbiol. 71(4), 2195–2198. 24. Galand, P.E.; Saarnio, S.; Fritze, H.; Yrjälä, K. (2002). Depth related
diversity of methanogen Archaea in Finnish oligotrophic fen. FEMS Microbiol. Ecol. 42(3), 441–449.
25. Gordon, D.; Abajian, C.; Green P. (1998). Consed: a graphical tool for sequence finishing, Genome Res. 8(3), 195–202.
26. Green, P. (1994). PHRAP documentation. Available at: http://www.phrap.org.
27. Hartman, W.H.; Richardson, C.J.; Vilgalys, R.; Bruland, G.L. (2008). Environmental and anthropogenic controls over bacterial communities in wetland soils. Proc. Natl. Acad. Sci. U. S. A. 105(46), 17842–17847. 28. Horn, M.A.; Matthies, C.; Küsel, K.; Schramm, A.; Drake, H.L. (2003).
Hydrogenotrophic methanogenesis by moderately acid-tolerant methanogens of a methane-emitting acidic peat. Appl. Environ. Microbiol. 69(1), 74–83.
29. Janssen, P.H. (2006). Identifying the dominant soil bacterial taxa in libraries of 16S rRNA and 16S rRNA genes. Appl. Environ. Microbiol. 72(3), 1719–1728.
30. Juottonen, H.; Tuittila, E.S.; Juutinen, S.; Fritze, H.; Yrjälä, K. (2008). Seasonality of rDNA- and rRNA-derived archaeal communities and methanogenic potential in a boreal mire. ISME J. 2(11), 1157–1168. 31. Kemnitz, D.; Chin, K.J.; Bodelier, P.; Conrad R. (2004). Community
analysis of methanogenic archaea within a riparian flooding gradient.
Environ. Microbiol. 6(5), 449–461.
32. Kielak, A.; Pijl, A.S.; van Veen, J.A.; Kowalchuk, G.A. (2008). Differences in vegetation composition and plant species identity lead to only minor changes in soil-borne microbial communities in a former arable field. FEMS Microbiol. Ecol. 63(3), 372–382.
33. Kindt, R.; Coe, R. (2005). Tree Diversity Analysis. A Manual and Software for Common Statistical Methods and Biodiversity Studies.
World Agroforestry Centre. ICRAF, Nairobi.
34. Krüger, M.; Frenzel, P.; Kemnitz, D.; Conrad, R. (2005). Activity, structure and dynamics of the methanogenic archaeal community in a flooded Italian rice field. FEMS Microbiol. Ecol. 51(3), 323–331. 35. Lansdown, J.; Quay, P.; King S. (1992). CH4 production via CO2
reduction in a temperate bog: A source of 13C-depIeted CH4. Geochim. Cosmochim. Acta. 56(9), 3493–3503.
36. Lloyd, K.G.; Lapham, L.; Teske A. (2006) An anaerobic methane-oxidizing community of ANME-1b archaea in hypersaline Gulf of Mexico sediments. Appl. Environ. Microbiol. 72(11), 7218–7230. 37. Moyer, C.L.; Tiedje, J.M.; Dobbs, F.C.; Karl, D.M. (1998). Diversity of
deep-sea hydrothermal vent Archaea from Loihi Seamount, Hawaii.
Deep Sea Res. II. 45(1), 303–317.
38. Myers, N.; Mittermeier, R.A.; Mittermeier, C.G.; Fonseca, G.A.; Kent, J.
(2000). Biodiversity hotspots for conservation priorities. Nature. 403(6772), 853–858.
39. Nunoura, T.; Soffientino, B.; Blazejak, A.; Kakuta, J.; Oida, H.; Schippers, A.; Takai, K. (2009). Subseafloor microbial communities associated with rapid turbidite deposition in the Gulf of Mexico continental slope (IODP Expedition 308). FEMS Microbiol. Ecol. 69(3), 410–424.
40. Oline, D.K.; Schmidt, S.K.; Grant, M.C. (2006). Biogeography and landscape-scale diversity of the dominant Crenarchaeota of soil. Microb. Ecol. 52(3), 480–490.
41. Posada, D.; Crandall, K.A. (1998). MODELTEST: testing the model of DNA substitution. Bioinformatics. 14(9), 817–818.
42. R Development Core Team. (2007). R: A Language and Environment for Statistical Computing. R Foundation for Statistical Computing: Vienna, Austria. http://www.R-project.org.
43. Richardson, C.J.; Tilton, D.L.; Kadlec, J.A.; Chamie, J.P.M.; Wentz, W.A. (1978). Nutrient dynamics of northern wetland ecosystems. In: Good, R.E.; Whigham, D.F.; Simpson, R.L. (eds.) Freshwater Wetlands: Ecological Processes and Management Potential. Academic Press, New York, USA. p. 217–241.
44. Rieley, J.O.; Wust, R.A.J.; Jauhiainen, J.; Page, S.E.; Ritzema, H.; Wosten, H.; Hooijer, A.; Siegert, F.; Limin, S.; Vasander, H.; Stahlhut, M. (2008). Tropical Peatlands: Carbon stores, carbon gas emissions and contribution to climate change processes. In: Strack, M. Peatlands and climate change. Peat Society, Calgary, Canada. p.44-70.
45. Sakai, S.; Imachi, H.; Sekiguchi, Y.; Ohashi, A.; Harada, H.; Kamagata Y. (2007). Isolation of key methanogens for global methane emission from rice paddy fields: a novel isolate affiliated with the clone cluster rice cluster I. Appl. Environ. Microbiol. 73(13), 4326–4331.
46. Schloss, P. D.; Larget, B.R.; Handelsman J. (2004). Integration of microbial ecology and statistics: a test to compare gene libraries. Appl. Environ. Microbiol. 70(9), 5485–5492.
47. Schloss, P.D.; Westcott, S.L.; Ryabin, T.; Hall, J.R.; Hartmann, M.; Hollister, E.B.; Lesniewski, R.A.; Oakley, B.B.; Parks, D.H.; Robinson, C.J.; Sahl J.W.; Stres, B.; Thallinger, G.G.; Horn, D.J.V.; Weber, C.F. (2009). Introducing mothur: open-source, platform-independent, community-supported software for describing and comparing microbial communities. Appl. Environ. Microbiol. 75(23), 7537–7541.
48. Sliwinski, M.K.; Goodman, R.M. (2004). Comparison of crenarchaeal consortia inhabiting the rhizosphere of diverse terrestrial plants with those in bulk soil in native environments. Appl. Environ. Microbiol. 70(3), 1821–1826.
2284–2291.
50. Steinberg, L. M.; Regan, J. M. (2008). Phylogenetic comparison of the methanogenic communities from an acidic, oligotrophic fen and an anaerobic digester treating municipal wastewater sludge. Appl. Environ. Microbiol. 74(21), 6663–6671.
51. Suzuki, M. T.; Giovannoni, S. J. (1996). Bias caused by template annealing in the amplification of mixtures of 16S rRNA genes by PCR.
Appl. Environ. Microbiol. 62(2), 625–630.
52. Swofford, D. L. (2000). PAUP*: Phylogenetic Analysis Using Parsimony (and Other Methods), Version 4. Sinauer Associates: Sunderland, MA.
53. Tamura, K.; Dudley, J.; Nei, M.; Kumar, S. (2007). MEGA4: Molecular Evolutionary Genetics Analysis (MEGA) software, Version 4. Mol. Biol.
Evol. 24(8), 1596–1599.
54. Teske, A. (2006). Microbial Communities of Deep Marine Subsurface Sediments: Molecular and Cultivation Surveys. Geomicrobiol. J. 23(6), 357–368.
55. Valladares, G. S. (2003). Caracterização de Organossolos, auxílio à sua classificação. Seropédica, Brazil, 129p. (PhD thesis. UFRJ).
56. Weber, S. (2001). Methanogenic populations involved in the degradation of rice straw in anoxic paddy soil. FEMS Microbiol. Ecol. 38(1), 11–20. 57. Yashiro, Y.; Sakai, S.; Ehara, M.; Miyazaki, M.; Yamaguchi, T.; Imachi
H. (2011). Methanoregula formicica sp. nov., a methane-producing archaeon isolated from methanogenic sludge. Int. J. Syst. Evol. Microbiol. 61(1), 53–59.