v.14, n.2, p.148–154, 2010
Campina Grande, PB, UAEA/UFCG – http://www.agriambi.com.br Protocolo 065.08 – 04/04/2008 • Aprovado em 16/06/2009
Infrared thermometry for drought phenotyping of inter
and intra specific upland rice lines
Cleber M. Guimarães1, Luís F. Stone1, Mathias Lorieux2, Jaison P. de Oliveira1, Grasielli C. de O. Alencar3 & Rozângela A. A. Dias3
ABSTRACT
The purpose of the present study was to evaluate the use of infrared thermometry in the characterization of inter specific (Oryza glaberrima x Oryza sativa cv Caiapó) and intra specific upland rice lines for drought tolerance. The experiment, carried out at Porangatu in the State of Goiás, was submitted to adequate soil moisture for up to 30 days following emer-gence when a moderate water stress treatment was imposed (about 50% of the applied irrigation in a control plot in which adequate conditions of soil moisture were maintained). It has been observed that lines with higher grain yields under water stress produced taller plants with denser panicles and well-formed grains as well as lower spikelet sterility. A positive correlation between canopy temperature and spikelet sterility was observed; and a negative correlation ex-isted between canopy temperature and 100-grain weight, plant height, tiller fertility, and grain yield. Except for tiller fertility, all components showed correlation with grain yield; in the case of spikelet sterility, the relationship was nega-tive. It has been inferred that O. glaberrima confers to its lines higher rusticity where water stress is concerned, and that infrared thermometry is an important supporting tool for phenotyping drought tolerance.
Key words: O. glaberrima, O. sativa, water stress, spikelet sterility
Termometria infravermelha na fenotipagem para resistência
à seca de linhagens inter e intraespecíficas de arroz
RESUMO
Propôs-se avaliar, no presente estudo, a técnica da termometria ao infravermelho na caracterização de linhagens interespecíficas (Oryza glaberrima x Oryzasativa cv Caiapó) e intraespecíficas de arroz para tolerância a seca. O experimento, conduzido em Porangatu, GO, foi submetido a condições adequadas de umidade no solo até 30 dias após a emergência, quando então foi implantado um tratamento com deficiência hídrica moderada (aproximadamente 50% da irrigação aplicada em uma parcela testemunha, com condições adequadas de umidade no solo). Verificou-se que as linhagens mais produtivas em condições de deficiência hídrica apresentaram plantas mais altas, com panículas mais densas e com grãos mais bem formados, com menor esterilidade de espiguetas. Observou-se, também, que a temperatura das folhas se correlacionou positivamente com a esterilidade de espiguetas e negativamente com a massa de 100 grãos, altura das plantas, fertilidade de perfilhos e produtividade. Exceto a fertilidade de perfilhos, os demais componentes se correlacionaram com a produtividade de grãos, sendo que com a esterilidade de espiguetas a correlação foi negativa. Concluiu-se que a O. glaberrima confere, às suas progênies, maior rusticidade à deficiência hídrica e que a termometria ao infravermelho é uma técnica auxiliar importante na fenotipagem para tolerância a seca.
Palavras-chave: O. glaberrima, O. sativa, estresse hídrico, esterilidade de espiguetas
1Embrapa Arroz e Feijão, Rod. GO 462, Km 12, CP 179, CEP 75375-000, Santo Antônio de Goiás, GO. Fone: (62) 3533-2178. E-mail: cleber@cnpaf.embrapa.br;
stone@cnpaf.embrapa.br; jaison@cnpaf.embrapa.br
2Centro Internacional de Agricultura Tropical, Apartado Aéreo 6713, Cali, Colombia. E-mail: m.lorieux@cgiar.org
3Departamento de Biologia/Universidade Estadual de Goiás, Unidade Universitária de Porangatu, CEP 76550-000, Porangatu, GO. Fone: (62) 3362-2128.
INTRODUCTION
Water stress causes considerable reduction in upland rice yields even in regions with favorable climate because it is common to have periods when rain water is not enough to meet the crop demands. On the other hand, drought tolerance vari-ability in upland rice lines is a well known fact (Cabuslay et al., 2002; Lafitte & Bennett, 2002; Heinemann & Stone, 2009). This has certainly set up differences in the effectiveness of the mechanisms related to the absorption and contention of wa-ter losses. Being triggered by the environment wawa-ter shortage, these mechanisms define the plant’s water status which may be assessed by considering the plant’s curled leaves and by its yield (Gupta & O’Toole, 1986), or still inferred by the ther-mal state of the plant under direct solar radiation (Leinonen & Jones, 2004). According to Jackson et al. (1981), water stress causes the stomata to partially close reducing transpi-ration and cause leaf temperature to go up when exposed to solar radiation. This is brought about mainly by heat absorp-tion of the environment via the water evaporaabsorp-tion process. The higher the transpiration, the higher will be the heat absorp-tion. Rice varieties with deeper root system exhibit lower spike-let sterility rates in areas under stressful air temperature as these varieties present lower leaf temperature as a result of higher transpiration rate (IRRI, 1983). Cabuslay et al. (2002) state that rice varieties with moderate water stress tolerance did present higher relative transpiration rates, i.e. they showed high transpiration under stress as compared to stress free con-ditions. Hyrayama et al. (2006) have also observed that up-land rice varieties with deeper root systems exhibited lower leaf temperature, and that leaf temperature was correlated to transpiration rates and photosynthesis. Zhang et al. (2007) have also stated that the canopy’s greatest temperature differ-ence between the water stressed and unstressed treatment occured at 13:00 h. Su & Yang (1998) verified that during the tillering and panicle formation, smaller variations occur as compared to those that take place during the plant’s physi-ologic maturation.
According to Lafitte et al. (2003) and Guimarães et al. (2006), the use of the canopy temperature measurement tech-nique to select plants that present better water status – if conducted appropriately together with other evaluating meth-ods – will be a useful tool for phenotyping drought tolerant cultivars, for it is fast, non-destructive, and does not call for tissues or intense movement within the plots. It is the pur-pose of the present work to determine the efficiency of in-frared thermometry as a secondary component in the characterization of drought tolerance of the EMBRAPA Rice and Beans lines along with inter specific lines among the
Oryzaglaberrima x Oryzasativa cv Caiapó of the Interna-tional Center of Tropical Agriculture.
MATERIAL
AND METHODSThe study was conducted at the SEAGRO Experimental Station in Porangatu, Goiás: latitude 13° 27’, longitude 49° 10’, altitude 600 m, climate Aw, savanna tropical, mega
thermo, according to Köppen classification. The annual mean air temperature is 26 °C. The month of June presents the lowest minimum air temperature (19.9 °C), while the month of September exhibits the maximum air temperature (35.5 °C). The pluvial regime is well defined, in other words, the rainy period from October to April and the dry period from May to September are very distinct. The predominant soil is the Distrophic Red Latosol.
A 7 x 7 lattice experimental design was used with three replications, in which 49 lines were positioned in the plots, being 11 fixed lines (two selected lines of EMBRAPA Rice and Beans, BRA 1600 and BRA 1618, and nine commercial cultivars: Bonança, Caiapó, CNA 9025, CNA 9045, Curinga, Guarani, Liderança, Primavera and Soberana), and 38 re-maining inter specific lines from the crossing between the Caiapó cultivar and the Oryzaglaberrima species.
The sowing of lines/cultivars was completed on May 9, 2006, in three-rows, 3 m long and 35 cm apart with 80 seeds m-1. When the experiment was conducted, the mean
maximum temperature was 34.3 °C, the mean minimum tem-perature was 19.4 °C, and the mean temtem-perature was 26.2 °C. Plant requirement of nitrogen, phosphorous and potassium was provided by utilizing 12, 90 and 48 kg ha-1 of N, P
2O5
and K2O, respectively. In addition to that, 20 kg ha-1 of zinc
sulphate was added to it, and 30 kg ha-1 of N was applied as
top dressing at the panicle initiation. Weed control was car-ried out via oxidation at 1000 g ha-1 as pre-emergency.
The cultivar/lines were submitted to suitable conditions of soil water, -0,025 MPa in the depth of 15 cm (Stone et al., 1986), until the crop got established, 30 days after the emergency period. After that, it was applied a treatment for moderate water deficit, approximately 50% irrigation em-ployed on a control plot that was conducted along the ex-periment. In this plot, irrigation was controlled by means of tensiometers. Irrigations of approximately 38 mm were ap-plied when the soil water potential at a depth of 15 cm reached the pre-established value.
The following variables were evaluated: grain yield, spikelet sterility, number of grains per panicle, tiller fertil-ity, number of panicles per square meter, 100-grain weight, flowering, considering the number of days after emergency (DAE), and plant height, as established by conventional methods. The water status of plants was obtained through temperature readings of the canopy with the help of a Fluke 66 model infrared thermometer with resolution of 0.1 °C and 1% precision, during the reproductive period, at 70, 71, 84 and 90 DAE, as asserted by Guimarães et al. (2006). Two measurements were taken in each plot in all repetitions dur-ing the period of higher atmospheric demand – between 13:00 and 15:00 h – in order to better discriminate the geno-types that are more sensitive to water stress. The harvest index (HI) was determined along a one-meter long row where the HI = GY/(GY + B), being GY the grain yield and B, the dry biomass of shoot biomass determined at harvest time, based on 0,35 m2 in all repetitions. The drying of biomass
With the help of multivariable analysis and by using the hierarchical method for grouping via Euclidean distance and considering mainly the grain yield component, the lines were distributed into groups of ten, and then submitted to the t (p < 0.05) test for comparison between the means. A corre-lation analysis was also conducted between all evaluated com-ponents
RESULTS
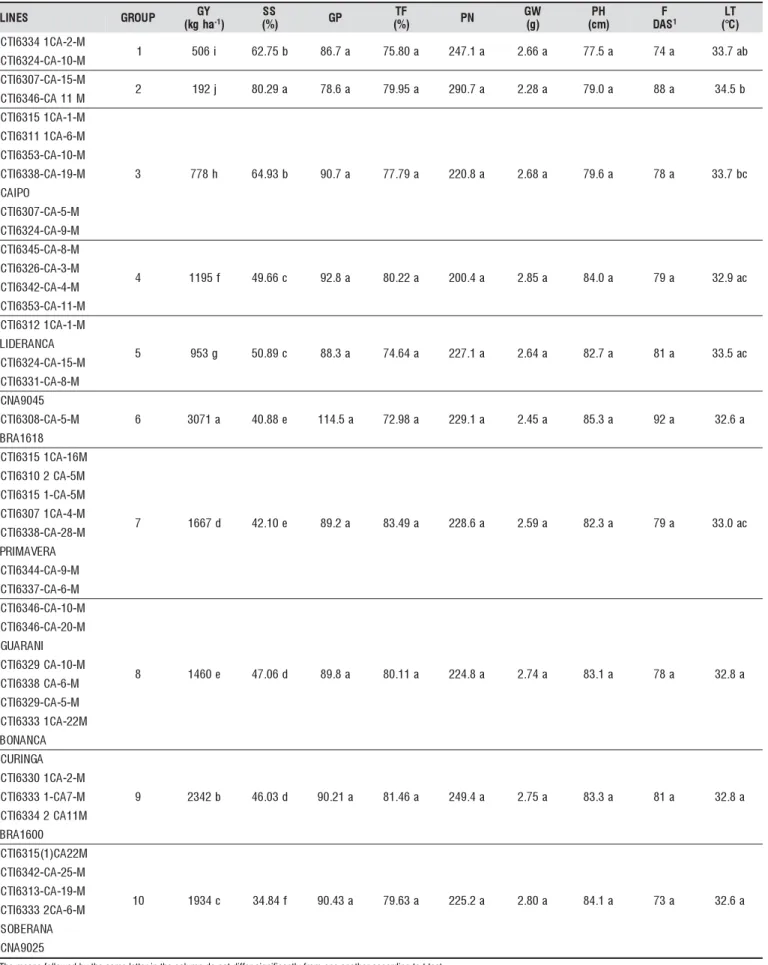
AND DISCUSSIONTable 1 shows the distribution of lines into groups of ten, based on multivariable analysis via Euclidean distance, con-sidering the mean grain yield values. It was seen that the groups’ mean productivity differed significantly from one another. This was also seen to happen in connection with spikelet sterility and the water state of the groups’ lines, which have been inferred from canopy temperature (Table 2). The most productive group under water stress was made up of inter specific lines CNA 9045 (BRS Monarca) and BRA 1618, and inter specific CT16308-CA-5-M, which produced around 3,071 kg ha-1. The second most
produc-tive group consisted of the Curinga, CT16330-1-CA-2-M, CT16333-1-CA-7-M, CT16334-2-CA-11-M and BRA 1600 lines, which produced on average 2,342 kg ha-1 (Table 2);
finally, the least productive group was made up of inter spe-cific lines CTI6307-CA-15-M and CTI6346-CA 11 M, and produced on average 192 kg ha-1.
It has been seen that the grain yield of the evaluated lines under water deficit conditions was correlated negatively to spikelet sterility and leaf temperature, and positively to the number of grain per panicle, the 100-grain weight, and plant height (Table 3). This behavior was maintained by most of the groups: group 6 – which was the most productive – pre-sented low spikelet sterility, panicles with a larger number of grains and taller plants when compared to the least pro-ductive groups (1, 2 and 3). Therefore, the most propro-ductive lines under water deficit conditions are the one that have exhibited much higher height and panicles with more well-formed grains, and with the least sterile spikelet. On the other hand, line productivity under these water conditions was not influenced by the tiller fertility, number of panicles per square meter; neither was it influenced by the flowering date. The cycle of development of the plants had no impact on pro-ductive behavior in conditions of water deficit; probably, because of the time and the intensity of water stress.
Arf et al. (2001) and Rodrigues et al. (2004) verified that under water deficit the rice cycle was prolonged, having shown a reduction in the height of the plants, in the num-ber of panicles per m2, in grain weight and in productivity.
Lafitte & Courtois (2002) and Heinemann & Stone (2009) observed that the occurrence of water deficit close to the flow-ering period reduces productivity drastically because of an increase in spikelet sterility, which is caused by the mini-mum water potential in the leaves and in the panicles, de-veloped during the period of water deficit (Cruz & O’Toole, 1984). Fukai & Cooper (1995) confirmed that among the lines examined by Yoshida & Hasegawa (1982), the ones
most adapted under water scarcity exhibited greater height and lesser tillering. Their roots were fewer but far more ro-bust and deeper, with better distribution of secondary and tertiary ramifications, according to the soil profile. These roots have larger external diameter and larger xylem cells and offer less resistance to water flux. These are character-istics that reflect on the water status of the plants and which can be assessed by the relative water content, water poten-tial, or even inferred by the curling level of the leaves or by their temperature. However, plants that produce more tillers are inclined to have more roots, especially in the secondary and tertiary tillers that develop later and in which the roots are shorter (O’Toole & Moya, 1978).
More productive lines under water deficiency conditions presented lower mean temperatures during reproductive pe-riod which was evaluated in a pepe-riod ranging from 70 to 90 days after emergency (Table 3). Similar development was maintained by the groupings. Group 6 – the most produc-tive – presented lower canopy temperature and, consequently, better water status in comparison to those less productive: groups 1, 2 and 3.
Hirayama et al. (2006) have also noticed that canopy tem-perature showed significant relationships with grain yield, photosynthesis rate and transpiration. The authors have agreed that rice cultivars under lower canopy temperature maintain higher transpiration and higher photosynthetic rates and produce better under upland conditions on account of deeper root system giving rise to better water conditions.
Canopy temperature was also correlated positively with spikelet sterility and negatively with 100-grain weight, plant height and tiller fertility. Similarly, these variables – except for tiller fertility – also correlated with grain yield. As a re-sult, this suggests that the use of canopy temperature for selecting plants with better water status (Guimarães et al., 2006) proves to be a useful tool for the drought tolerance phenotyping, for it is fast, non-destructive and does not re-quire plant tissue or intense mobility in the plots.
The results obtained corroborate with those presented in IRRI (1983) where it was demonstrated that rice cultivars with deeper root systems presented less spikelet sterility on account of lower canopy temperature. Liu et al. (2005) veri-fied that rice plants with higher capability of drought toler-ance held higher water potential in their leaves and lower dossel temperature producing less spikelet sterility.
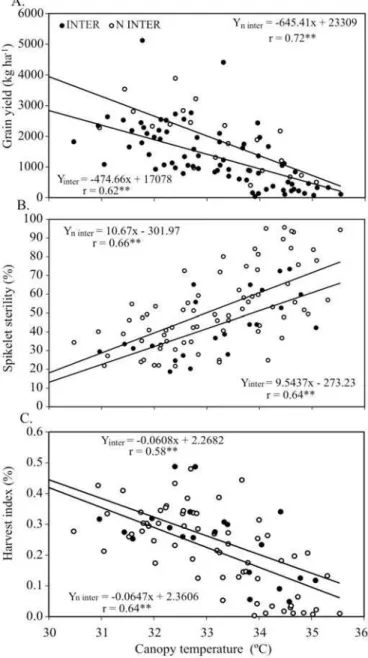
As it can be seen in Figure 1A, the more productive lines under water deficiency, both the inter specifics and the non-inter specific, presented lower leaf temperature during the reproductive period – from 68 to 88 days following emer-gence. It was also verified that both inter specific lines and those non-inter specific pointed towards linear reduction in grain yield with an increase in canopy temperature, but at different intensities. The inter specific population presented a decrease in productivity of 475 kg °C-1, whereas with the
non-inter specific lines this reduction was of 645 kg °C-1; data
Table 1. Grain yield (GY), spikelet sterility (SS), number of grains per panicle (GP), tiller fertility (TF) number of panicles per m2 (PN), 100-grain weight (GW), plant height (PH), flowering (F) and leaf temperature (LT) of groups, taking into account the grain yield component under water deficit of the advanced rice lines and the inter specific (Oryza glaberrima x Oryza sativa cv Caiapó) lines
S E N I
L GROUP (kgGhYa-1)
S S
) %
( GP
F T
) %
( PN
W G ) g ( H P ) m c ( F S A D 1 T L (° )C
M -2 -A C 1 4 3 3 6 I T C
1 506i 62.75b 86.7a 75.80a 247.1a 2.66a 77.5a 74a 33.7ab
M -0 1 -A C -4 2 3 6 I T C M -5 1 -A C -7 0 3 6 I T C
2 192j 80.29a 78.6a 79.95a 290.7a 2.28a 79.0a 88a 34.5b
M 1 1 A C -6 4 3 6 I T C M -1 -A C 1 5 1 3 6 I T C
3 778h 64.93b 90.7a 77.79a 220.8a 2.68a 79.6a 78a 33.7bc
M -6 -A C 1 1 1 3 6 I T C M -0 1 -A C -3 5 3 6 I T C M -9 1 -A C -8 3 3 6 I T C O P I A C M -5 -A C -7 0 3 6 I T C M -9 -A C -4 2 3 6 I T C M -8 -A C -5 4 3 6 I T C
4 1195f 49.66c 92.8a 80.22a 200.4a 2.85a 84.0a 79a 32.9ac
M -3 -A C -6 2 3 6 I T C M -4 -A C -2 4 3 6 I T C M -1 1 -A C -3 5 3 6 I T C M -1 -A C 1 2 1 3 6 I T C
5 953g 50.89c 88.3a 74.64a 227.1a 2.64a 82.7a 81a 33.5ac
A C N A R E D I L M -5 1 -A C -4 2 3 6 I T C M -8 -A C -1 3 3 6 I T C 5 4 0 9 A N C
6 3071a 40.88e 114.5a 72.98a 229.1a 2.45a 85.3a 92a 32.6a
M -5 -A C -8 0 3 6 I T C 8 1 6 1 A R B M 6 1 -A C 1 5 1 3 6 I T C
7 1667d 42.10e 89.2a 83.49a 228.6a 2.59a 82.3a 79a 33.0ac
M 5 -A C 2 0 1 3 6 I T C M 5 -A C -1 5 1 3 6 I T C M -4 -A C 1 7 0 3 6 I T C M -8 2 -A C -8 3 3 6 I T C A R E V A M I R P M -9 -A C -4 4 3 6 I T C M -6 -A C -7 3 3 6 I T C M -0 1 -A C -6 4 3 6 I T C
8 1460e 47.06d 89.8a 80.11a 224.8a 2.74a 83.1a 78a 32.8a
M -0 2 -A C -6 4 3 6 I T C I N A R A U G M -0 1 -A C 9 2 3 6 I T C M -6 -A C 8 3 3 6 I T C M -5 -A C -9 2 3 6 I T C M 2 2 -A C 1 3 3 3 6 I T C A C N A N O B A G N I R U C
9 2342b 46.03d 90.21a 81.46a 249.4a 2.75a 83.3a 81a 32.8a
M -2 -A C 1 0 3 3 6 I T C M -7 A C -1 3 3 3 6 I T C M 1 1 A C 2 4 3 3 6 I T C 0 0 6 1 A R B M 2 2 A C ) 1 ( 5 1 3 6 I T C 0
1 1934c 34.84f 90.43a 79.63a 225.2a 2.80a 84.1a 73a 32.6a
M -5 2 -A C -2 4 3 6 I T C M -9 1 -A C -3 1 3 6 I T C M -6 -A C 2 3 3 3 6 I T C A N A R E B O S 5 2 0 9 A N C
The means followed by the same letter in the column do not differ significantly from one another according to t test
of root system in spite of grain production. These plants are less productive, but they endure effectively the periods of water deficit, for they possess greater capacity for exploring deeper ground water. Hyrayama et al. (2006) also verified that F4 lines of the cultivar Kantomochi 168, with higher drought tolerance, when compared to the F4 lines of the cultivar Norinmchi, of medium drought tolerance, exhibited lower canopy temperature, a trend similar to that found in F5. The authors concluded that this approach is capable of estimating drought tolerance and has proved superior to the more conventional methods (Guimarães et al., 2006). This method constitutes, therefore, a rather useful tool for select-ing lines under drought conditions.
Lines at lower temperatures under water deficit condi-tions, besides the fact they are taller and present higher pro-ductivity, they produce less sterile spikelet, more fertile tillers and greater 100-grain weight. As observed in grain yield, canopy temperature does not correlate with the num-ber of days for flowering. The cycle of plant development did not interfere with its water status not affecting produc-tivity of lines, on the other hand this variable correlated positively with the spikelet sterility, and negatively with tiller fertility and l00-grain weight.
Garrity & O’Toole (1995) observed that the canopy tem-perature during the reproductive phase correlated signifi-cantly with grain yield. They also verified significant differ-ences between the evaluated lines.
Table 2. Summary of the analysis of variance of the groups considering grain yield under water deficit conditions as shown by the multivariable regression analysis for grain yield (GY), spikelet sterility (SS), number of grains per panicle (GP), tiller fertility (TF), number of panicles per m2 (PN), 100-grain weight (GW), plant height (PH), flowering (F) and leaf temperature (LT)
v
S Df Meansquare
GY(kgha-1) SS(%) GP TF(%) PN GW(g) PH(cm) FDAS1 LT ( C° )
l e d o
M 9 2548275.71** 664.22** 231.69ns 46.80ns 1593.6ns 0.09ns 20.69ns 104.00ns 1.24** r
o r r
E 39 14738.03 149.18 281.17 53.5 1192.8 0.15 69.63 111.59 0.47
) % ( v
C 8,15 24.75 18.43 9.21 15.05 14.30 10.13 13.32 2.06
SV – source of variation, DF – degrees of freedom
1 DAS – days after sowing; ns – F non-significant at 5% ** – F significant at 1%
Table 3. Simple correlation coefficient between the mean grain yield (GY) spikelet sterility (SS), number of grains per panicle (GP), tiller fertility (TF), number of panicles per m2 (PN), 100-grain weight (GW), plant height (PH), flowering (F) and leaf temperature (LT)
S
S 1 GP TF PN GW PH F LT
Y
G - .0563 0.312 0.148 -0.059 0.232 0.407 -0.025 -0.619 0.001 0.002 0.145 0.564 0.022 0.001 0.809 0.001 S
S 0.041 -0.322 0.082 -0.475 -0.468 0.354 0.641 5
8 6 .
0 0.001 0.421 0.001 0.001 0.001 0.001 P
G -0.044 -0.206 -0.190 0.153 0.293 -0.036 5
6 6 .
0 0.042 0.060 0.133 0.003 0.725 F
T 0.404 0.255 0.318 0.322 -0.211
1 0 0 .
0 0.011 0.001 0.001 0.037 N
P 0.002 -0.089 -0.023 0.122
7 8 9 .
0 0.381 0.821 0.230 W
G 0.300 -0.508 -0.262
3 0 0 .
0 0.001 0.009 H
P -0.174 -0.541
6 8 0 .
0 0.001
F 0.188
4 6 0 . 0
1 In each column, the first value corresponds to the correlation coefficient and the second value
refers to level of significance
Furthermore, one can add that the infrared thermometry has been a rather useful tool for phenotyping drought tolerance in a number of crops. Positive results have been obtained in as-sessing the following crops: wheat (Blum et al., 1982), maize (Chaudhuri et al., 1986) and cotton (Hatfied et al., 1987).
The relation between the spikelet sterility of inter specific lines and non-inter specific lines and canopy temperature has been described through linear equations with rather similar angular coefficients (Figure 1B). It has been seen, however, that non-inter specific lines present greater spikelet sterility under the same canopy temperature, possibly because of the non prioritization of carbohydrate translocation to the root system, as has been previously described. Inter specific lines, for presenting lower productivity sensitivity to canopy tem-perature effect due to smaller spikelet sterility, do present a higher harvest index (Figure 1C).
CONCLUSIONS
1. The most productive lines under water deficiency are those with higher height and panicle with a greater number of better formed grains with lower sterile spikelets.
2. Leaf temperature correlates negatively with grain yield, 100-grain weight, plant height and tiller fertility; and posi-tively with spikelet sterility.
3. If adequately conducted, together with other evalua-tions, infrared thermometry is a useful tool for phenotyping drought tolerance of inter and intra specific lines because of its fast and non-invasive use.
ACKNOWLEDGMENTS
Authors want to express their thanks to Ramatis Justino da Silva for his invaluable help and to the Generation Project for the financial support without which this work would not have been possible.
LITERATURE CITED
Arf., O.; Rodrigues, R. A. F.; Sá, M. E. de; Crusciol, C. A. C. Resposta de cultivares de arroz de sequeiro ao preparo do solo e à irrigação por aspersão. Pesquisa Agropecuária Brasileira, v.36, p.871-879, 2001.
Blum, A.; Mayer, J.; Gozlan, G. Infrared thermal sensing of plant canopies as a screening technique for dehydration avoidance in wheat. Field Crops Research, v.5, p.137-146, 1982.
Cabuslay, G. S.; Ito, O.; Alejar, A. A. Physiological evaluation of responses of rice (Oryza sativa L.) to water deficit. Plant Sci-ence, v.163, p.815-827, 2002.
Chaudhuri, U. N.; Deaton, M. L.; Kanemasu, E. T.; Wall, G. W.; Marcariam, V.; Dobrenz, A. K. A procedure to select drought-tol-erant sorghum and millet genotypes using canopy temperature and vapor pressure deficit. Agronomy Journal, v.78, p.490-494, 1986. Cruz, R. T.; O’Toole, J. C. Dryland rice response to an irriga-tion gradient at flowering stage. Agronomy Journal, v.76, p.178-183, 1984.
Fukai, S.; Cooper, M. Development of drought-resistant cultivars using physio-morphological traits in rice. Field Crops Re-search, v.40, p.67-86, 1995.
Garrity, D. P.; O’Toole, J. C. Selection for reproductive stage drought avoidance in rice, using infrared thermometry, Agronomy Journal, v.87, p.773-779, 1995.
Guimarães, C. M.; Stone, L. F.; Brunini, O. Adaptação do feijoeiro comum (Phaseolus vulgaris L.) à seca. Revista Brasileira de Engenharia Agrícola e Ambiental, v.10, p.70-75, 2006. Gupta, P. C.; O’Toole, J. C. Drought resistance. In: Gupta, P. C.;
O’Toole, J. C. (ed.). Upland rice: a global perspective. Philip-pines: International Rice Research Institute, 1986. p.148-74. Hatfied, J. L.; Quisenberry, J. E.; Dilbeck. R. E. Use of canopy
temperature to identify water conservation in cotton germplasm. Crop Science, v.27, p.269-273, 1987.
Heinemann, A. B.; Stone, L. F. Efeito da deficiência hídrica no desenvolvimento e rendimento de quatro cultivares de arroz de terras altas. Pesquisa Agropecuária Tropical, v.39, p.134-139, 2009.
Hirayama, M.; Wada, Y.; Nemoto, H. Estimation of drought tolerance based on leaf temperature in upland rice breeding. Breeding Science, v.56, p.47-54, 2006.
IRRI – International Rice Research Institute. Annual report for 1982. Manila: International Rice Research Institute, 1983. p.77-104. Jackson, R. D.; Idso, S. B.; Reginato, R. J.; Pinter, P. J. Canopy
temperature as a crop water stress indicator. Water Resources Research, v.17, p.1133-1138, 1981.
Lafitte, H. R.; Bennett, J. Requirements for aerobic rice: physi-ological and molecular considerations. In: Bouman, B. A. M.; Hengsdijk, H.; Hardy, B.; Bindraban, P. S.; Tuong, T. P.; Ladha, J. K (ed.). Water-wise rice production. Los Baños: International Rice Research Institute, 2002. p.259-274.
Lafitte, H. R.; Blum, A.; Atlin, G. Using secondary traits to help identify drought-tolerant genotypes. In: Fischer, K. S.; Lafitte, R.; Fukai, S.; Atlin, G.; Hardy, B. (ed.). Breeding rice for drought-prone environments. Los Banõs: International Rice Research Institute, 2003. p.37-48.
Lafitte, H. R.; Courtois, B. Interpreting cultivar x environment interactions for yield in upland rice: assigning value to drought-adaptive traits. Crop Science, v.42, p.1409-1420, 2002. Leinonen, I.; Jones, H. G. Combining thermal and visible imagery
for estimating canopy temperature and identifying plant stress. Journal of Experimental Botany, v.55, p.1423-1431, 2004. Liu, H.; Zou, G.; Liu, G; Hu, S.; Li, M.; Yu, X.; Mei, H.; Luo, L.
O’Toole, J. C.; Moya, T. B. Genotypic variation in maintenance of leaf potential in rice. Crop Science, v.18, p.873-876, 1978.
Rodrigues, R. A. F.; Soratto, R. P; Arf, O. Manejo da água em arroz de terras altas no sistema de plantio direto, usando o tanque Classe A. Engenharia Agrícola, v.24, p. 546-556, 2004. Stone, L. F.; Moreira, J. A. A.; Silva, S. C. da. Tensão da água do solo e produtividade do arroz. Goiânia: Embrapa-CNPAF, 1986. 6p. Comunicado Técnico, 19
Su, M. R.; Yang, C. M. Measurement of rice temperature by thermal infrared imagery. Chinese Agronomy Journal, v.8, p.29-38, 1998. Yoshida, S.; Hasegawa, S. The rice root system: its development and function. In: International Rice Research Institute. Drought resistance in rice. Los Baños: International Rice Research In-stitute, 1982. p.97-114.