Lactic Acidosis Induce Mitotic Chromosomal Instability –
An Implication in Aneuploid Human Tumors
Chunyan Dai1., Feifei Sun2., Chunpeng Zhu1
, Xun Hu1*
1Cancer Institute (a Key Laboratory for Cancer Intervention and Prevention of China National Ministry of Education), The Second Affiliated Hospital, Zhejiang University School of Medicine, Hangzhou, China,2State Key Laboratory of Oncology in South China, Sun Yat-sen University Cancer Center, Guangzhou, China
Abstract
Mitotic chromosomal instability (CIN) plays important roles in tumor progression, but what causes CIN is incompletely understood. In general, tumor CIN arises from abnormal mitosis, which is caused by either intrinsic or extrinsic factors. While intrinsic factors such as mitotic checkpoint genes have been intensively studied, the impact of tumor microenvironmental factors on tumor CIN is largely unknown. We investigate if glucose deprivation and lactic acidosis – two tumor microenvironmental factors – could induce cancer cell CIN. We show that glucose deprivation with lactic acidosis significantly increases CIN in 4T1, MCF-7 and HCT116 scored by micronuclei, or aneuploidy, or abnormal mitosis, potentially via damaging DNA, up-regulating mitotic checkpoint genes, and/or amplifying centrosome. Of note, the feature of CIN induced by glucose deprivation with lactic acidosis is similar to that of aneuploid human tumors. We conclude that tumor environmental factors glucose deprivation and lactic acidosis can induce tumor CIN and propose that they are potentially responsible for human tumor aneuploidy.
Citation:Dai C, Sun F, Zhu C, Hu X (2013) Tumor Environmental Factors Glucose Deprivation and Lactic Acidosis Induce Mitotic Chromosomal Instability – An Implication in Aneuploid Human Tumors. PLoS ONE 8(5): e63054. doi:10.1371/journal.pone.0063054
Editor:Jen-Tsan Ashley Chi, Duke University, United States of America
ReceivedAugust 21, 2012;AcceptedApril 1, 2013;PublishedMay 10, 2013
Copyright:ß2013 Dai et al. This is an open-access article distributed under the terms of the Creative Commons Attribution License, which permits unrestricted use, distribution, and reproduction in any medium, provided the original author and source are credited.
Funding:This work was supported in part by National 863 project (2007AA02Z143), China Natural Sciences Foundation projects (30772544, 81071802), and the Fundamental Research Funds for the Central Universities, National Ministry of Education, China, to X Hu. The funders had no role in study design, data collection and analysis, decision to publish, or preparation of the manuscript.
Competing Interests:The authors have declared that no competing interests exist.
* E-mail: [email protected]
.These authors contributed equally to this work.
Introduction
Chromosomal instability (CIN) is now recognized as a driving force for cancer initiation and progression [1]. Aneuploidy often exists in precancerous lesions [2,3] and carcinoma in situ [4]. CIN is a prominent feature of human tumors [5]. There is a correlation of chromosomal aberration with tumor grade and prognosis [6,7]. Mechanistically, CIN is caused by abnormal mitosis, typified by abnormalities in dynamics of microtubule/centrosome, mitotic timing (early exit or lagging), and mitotic checkpoint control, among others. Any errors in these events may ultimately result in the inability of cancer cells to faithfully segregate sister chromatid to daughter cells. These events are influenced by either the intrinsic or the extrinsic factors. The genes (intrinsic factors) that play key roles in these events have been studied in depth. However, the extrinsic factors, such as those in tumor microen-vironment, which may significantly influence mitosis of cancer cells, have not been extensively and intensively studied yet.
Cancer cells in solid tumors are surrounded by a hostile environment featured with nutrient shortage, lactic acidosis, hypoxia, etc, such that tumor cells are temporally or constantly under stress [8,9,10,11,12,13]. There are reports regarding the effect of hypoxia, acidosis, and glucose deprivation on genetic instability such as gene mutation [14]. In addition, Morita T., et al., demonstrated that acidosis, particularly at pH lower than 6.5, could induce sister-chromatid exchanges and chromosomal
aberrations in various cultured mammalian cells, and the effect was S-phase dependent [15,16].
On the basis of the rationales and facts described above, we investigated the potential effect of glucose deprivation and lactic acidosis, two prominent tumor environmental factors, on cancer CIN.
Materials and Methods
Cell culture
Murine breast cancer cell line 4T1(p53-null), human breast cancer cell line MCF-7(p53+/+) and human colon carcinoma cell line HCT116 (p53+/+) were maintained in complete RPMI-1640 (Life Technologies, USA) with 10% FBS, 100 U/ml penicillin/ streptomycin and 2 mM L-glutamine. All cell lines were obtained from and characterized by The Cell Bank of Type Culture Collection of Chinese Academy of Sciences according to the cell line authentification testing (vitality, species confirmation and interspecies contamination, DNA fingerprinting and mycoplasma contamination ), and were used within 6 months after resuscita-tion.
Stress condition
cells in medium containing 3 mM glucose (HCT116 was cultured in medium containing 0.5 mM glucose) with lactic acidosis for 7 days. These cells were under severe metabolic stress but still alive. Then, the surviving cells were cultured in fresh medium containing 3 mM glucose with lactic acidosis for another 48 hours to allow sufficient growth recovery. Lactic acidosis was generated by adding pure lactic acid (Sigma-Aldrich, Switzerland) to the culture media to a final lactate concentration at 20 mM and pH at 6.7, as previously described [17]. The pH values and lactate concentra-tions used here are in physiological ranges in solid tumors, as intratumoral pH can be as low as 6.0 and intratumoral lactate can vary between 3–40 mM [18,19,20,21,22,23,24,25].
Cell count, glucose and lactate measurement
Cell count was carried out with a hematocytometer under an optical microscope. Glucose in the culture medium was quantified by hexokinase colorimetric method using Olympus AU2700 system (Olympus, Tokyo, Japan). Lactate in culture medium was determined by VITROS Chemistry Product LAC Slides using VITROS 5.1 FS system (Ortho Clinical Diagnostics, Raritan, NJ).
The cytokinesis-block micronucleus (CBMN) assay The CBMN assay is one of the most commonly used methods for measuring chromosome instability [26]. The experimental procedure is based on the method as described previously by
Figure 1. Lactic acidosis rescues HCT116, 4T1 and MCF-7 cells from glucose deprivation.4T1 or MCF-7 cells were cultured in RPMI-1640 containing 3 mM glucose with or without lactic acidosis. HCT116 cells were cultured in RPMI-1640 containing 0.5 mM glucose with or without lactic acidosis. Cell count, lactate and glucose in culture medium were determined as described in Materials and Methods. (A) (B) & (C) Curves of cell growth/death, glucose consumption, and lactate generation. Solid symbol, with lactic acidosis; open symbol, without lactic acidosis. * p,0.05, **, p,0.01, *** p,0.005, as compared with control.
French [27]. Cells were cultured in medium containing 4.5mg/ml cytochalasin B (Sigma, USA) to block cytokinesis for 24 hours, trypsinzed, spun onto slides using a cytospin cytocentrifuge (Shandon Scientific, UK), air-dried, fixed in 3:1 methanol/glacial acetic acid and stained with Wright and Giemsa. Binucleated (BN) cells, micronuclei (MNi), nucleoplasmic bridges (NPBs) and nuclear blebs (NBs) were scored as described by Camps et al [28]. MNi were morphologically identical, their diameters varies between 1/16 and 1/3 of the mean diameter of the main nuclei, not linked to the main nuclei. NPBs were continuous nucleoplas-mic bridges between the two nuclei in a BN cell, which is no wider than 1/4 of the nuclear diameter. NBs were small protrusions of the nuclear material, connected to the main nucleus by a thin chromatin segment. For each sample, a total of 1000 BN cells were evaluated for the frequency of MNi, NPBs and NBs.
A total of 500 living interphase cells were used for assessment of mono-, bi-, and multi- nucleated cells without adding cytochalasin B.
Fluorescence In Situ Hybridization (FISH)
FISH was performed using pan-centromeric probes which recognize all chromosomes (KREATECH Diagnostics, The Netherlands). Chromosomespecific centromeric probes (FITC -conjugated alpha-satellite DNA probes for chromosomes 7 and TRITC -conjugated probes for chromosomes 17) were from Cytocell (UK). Molecular hybridization and immunofluorescent detection were carried out according to the manufacturer’s instructions. Fluorescence was observed under Zeiss LSM 710 laser confocal microscope equipped with Zen software to process the image.
Immunofluorescent Confocal Laser Microscopy
Cells on coverslip were fixed with 4% paraformaldehyde in PBS, permeabilized with 0.1% Triton X-100 in PBS, and blocked with 2% bovine serum albumin in sodium phosphate buffer (pH 7.4). Cells were co-stained with anti-pericentrin (1:500 dilution of ab4448, Abcam, UK) and anti-alpha tubulin (1:500 dilution, ab7291, Abcam, UK) or anti-c-H2AX(1:100 dilution, ab22551, Abcam, UK) and anti-53BP1(1:100 dilution, 4937s, Cell signalling, USA) according to the protocols of the suppliers. Alexa Fluor 633-conjugated goat anti-mouse and Alexa Fluor 488-conjugated goat anti-rabbit antibody (1:500) were from Molecular Probes (Invitrogen, USA). Nuclei were counterstained with DAPI. Fluorescence was observed under Zeiss LSM 710 laser confocal microscope equipped with Zen software to process the image.
Cell cycle assay and immunofluorescent detection of phosphorylated histone H3
16106 cells were collected and fixed in 70% ethanol (4uC, 48 hours). After fixation, the cells were washed with PBS, and permeabilized with 0.3% Triton X-100 in PBS for 15 min. Then the cells were blocked in 1% BSA for 10 min and stained with antibody that specifically recognizes the phosphorylated form of histone H3 (1:1000 dilution, 3377s, Cell signalling, USA). After incubated for 1 hr in room temperature, the cells were rinsed with PBS and incubated with FITC-conjugated IgG antibody for 30 min. Then the cells were rinsed with PBS twice, and stained with the CycleTESTTMPLUS DNA Reagent Kit (BD Bioscienc-es, USA). The samples were analyzed by the FACScanTMCalibur (Becton Dickinson, USA). The FCS Express version 3 (De Novo Software) was utilized to analyze the data.
Figure 2. One cycle of glucose deprivation with lactic acidosis followed by nutrient restoration significantly increases micronuclei (MNi), nucleoplasmic bridges (NPBs), and nuclear blebs (NBs) in HCT116, 4T1 and MCF-7 cancer cells.(A) Percentage of binucleated (BN) cells in the cells that were cultured for 7 days as described in Figure 1 and resume mitosis upon nutrient restoration in the presence of cytochalasin B. Control cells are maintained in regular medium without lactic acidosis. (B) The numbers of cells that carry MNi, or NPBs, or NBs in every 1000 BN cells. *p,0.05, **p,0.01, *** p,0.005, in comparison to control. MNi, NPBs and NBs were determined by cytokinesis block micronucleus (CBMN) assay as described in Materials and Methods. (C) Representative photos of MNi, NPBs, and NBs. (D) MNi that contains chromosomes by pancentromeric FISH probes. MNC+, MNi containing whole chromosome; MNC2, MNi containing chromosomal accentric fragment.
Quantitative real-time reverse transcription–PCR
Total RNA was extracted using RNeasy Mini Kits (Qiagen, USA). The mRNA was reverse transcribed into cDNA using the M-MLV Reverse Transcriptase (Promega, USA). Then, 20 ng of cDNA was subjected to quantitative real-time PCR analyses targeting Mad2, Bub1b, Bub1, Bub3, Cdc2 and Cyclin B1 using the SYBRH Premix Ex TaqTM (TaKaRa, China). The primer sequences were listed in Table S1. Analysis was performed using the StepOne Real-Time PCR System and the StepOne v2.0 software (Applied Biosystems, Germany). Data was presented as the fold difference in the investigated genes expression normalized to gene GAPDH as endogenous reference, relative to the untreated control cells.
Western blot analysis
Cells were lysed with M-PER mammalian protein extraction reagent (Pierce, USA), supplemented with protease inhibitor
cocktail (Pierce, USA). Protein concentration was measured by BCA protein assay (Pierce, USA). After heat denaturation, samples were stored at280uC before use. The protein was applied to a 10% to 12% SDS polyacrylamide gel, transferred to a PVDF membrane, and then detected by the proper primary and secondary antibodies before visualization by Western Lighting Plus ECL kit (Perkin Elmer, USA). The primary antibodies used: rabbit anti-mad2, rabbit anti-bub1b, rabbit anti-bub3 and rabbit anti-cdc2 (Cell Signalling Technology, USA), rabbit anti-cyclin B1 and mouse anti-bub1 (Sigma, USA).
Statistical analysis
Unless otherwise stated, experiments were done three times; data were expressed as mean6SD. Comparisons between groups were evaluated using two tailed Student t tests.
Results
A glucose deprivation model
Severe metabolic stress such as glucose deprivation rapidly kills cancer cells. To gain CIN, cancer cells must survive through metabolic stress. We recently found that cancer cells under lactic acidosis can tolerate glucose deprivation. We added pure lactic acid to the culture media to final concentration of 20 mM with a corresponding pH of 6.7, as previously described [17]. The pH Figure 3. The effect of lactic acidosis, glucose deprivation, and
lactic acidosis with glucose deprivation on chromosome instability.(A) The numbers of HCT116 cells that carry MNi, or NPBs, or NBs in every 1000 BN cells. *p,0.05, **p,0.01, *** p,0.005. HCT116 cells were cultured in 4 different conditions: condition 1 (control), regular RPMI-1640; condition 2 (glucose deprivation), RPMI-1640 containing 0.5 mM glucose; condition 3 (lactic acidosis), regular RPMI-1640 with 20 mM lactic acidosis. To avoid glucose deprivation during 7-day culture, we replaced the medium every 2 7-days; condition 4 (glucose deprivation with lactic acidosis), RPMI-1640 containing 0.5 mM glucose with 20 mM lactic acidosis. Cells were harvested at the indicated time and subjected for analysis of MNi, or NPBs, or NBs. (B) The numbers of 4T1 cells that carry MNi, or NPBs, or NBs in every 1000 BN cells. *p,0.05, **p,0.01, *** p,0.005, in comparison to control. 4T1 cells were cultured in 4 different condition as described in (A) except condition 2 and 4 in which glucose was 3 mM.
doi:10.1371/journal.pone.0063054.g003
values and lactate concentrations used were in the physiological ranges in solid tumors [18,19,20,21,23,25]. 4T1 and MCF-7 cells were cultured in RPMI-1640 containing 3 mM glucose with or without lactic acidosis. HCT116 cells were cultured in RPMI-1640 containing 0.5 mM glucose with or without lactic acidosis. Without lactic acidosis, cells died rapidly when glucose was exhausted. With lactic acidosis, cells’ survival time was significantly extended after glucose was used up (Figure 1). The results showed that lactic acidosis conferred cancer cells with ability to survive under glucose deprivation, consistent with our previous report [17].
Glucose deprivation and lactic acidosis induce CIN The cells cultured in medium containing 3 mM glucose with lactic acidosis for 7 days (Figure 1) were under glucose deprivation, as glucose was already exhausted on day 2 (HCT116), on day 3 (4T1), or on day 5 (MCF-7). Upon nutrient restoration, these cells resumed mitosis, as manifested by the binuclear cells, which were 62.563.5% (HCT116), 53.3365.77% (4T1), and 62.066.45% (MCF-7) (Figure 2A), comparable with those maintained in regular culture medium. We then checked if these cells surviving through glucose deprivation had increased CIN during the mitotic recovery. The results showed that the frequencies of MNi, NPBs, and NBs, the indicators of CIN, were significantly increased (Figure 2B&C). Pancentromeric FISH probes were used to detect the percentage of micronuclei that carry whole chromosomes and
chromosomal accentric fragment (Figure 2D). The results indicat-ed that there existindicat-ed both whole-chromosome loss and DNA breakage in cells.
Lactic acidosis and glucose deprivation represents 2 separate stresses for cancer cells. We then determined the MNi, NPBs, and NBs of HCT116 and 4T1 cells exposed to glucose deprivation or lactic acidosis. For glucose deprivation, HCT116 cells were incubated in culture medium containing 0.5 mM glucose for 3 days then collected for determination of MNi, NPBs, and NBs, because cells on day 3 were deprived of glucose, given the fact that glucose was exhausted on day 1 and cells died out on day 4 (Fig. 1A & B). For lactic acidosis exposure, cells were cultured in regular culture medium containing 6 mM glucose supplemented with 20 mM lactic acid. In order to avoid glucose deprivation, we replaced the medium every 2 days. The results demonstrated that both glucose deprivation and lactic acidosis increased CIN, but combination of glucose deprivation with lactic acidosis apparently achieved an additive effect (Figure 3A). Glucose deprivation or lactic acidosis also caused an increase of CIN in 4T1 cells, but the effect of combination of glucose deprivation with lactic acidosis on CIN was not further enhanced (Figure 3B). The results thus indicated that both lactic acidosis and glucose deprivation could induce CIN, but the additive effect of glucose deprivation with lactic acidosis depends on cell lines. This difference may be associated with genetic background, e.g., HCT116 has intact p53 and near diploid, whereas 4T1 is p53 null and show a complex Figure 5. One cycle of glucose deprivation with lactic acidosis followed by nutrient restoration induces centrosome amplification and multipolar division in 4T1 cells.Cells were cultured in RPMI-1640 medium containing 3 mM glucose with lactic acidosis for 7 days. The cells surviving through glucose deprivation with lactic acidosis were then cultured in fresh medium for 48 hours and subjected for analysis of centrosome and spindle. Control cells were maintained in regular RPMI-1640 medium without lactic acidosis. (A) Representative photos of nonmitotic cells with one or multiple centrosomes. (B) The percentage of cells with multiple centrosomes (.1) in the population of nonmitotic cells (pericentrin, green; DAPI, blue). **p,0.01, in comparison to control. (C) Representative photos of mitotic cells with bipolar or multipolar spindles. (D) The percentage of cells with multipolar spindles in the population of mitotic cells. **p,0.01, in comparison to control.
aneuploid karyotype, and the basal levels of MNi, NPBs, and NBs are significantly higher in 4T1 than in HCT116 (Figure 3A&B).
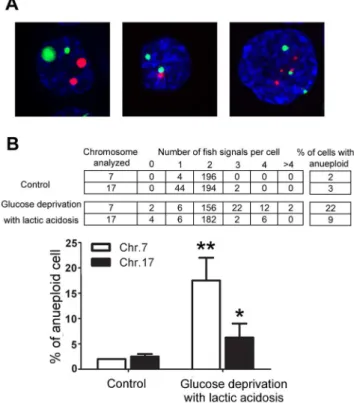
Because MCF-7 and 4T1 cell lines have a complex aneuploid karyotype, they are not suitable models for scoring aneuploid generation. HCT116 is a human colon cancer cell line with a stable near-diploid karyotype hence we used it to evaluate the effect of glucose deprivation with lactic acidosis on aneuploid generation. HCT116 cells were cultured in medium containing 0.5 mM glucose with lactic acidosis for 7 days, then cultured in fresh RPMI-1640 medium for 48 hours and scored for anueploidy by FISH using chromosome 7- and 17-specific centromeric probes. The aneuploid cells as judged by chromosome 7 and 17 were increased by 11 and 3 folds, respectively, in comparison to control (Figure 4). Notably, polysomy of chromosomal 7 is frequently observed in many types of human tumors [29,30].
Other lines of evidence that demonstrated the effect of glucose deprivation with lactic acidosis on cancer cell CIN included misaligned chromosome in the metaphase, lagging chromosome in the anaphase, and nucleoplasmic bridge in the telophase (Figure S1).
Glucose deprivation with lactic acidosis induces centrosome amplification, multipolar mitosis, and multinucleation
Since centrosome amplification is strongly associated with chromosomal instability/spindle multipolarity/multinucleation in human tumor [31,32,33], we examined if glucose deprivation with lactic acidosis could induce centrosome amplification in cells. Our results showed that the treatment exerted a significant effect on
centrosome amplification, as manifested by a more than 10-fold and 6-fold increase of cells with multiple centrosomes at both non-mitotic (Figure 5A & B) and non-mitotic phase (Figure 5C & D), respectively. The amplification of centrosome was accompanied with multipolar mitosis (Figure 5C & D). Although multipolar spindles generally lead to mitotic cell death, they could form a functional pseudo-bipolar spindle if clustered to opposite poles [34]. Such functional spindle is associated with melotelic attachment (a single kinetochore is attached to both opposite spindle poles), which leads to lagging chromosome and segregation errors [34]. Meanwhile, the multinucleated cells increased by 12-fold as compared with control (Figure 6), a consequence related to multipolar mitosis or successive cycles of bipolar mitosis without cytokinesis.
However, centrosome amplification, multipolar mitosis, and multinucleation were not observed in MCF-7 and HCT116 cells. This difference might be caused byp53. 4T1 isp53null, whereas MCF-7 and HCT116 arep53wild-type. Previous reports showed that multiple centrosomes, multipolar mitosis, and cytokinesis failure could arise from failure of p53-dependent tetraploidy checkpoint [35].
Figure 6. One cycle of glucose deprivation with lactic acidosis followed by nutrient restoration significantly increases multi-nucleation in 4T1 cells.**p,0.01, in comparison to control. Cells were cultured in RPMI-1640 medium containing 3 mM glucose with lactic acidosis for 7 days. The cells surviving through glucose deprivation with lactic acidosis were then cultured in fresh medium for 48 hours. Control cells were maintained in regular RPMI-1640 medium without lactic acidosis.
doi:10.1371/journal.pone.0063054.g006
Figure 7. The effect of glucose deprivation with lactic acidosis followed by nutrient restoration on key members of mitotic checkpoint in HCT116 cells. Cells were cultured in RPMI-1640 medium containing 0.5 mM glucose with lactic acidosis for 7 days. The cells surviving through glucose deprivation with lactic acidosis were then cultured in fresh medium. Cells were collected at indicated time for real-time PCR (A) and Western Blot (B) analysis. The results were confirmed by 2 independent experiments.
Glucose deprivation with lactic acidosis induces a dysregulation of mitotic checkpoint
Since hyperactivated mitotic checkpoint is another major mechanism that leads to human tumor CIN [1,36,37,38,39,40], we tested if glucose deprivation with lactic acidosis could disturb the expression of the mitotic checkpoint genes such as mad2, bub1, bub3, and bub1b. According to the PCR result (Figure 7A), the mRNA levels of these components except Bub3 significantly decreased when glucose was deprived. Upon nutrition restoration, all the components increased to a level significantly exceeding the initial levels, then declined. The results indicated that, at the transcription levels, these components of the mitotic checkpoints, were disturbed. We then checked the protein levels of these components (Figure 7B). During glucose deprivation, except mad2, the expression of bub1, bub3, bub1b, cdc2 and cyclin B1 significantly decreased (Figure 6A). Upon nutrient restoration,
expression of all 6 proteins was increasing. Notably, the amount of mad2 was 6-fold (analyzed by the densitometry of the Western blot) higher than that of control cells – the cells maintained in regular culture, suggesting that mitotic recovery of cells surviving through glucose deprivation was accompanied with an abnormal high expression of Mad2. Nevertheless, the levels of the mRNA and proteins apparently did not match very well with each other, e.g., mRNA levels of Mad2, Bub1b, and Bub3 declined on day 2 after nutrient restoration, whereas protein levels of these compo-nents did not, suggesting a potential post-transcriptional regulation of these components. Taken together, the results suggest that glucose deprivation with lactic acidosis induces cancer cell CIN potentially via its disturbing mitotic checkpoint, although validat-ing the relationship needs further studies.
G2/M percentage in these cells was significantly higher than that of control cells (cells under regular culture) (Figure 8A), followed by a decrease to the initial level (day 0). Consistently, the percentage of cells with mitotic marker (phosphor-Histone H3) [41] were increased on the first day upon nutrient restoration followed by a decline back to the initial level (day 0) (Figure 8B). Consistently again, the growth slope of the cells on the first day of nutrient restoration was shallow as compared with the next 2 days (Figure 8C).
The expression profile of Mad2, Bub1b, Bub1, and Bub3 at mRNA levels matches well with the data of cell cycle (Figure 7A, Figure 8), suggesting a coordination of cell cycle with the mitotic checkpoints in cells that underwent the stress and release. Nevertheless, protein levels of Mad2, Bub1B, and Bub3 remained high (Figure 7B) even after stress release (day 2 and day 3 after nutrient restoration). We suggest that there is a lagging time for these proteins. The puzzling question is: if the high levels of these components were responsible for the temporary arrest at G2/M in the first day after stress release, how they could permit G2/M release on day 2 and 3 after nutrient restoration. Would it be possible on day 2 and 3 after nutrient restoration, these proteins
did not form functional quaternary structure? This is an issue we are considering.
Glucose deprivation with lactic acidosis increases DNA damage
Another possible explanation for the increased MN, NPBs, and NBs, and potentially also for supernumerary centrosomes and aneuploidy generation, is an increase in DNA damage as a result of glucose deprivation with lactic acidosis. We checked the levels of DNA damage in cells exposed to glucose deprivation with lactic acidosis followed by nutrient restoration, using immunofluores-cence staining forc-H2AX and 53BP1 [42,43], scored according to Lukas et al [44]. After DNA double strand break (DSB), histone H2AX surrounding DSB would be phosphorylated. The phos-phorylated H2AX was termed c-H2AX. DSB also recruit the DNA damage sensor p53-binding protein 1 (53BP1), which was retained byc-H2AX. Thus, the staining ofc-H2AX and 53BP1 was mostly overlapping (Figure 9A). The results indicated that under glucose deprivation with lactic acidosis, DNA damage was even lower than control. This was not surprising, as these cells were at G0/G1 phase [17], in which DNA synthesis was inactive. However, after release from stress upon nutrient restoration, DNA damage in cells, as reflected by foci per cells greater than 1, increased significantly (Figure 9B).
Discussion
There are in general 3 mechanisms underlying aneuploid human tumours as summarized by Schvartzman et al [1]: (a) Loss/ mutation/downregulation of mitotic checkpoint is considered to be associated with tumor CIN, as the weakened checkpoint may allow premature exit from mitosis and premature separation of sister chromatids. Although many studies using mouse models demonstrated that mutation/loss/downregulation of mitotic checkpoint members indeed could lead to tumor CIN [45], it is increasingly recognized that mutation/loss/downregulation of mitotic checkpoint members is rare based on extensive analysis of aneuploid human tumours. (b) In most cases, these genes in aneuploid human tumours are upregulated [46]. It has been shown that overexpression of these genes is sufficient to generate aneuploidy and to initiate tumourigenesis [47]. Mechanistically, hyperactive mitotic checkpoint tends to prolong mitosis and to increase the chance of merotelic attachment and lagging chromosome. (c) Centrosome amplification appears to be an alternative mechanism responsible for human aneuploid tumours [1]. Multiple centrosomes in cancer cells can cluster at 2 poles to form a pseudo-bipolar spindle. Such spindle, however, increases frequency of lagging chromosome and segregation errors in mitosis [48,49]. Therefore, hyperactivated mitotic checkpoints and centrosome amplification are increasingly recognized as the major mechanistic basis responsible for aberrant mitosis and CIN in human tumours.
How mitotic checkpoint in human tumours is upregulated is not completely known. We show that glucose deprivation with lactic acidosis can upregulate the expression of mitotic checkpoint genes. Interestingly, human tumor CIN shares similar feature as that induced by glucose deprivation with lactic acidosis, such as aneuploidy, spindle multipolarity, multinucleation, hyperactivated mitotic checkpoint and/or abnormal amplification of centrosome. The similarity suggests that glucose deprivation and lactic acidosis are environmental factors relevant to aneuploid human tumours. Besides, glucose deprivation and lactic acidosis can also cause DNA damage, which is another potential way leading to cancer CIN. Solid tumor, particularly poorly-vascularized tumors, is Figure 9. The effect of glucose deprivation with lactic acidosis
followed by nutrient restoration on DNA damage in HCT116 cells.Cells were divided into 3 groups. Group 1 (control), cells were cultured in regular RPMI-1640 medium; Group 2 (glucose deprivation with lactic acidosis), cells were cultured in RPMI-1640 medium containing 0.5 mM glucose with lactic acidosis for 7 days; Group 3 (nutrition restoration), cells were cultured in RPMI-1640 medium containing 0.5 mM glucose with lactic acidosis for 7 days then cultured in fresh medium for 48 hours. DNA damage was scored byc-H2AX and
53BP1 labelling as described in Materials and Methods. (A) Represen-tative photos of cells withc-H2AX and 53BP1 labelling. (B) Number ofc
-H2AX per cell (n = 300) and statistical analysis. (C) Number of 53BP1 foci per cell (n = 300) and statistical analysis. *p,0.05, **p,0.01, in comparison to control.
spatially or temporally under stress [10,12,50,51]; lactic acidosis, a tumor environmental factor, can transit cancer cells to a ‘dormant’ like state under glucose deprivation [17]; when glucose/nutrient is provided, these cells could resume mitosis but with a higher frequency to acquire CIN.
We did not further study the fate of the cells that acquire CIN imposed to glucose deprivation with lactic acidosis, because previous literatures have clearly shown the destinies for those cells, whose survival or death follows ‘the fittest survival’ principle. While some die under the sustained stress environment [52,53], others may acquire growth advantage, for example, overexpres-sion of EGFR due to polysomy of chromosome 7 may maintain basal glucose uptake and support cancer cells survival in the low glucose medium [54]. We noted that the numbers of chromosome 7 in the aneuploid HCT116 cells induced by glucose deprivation with lactic acidosis followed by nutriontion restoration ranged from 0–6, suggesting the different environmental adaptability of these cells.
Targeting hyperactivated mitotic checkpoint is an approach to treat tumor. Candidate drugs targeting CENPE, CDC20, Aurora kinase, etc, are under clinical trials [55,56]. Another potential alternative approach could be manipulation of tumor lactic acidosis. We recently reported that it was lactic acidosis but not lactosis that could protect cancer cells against metabolic stress-induced death [17]. Elevating intratumoal pH may convert lactic acidosis to lactosis, induce quick death of cancer cells, hence could reduce CIN.
In conclusion, glucose deprivation with lactic acidosis – two tumor microenvironmental factors – can induce cancer cell CIN
potentially via 3 ways, damaging DNA, upregulating mitotic checkpoint genes, and amplifying centrosome. The feature of CIN induced by glucose deprivation with lactic acidosis is similar to that of aneuploid human tumors. We speculate that glucose depriva-tion and lactic acidosis are potential inducers of human tumor CIN.
Supporting Information
Figure S1 One cycle of glucose deprivation with lactic acidosis followed by nutrient restoration exerts signif-icant effect on mitosis of 4T1 cells.4T1 cells were cultured in RPMI-1640 medium containing 3 mM glucose with lactic acidosis for 7 days. The cells surviving through glucose deprivation were then cultured in fresh medium for 48 hours for mitotic recovery. Representative photos show the misaligned chromosome at metaphase (the panels on the top), the lagging chromosome at anaphase (the middle panels), and the nucleoplasmic bridge at telophase (the panels at the bottom).
(TIF)
Table S1 The primers for quantitative real-time PCR of HCT116 cells.
(DOC)
Author Contributions
Conceived and designed the experiments: XH. Performed the experiments: CD FS CZ. Analyzed the data: CD FS. Wrote the paper: XH CD FS.
References
1. Schvartzman JM, Sotillo R, Benezra R (2010) Mitotic chromosomal instability and cancer: mouse modelling of the human disease. Nat Rev Cancer 10: 102– 115.
2. Reid BJ, Haggitt RC, Rubin CE, Rabinovitch PS (1987) Barrett’s esophagus. Correlation between flow cytometry and histology in detection of patients at risk for adenocarcinoma. Gastroenterology 93: 1–11.
3. Levine DS, Rabinovitch PS, Haggitt RC, Blount PL, Dean PJ, et al. (1991) Distribution of aneuploid cell populations in ulcerative colitis with dysplasia or cancer. Gastroenterology 101: 1198–1210.
4. Pihan GA, Purohit A, Wallace J, Knecht H, Woda B, et al. (1998) Centrosome defects and genetic instability in malignant tumors. Cancer Res 58: 3974–3985. 5. Rajagopalan H, Lengauer C (2004) Aneuploidy and cancer. Nature 432: 338–
341.
6. Choi CM, Seo KW, Jang SJ, Oh YM, Shim TS, et al. (2009) Chromosomal instability is a risk factor for poor prognosis of adenocarcinoma of the lung: Fluorescence in situ hybridization analysis of paraffin-embedded tissue from Korean patients. Lung Cancer 64: 66–70.
7. Brendle A, Brandt A, Johansson R, Enquist K, Hallmans G, et al. (2009) Single nucleotide polymorphisms in chromosomal instability genes and risk and clinical outcome of breast cancer: a Swedish prospective case-control study. Eur J Cancer 45: 435–442.
8. Bergers G, Benjamin LE (2003) Tumorigenesis and the angiogenic switch. Nat Rev Cancer 3: 401–410.
9. Tredan O, Galmarini CM, Patel K, Tannock IF (2007) Drug resistance and the solid tumor microenvironment. J Natl Cancer Inst 99: 1441–1454.
10. Fukumura D, Jain RK (2007) Tumor microvasculature and microenvironment: targets for anti-angiogenesis and normalization. Microvasc Res 74: 72–84. 11. Skinner SA, Tutton PJ, O’Brien PE (1990) Microvascular architecture of
experimental colon tumors in the rat. Cancer Res 50: 2411–2417.
12. Denko NC (2008) Hypoxia, HIF1 and glucose metabolism in the solid tumour. Nat Rev Cancer 8: 705–713.
13. Chen JL, Lucas JE, Schroeder T, Mori S, Wu J, et al. (2008) The genomic analysis of lactic acidosis and acidosis response in human cancers. PLoS Genet 4: e1000293.
14. Reynolds TY, Rockwell S, Glazer PM (1996) Genetic instability induced by the tumor microenvironment. Cancer Res 56: 5754–5757.
15. Morita T (1995) Low pH leads to sister-chromatid exchanges and chromosomal aberrations, and its clastogenicity is S-dependent. Mutat Res 334: 301–308. 16. Morita T, Nagaki T, Fukuda I, Okumura K (1992) Clastogenicity of low pH to
various cultured mammalian cells. Mutat Res 268: 297–305.
17. Wu H, Ding Z, Hu D, Sun F, Dai C, et al. (2011) Central role of lactic acidosis in cancer cell resistance to glucose deprivation-induced cell death. J Pathol 227: 189–199.
18. Gallagher FA, Kettunen MI, Day SE, Hu DE, Ardenkjaer-Larsen JH, et al. (2008) Magnetic resonance imaging of pH in vivo using hyperpolarized 13C-labelled bicarbonate. Nature 453: 940–943.
19. Gatenby RA, Gillies RJ (2004) Why do cancers have high aerobic glycolysis? Nat Rev Cancer 4: 891–899.
20. Thistlethwaite AJ, Leeper DB, Moylan DJ 3rd, Nerlinger RE (1985) pH distribution in human tumors. Int J Radiat Oncol Biol Phys 11: 1647–1652. 21. van Sluis R, Bhujwalla ZM, Raghunand N, Ballesteros P, Alvarez J, et al. (1999)
In vivo imaging of extracellular pH using 1H MRSI. Magn Reson Med 41: 743– 750.
22. Brizel DM, Schroeder T, Scher RL, Walenta S, Clough RW, et al. (2001) Elevated tumor lactate concentrations predict for an increased risk of metastases in head-and-neck cancer. Int J Radiat Oncol Biol Phys 51: 349–353. 23. Holroyde CP, Axelrod RS, Skutches CL, Haff AC, Paul P, et al. (1979) Lactate
metabolism in patients with metastatic colorectal cancer. Cancer Res 39: 4900– 4904.
24. Walenta S, Wetterling M, Lehrke M, Schwickert G, Sundfor K, et al. (2000) High lactate levels predict likelihood of metastases, tumor recurrence, and restricted patient survival in human cervical cancers. Cancer Res 60: 916–921. 25. Walenta S, Mueller-Klieser WF (2004) Lactate: mirror and motor of tumor
malignancy. Semin Radiat Oncol 14: 267–274.
26. Fenech M (2007) Cytokinesis-block micronucleus cytome assay. Nat Protoc 2: 1084–1104.
27. Fenech M, Morley AA (1985) Measurement of micronuclei in lymphocytes. Mutat Res 147: 29–36.
28. Camps J, Ponsa I, Ribas M, Prat E, Egozcue J, et al. (2005) Comprehensive measurement of chromosomal instability in cancer cells: combination of fluorescence in situ hybridization and cytokinesis-block micronucleus assay. FASEB J 19: 828–830.
29. Waldman FM, Carroll PR, Kerschmann R, Cohen MB, Field FG, et al. (1991) Centromeric copy number of chromosome 7 is strongly correlated with tumor grade and labeling index in human bladder cancer. Cancer Res 51: 3807–3813. 30. Voravud N, Shin DM, Ro JY, Lee JS, Hong WK, et al. (1993) Increased polysomies of chromosomes 7 and 17 during head and neck multistage tumorigenesis. Cancer Res 53: 2874–2883.
32. Lingle WL, Barrett SL, Negron VC, D’Assoro AB, Boeneman K, et al. (2002) Centrosome amplification drives chromosomal instability in breast tumor development. Proc Natl Acad Sci U S A 99: 1978–1983.
33. Pihan GA, Wallace J, Zhou Y, Doxsey SJ (2003) Centrosome abnormalities and chromosome instability occur together in pre-invasive carcinomas. Cancer Res 63: 1398–1404.
34. Gergely F, Basto R (2008) Multiple centrosomes: together they stand, divided they fall. Genes Dev 22: 2291–2296.
35. Borel F, Lohez OD, Lacroix FB, Margolis RL (2002) Multiple centrosomes arise from tetraploidy checkpoint failure and mitotic centrosome clusters in p53 and RB pocket protein-compromised cells. Proc Natl Acad Sci U S A 99: 9819– 9824.
36. Thompson SL, Bakhoum SF, Compton DA (2010) Mechanisms of chromosomal instability. Curr Biol 20: R285–295.
37. Sotillo R, Hernando E, Diaz-Rodriguez E, Teruya-Feldstein J, Cordon-Cardo C, et al. (2007) Mad2 overexpression promotes aneuploidy and tumorigenesis in mice. Cancer Cell 11: 9–23.
38. Grabsch H, Takeno S, Parsons WJ, Pomjanski N, Boecking A, et al. (2003) Overexpression of the mitotic checkpoint genes BUB1, BUBR1, and BUB3 in gastric cancer–association with tumour cell proliferation. J Pathol 200: 16–22. 39. Pinto M, Vieira J, Ribeiro FR, Soares MJ, Henrique R, et al. (2008)
Overexpression of the mitotic checkpoint genes BUB1 and BUBR1 is associated with genomic complexity in clear cell kidney carcinomas. Cell Oncol 30: 389– 395.
40. Wada N, Yoshida A, Miyagi Y, Yamamoto T, Nakayama H, et al. (2008) Overexpression of the mitotic spindle assembly checkpoint genes hBUB1, hBUBR1 and hMAD2 in thyroid carcinomas with aggressive nature. Anticancer Res 28: 139–144.
41. Xu B, Kim S, Kastan MB (2001) Involvement of Brca1 in S-phase and G(2)-phase checkpoints after ionizing irradiation. Mol Cell Biol 21: 3445–3450. 42. Huyen Y, Zgheib O, Ditullio RA Jr, Gorgoulis VG, Zacharatos P, et al. (2004)
Methylated lysine 79 of histone H3 targets 53BP1 to DNA double-strand breaks. Nature 432: 406–411.
43. Rogakou EP, Pilch DR, Orr AH, Ivanova VS, Bonner WM (1998) DNA double-stranded breaks induce histone H2AX phosphorylation on serine 139. J Biol Chem 273: 5858–5868.
44. Lukas C, Savic V, Bekker-Jensen S, Doil C, Neumann B, et al. (2011) 53BP1 nuclear bodies form around DNA lesions generated by mitotic transmission of chromosomes under replication stress. Nat Cell Biol 13: 243–253.
45. Dobles M, Liberal V, Scott ML, Benezra R, Sorger PK (2000) Chromosome missegregation and apoptosis in mice lacking the mitotic checkpoint protein Mad2. Cell 101: 635–645.
46. Carter SL, Eklund AC, Kohane IS, Harris LN, Szallasi Z (2006) A signature of chromosomal instability inferred from gene expression profiles predicts clinical outcome in multiple human cancers. Nat Genet 38: 1043–1048.
47. Diaz-Rodriguez E, Sotillo R, Schvartzman JM, Benezra R (2008) Hec1 overexpression hyperactivates the mitotic checkpoint and induces tumor formation in vivo. Proc Natl Acad Sci U S A 105: 16719–16724.
48. Ganem NJ, Godinho SA, Pellman D (2009) A mechanism linking extra centrosomes to chromosomal instability. Nature 460: 278–282.
49. Silkworth WT, Nardi IK, Scholl LM, Cimini D (2009) Multipolar spindle pole coalescence is a major source of kinetochore mis-attachment and chromosome mis-segregation in cancer cells. PLoS One 4: e6564.
50. Hirayama A, Kami K, Sugimoto M, Sugawara M, Toki N, et al. (2009) Quantitative metabolome profiling of colon and stomach cancer microenviron-ment by capillary electrophoresis time-of-flight mass spectrometry. Cancer Res 69: 4918–4925.
51. Annibaldi A, Widmann C (2010) Glucose metabolism in cancer cells. Curr Opin Clin Nutr Metab Care 13: 466–470.
52. Karpinets TV, Foy BD (2005) Tumorigenesis: the adaptation of mammalian cells to sustained stress environment by epigenetic alterations and succeeding matched mutations. Carcinogenesis 26: 1323–1334.
53. Hastings PJ, Bull HJ, Klump JR, Rosenberg SM (2000) Adaptive amplification: an inducible chromosomal instability mechanism. Cell 103: 723–731. 54. Weihua Z, Tsan R, Huang WC, Wu Q, Chiu CH, et al. (2008) Survival of
cancer cells is maintained by EGFR independent of its kinase activity. Cancer Cell 13: 385–393.
55. Harrington EA, Bebbington D, Moore J, Rasmussen RK, Ajose-Adeogun AO, et al. (2004) VX-680, a potent and selective small-molecule inhibitor of the Aurora kinases, suppresses tumor growth in vivo. Nat Med 10: 262–267. 56. Fleming RA HK, Cyr TL, Johnson BM, Gauvin JLS, Lager JJ, et al. (2008) A