ECONOMIC VALUE ADDED AND MARKET VALUE ADDED -
MODERN INDICATORS FOR ASSESSMENT THE FIRM’S VALUE
NICOLAE SICHIGEA
PROF. PH.D., UNIVERSITY OF CRAIOVA
e-mail: [email protected]
LAURA VASILESCU
ASSOC. PROF. PH.D., UNIVERSITY OF CRAIOVA
e-mail: [email protected]
Abstract
The financial theory developed different categories of indicators - traditional and modern - in order to evaluate the firm’s value creation. The shareholders are directly interested by the value added in the company. The value creation is a complex process that implies correct decisions, common responsibility (managers and shareholders) and actions towards an efficient and profitable activity.
The traditional indicators of performance are not teoritically correlated with the the value creation and in these circumstances, should be used appropriate financial indicators in order to reflect the value of the company. Therefore, the modern indicators used in the value based management framework offer a greater flexibility and efficiency and represent a good alternative for companies.
Such performance indicators used to measure the financial results correlated with shareholder wealth are the Economic Value Added (EVA), as a measure of internal performance and the Market Value Added (MVA) as a measure of external performance of the company. Starting from the main deficiencies of the accounting indicators, the objective of this this study is to present the relationship between EVA and MVA and their implications on firms’valuation. Thus, the presentation and analysis of these indicators – EVA and MVA - will underline the main features, their correlations, and influence factors but also the main advantage and disadvantage of each indicator, which will enable the managers to make the correct choice and subsequently the best decision regarding the performance measures.
Keywords: Economic Value Added, Market Value Added, performance, value, firm
ClassificationJEL: G32, L25
1. Introduction
Various drivers like globalization, increased competition, volatility of interest rate, foreign exchange fluctuations, different types of risks and the uncertainty caused by the international financial crisis, influence the financial markets and the activity of companies. Today's business environment has to face these challenges that could have a major impact on performance and efficiency of firms. These factors and the deficiencies of the traditional (accounting) indicators determined the managers to reanalyze the performance measures and to focus on value creation. The corporate finances developed theories and indicators that have the main purpose to guide the financial decisions of the company and their consequences should be reflected on the firm’s value. But it should be taken into consideration that the analysis of the financial situation of the firm is based in principal on the accounting data which reflects the patrimony changes but also has the disadvantages to use historical date.
The financial theory stated that every company’s final purpose is to maximize the wealth of its shareholders. In the past, this ultimate aim has however been often partly ignored or at least misunderstood. Indicators like Return on Investment and Earnings per Share are used as the most important performance ratios in companies, although they do not theoretically correlate with the shareholder value creation.
In these circumstances, the Value Based Management seems to be the framework for value enhancement, the “fastest ticket” to shareholder wealth [14]. Incorporating indicators as Economic Value Added (EVA) and Market Value Added (MVA), the Value Based Management can represent the framework for value enhancement that guides the decision process, being an efficient instrument for financial planning, monitoring, and controlling.
2. Theoretical fundaments
The financial theories, which reveal the creation of value in the firm, present a wide range of indicators that can be grouped in: traditional (accounting) and modern (economic, stock exchange).
The accounting indicators represented the base of the analysis till the mid of ’80s when the firms considered in principal the net profit and the earning per share as accounting indicators. Afterwards, the firms started to use indicators such as return on assets (ROA), return on equity (ROE), the return on capital employed (ROCE) as performance measures but in fact, they do not reflect the economic return as long as they are based on assets’ value, that are influenced by inflation or other factors.
These accounting measures have been criticised as performance indicators, which can create shareholders wealth because they reflect historical situation, having a limited relevance in anticipating the future evolution, not being able to determine the reasons of registering high or low performance of a company [8], [12], [18], [16], [2], [6]. Besides, the profit or net income are considered in assessing the company performance based on accounting measures, not the cost of capital [10].
The economic indicators constituted a step forward because they take into consideration the risk. The profitability resulted is compared with the weighted average cost of capital (WACC) in order to measure the firm’s value.
The main purpose of any company is to enhance its stockholders wealth, so it is necessary to implement effective instruments, which are able to evaluate real value creation [11]. Thus, the concept of value management resulted from the necessity to indentify the real drivers of value.
There are various value based measures of performance but Economic Value Added and Market Value Added are nowdays used by for internal and external evaluation of firms’ performance [4].
The concept of economic value added (EVA) was introduced by Stewart and Stern (Stern Stewart & Company) on the late 1980’s. EVA is a method of measuring the economic value of a business after considering capital cost including debt cost and equity cost (Stewart 1991) which is in fact, the surplus value created on an investment [3].
The MVA is the difference between the total market value of the company and the economic capital [13] and from an investor’s point of view, MVA is the best final measure of a company’s value [4].
The calculation of the two indicators – EVA and MVA - will underline the main advantage and disadvantages of each of them, which will enable the managers to make the correct choice and subsequently to take the best decision regarding the performance measures.
3. Method and results
Economic value added is an estimate of true economic profit and it is a measure that can reflect the wealth of shareholders [15]. Conceptually, EVA - as a measure of value creation - is superior to accounting indicators because it considers the cost of capital and, therefore, the risk level of a firm. The accounting indicators (such as ROE, ROA, ROCE) fail to assess the economic return of a firm, because they are based mostly on the historical asset values.
EVA is defined as the net operating profit after taxes (NOPAT) minus the total costs of capital invested with formula:
EVA = NOPAT – (WACC x Ce) ) (1) where:
WACC = weighted average cost of capital, (calculated as: Cost of Equity x Proportion of equity in total capital + Cost of debt x Proportion of debt in total capital),
Ce = capital employed (economic capital or capital invested) is the sum of equity and debt capital of the company.
The definition of EVA underlines three basic elements for its evaluation: - the return on capital invested,
- the capital employed, - the cost of capital.
A higher return compared to the cost of capital could increases the value of a company while a lower level of return could decrease its value. Therefore, EVA indicates that a company’s value can be increased in situation that the resulted returns are higher than the cost of capital (equity and debt). It means that EVA is positive then the company create value for its stockholders and negative when is not created value.
EVA is a measure that has a direct connection with a company’s market value.
The market value added (MVA) indicates the shareholders value creation. MVA is determined as difference between the total market value of the company and book value the economic capital, also named invested capital [7]:
Market value of company is the sum of market value of debt and market value of equity. Capital employed (invested) is the sum of equity and debt capital of the company.
By simplifying assumption that market and book value of debt are equal [9], the formula will be:
Market Value Added = Market Value of Equity - Book Value of Equity (3)
Maximizing Market Value Added should be one of the primary objectives for any company interested on its shareholders’ welfare [5] and it can be obtained only when the firm earns a return in excess of the cost of capital [1].
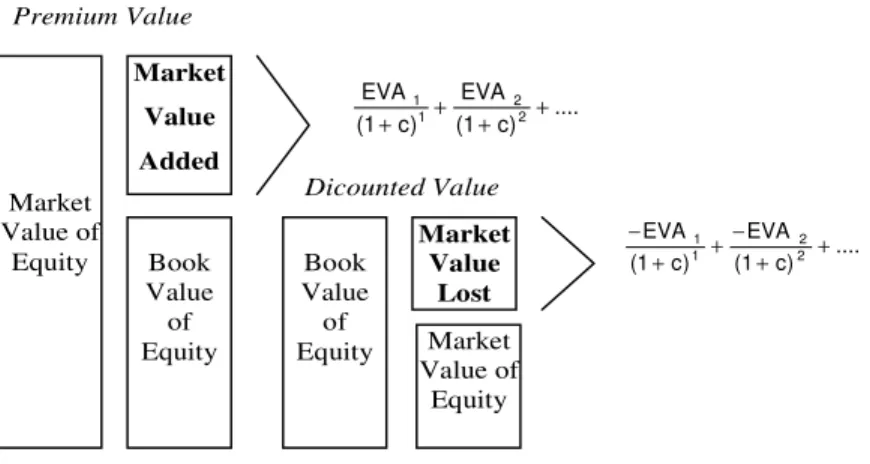
Market value added is equal to present value of all future EVA [16], [6] (figure 1):
Market Value Added =
∑
−
+
n 1 i i i)
c
1
(
EVA
(4)where: c – discounted rate (WACC).
By increasing EVA a company increases its market value added, in fact, increases the difference between company’s value and the amount of capital invested in it [9].
Market Value of Equity Market Value Added Book Value of Equity Premium Value Dicounted Value Book Value of Equity Market Value Lost Market Value of Equity .... ) c 1 ( EVA ) c 1 ( EVA 2 2 1 1 + + + + .... ) c 1 ( EVA ) c 1 ( EVA 2 2 1 1 + + − + + −
Figure 1. Relation between Market Value Added and future EVA [9]
The relationship between EVA and MVA has its implications on valuation. EVA is a function of the relationship between a firm’s earnings and its cost of capital, and MVA is a function of the firm’s expected future EVA, which is direct related to earnings.
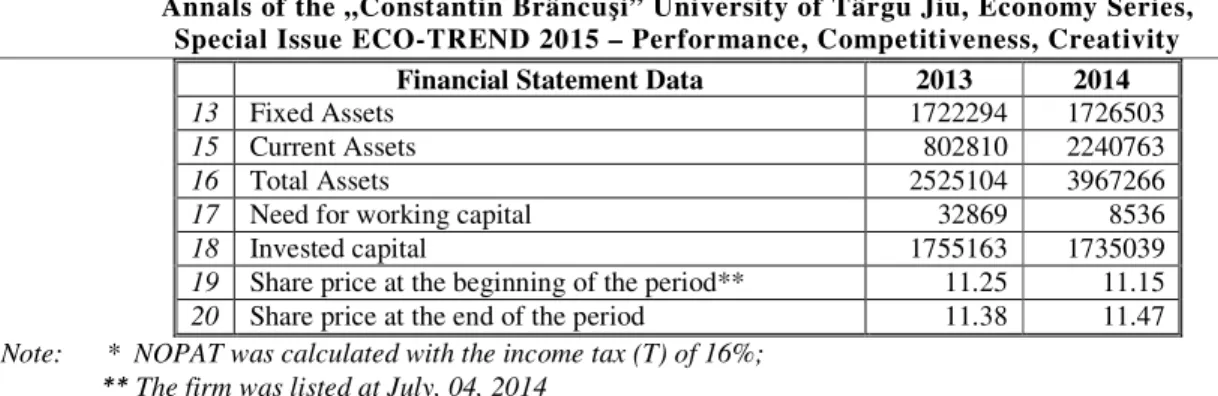
For analysis, we considered the financial statement for a listed firm (tier I) at the Bucharest Stock of Exchange (table no.1).
Table 1. Financial Statement Data (thousand lei)
Financial Statement Data 2013 2014
1 Number of Shares on December 31 207839904 345939929
2 Face Value - lei - 10 10
3 Social Capital 2078399 3459399
4 Equity 2353644 3869557
5 Debtors – due after more than one year 8256 2991
6 Capital Employed 2361900 3872548
7 Gross profit 385303 523451
8 Gross Operating Profit 396856 510196
9 Net Operating Profit after Taxes (NOPAT)* 333359 428565
10 Net Profit 315647 401405
11 Net profit to be distributed (to ordinary shareholders) 244412 287837
11 Average number of shares 206824808 278148979
12 Dividend per Share 0.064 0.081
Financial Statement Data 2013 2014
13 Fixed Assets 1722294 1726503
15 Current Assets 802810 2240763
16 Total Assets 2525104 3967266
17 Need for working capital 32869 8536
18 Invested capital 1755163 1735039
19 Share price at the beginning of the period** 11.25 11.15
20 Share price at the end of the period 11.38 11.47
Note: * NOPAT was calculated with the income tax (T) of 16%;
** The firm was listed at July, 04, 2014
From the evolution of the book value information, it can be noticed an increase of the firm profit based on the same increase of the employed capital. As well, on the financial market it is registered an increase of the shares price.
From the calculation of indicators, which express the value creation, we can notice the following evolution (table no. 2):
Table 2. Indicators calculation
Indicators 2013 2014
1 Earnings per Share (EPS)* 1.52 1.16
3 Return on Assets (ROA) - % 17.98 23,14
4 Return on Capital Employed (ROCE) - % 14.11 11.07
5 Return on Equity (ROE) - % 13.41 10.37
6
WACC =
D
C
D
Rd
D
C
C
Rc
+
⋅
+
+
⋅
(%), where:Rc-cost of equity, Rd-cost of debt, C-shareholders equity, D-debts
7.12 8.82
7
Rc = D1/P0 + g (%) D1/P0 = dividend per share, g = ratio of dividend increase
7.13 8.91
8 b = proportion of capitalization (%) 5.41 7.81
g = b x ROE (%) 0.725 0,810
9 d = nominal interest rate - % 5.00 4.1
10 Rd = d (1-T); where T = 16% 4.2 3.44
11 Economic Added Value (EVA) 165192 87132
12 Market Value Added 275267 98374
13 Total Shareholder Return - % 1.72 3.03
Note: * the firm does not have preferred shares.
In the analyzed company, the high levels of the rates of return (ROA, ROCE, ROE) reflects a better use of resources in the company.
The evolution of the Economic Added Value (EVA) registered a decrease in 2014 compared to 2013 because the weighted average cost of the capital (WACC) increased (from 7.12% to 8.82%) and ROCE decreased in the analyzed period (from 14.11% to 11.07%).
The high levels of WACC are the result of financing the company in a high percentage (99%) by equity that generates a high cost.
A similar evolution can be noticed in the case of the indicator Market Value Added: the increase of the shares price in 2013 determined MVA to register a higher level compared to EVA. MVA registered lower value in 2014 because the firm have several issues of new share in that year.
In analysis of the performance indicators and their correlations, we should consider that EVA is a measure to evaluate internal performance while MVA is a measure for evaluating external performance [11].
Despite these advantages, there are some disadvantages of using EVA: it is considered a tool to measure the performance on short-term because the periodical level of this indicator could not estimate properly the shareholders' value added due to inflation or other factors [17].
From an investor’s point of view, MVA is the best external measure of a company’s performance [16]. But MVA is not a performance metric like EVA, instead it is a wealth metric, a cumulative measure of corporate performance measuring the level of value a company has created for its investors and accumulated over time.
The MVA calculation can indicate how the company has maximized shareholder value and it offers a overview on the company's past, present and future use of capital. MVA measures the market assessment of firm’s value, while EVA measures shareholder value added in terms of real economic performance,
Firms can adopt different development strategies based on the profitability levels achieved but should be taking into consideration that EVA and MVA can be affected by the company's development strategy.
4. Conclusions
As performance indicator, EVA is superior to traditional indicators in assessing value creation and it covers a wide range of managerial decisions, including strategy, planning and capital allocation. Therefore, a sustained increase of EVA will increase the company's market value and its maximization can be settled as a target.
MVA, on the other hand, is simply the difference between the total market value of a company and its invested capital and this modern indicator assesses the value increase compared to the capital invested.
In the system based on value measurement, the market value added can represent the shareholder value creation (a wealth metric) and the economic value added is a performance metric, which reflects the real economic profits of a company.
In fact, the two performance indicators are correlated. Therefore, the best way to maximize MVA is to maximize EVA, which reflects the net earnings of the company in surplus to the charges for shareholders’ capital
In the case of the studied firm (from Bucharest Stock of Exchange) if the analysis had been reduced only to the the accounting indicators (ROA, ROCE, ROE) the conclusion would have been that the firm used efficiently the employed capital. But the introduction of the capital risk suggests that, in fact, the value creation in conformity with the modern indicators EVA and MVA registered a decrease in 2014 compared to 2013. The dynamic of the two indicators - EVA and MVA – reflects the correlation between them considering the discounted value.
Using EVA and MVA has many practical advantages for the companies: they motivate managers to take measures for creation of shareholders’ value (being used a compensatory system in correlation with the results obtained), to adopt the best investment decisions and to identify opportunities for development.
Despite some limits, taking into account the relevance of modern performance indicators, many companies have adopted these as a part of a comprehensive and incentive management system that governs the financial decision process.
Nonetheless, EVA should not be considered the answer to all challanges concerning the value creation. Therefore, this indicator is not a general panacea, it can not solve the business problems, which should remain the financial manager’s responsibility. But in correlation with MVA, EVA offers a target for both internal and external decisions and an important tool to assess the firm’s value and shareholders’ wealth.
Bibliography
[1] Aloy Niresh, J., Alfred, M., The Association between Economic Value Added, Market Value Added and Leverage, International Journal of Business and Management, Vol. 9(10), 2014;
[2] Chen, S., Dodd, J.L., Economic value added: An empirical examination of a new corporate performance measure, Journal of Managerial Issues,9(3), pp. 318-333,1997;
[3] Damodaran, A., Investment Valuation. Tools and techniques for determining the value of any asset, 3rd Ed, J. Willey&Sons, 2012;
[4] de Wet, J.H., Hall, J.H., The relationship between EVA, MVA and leverage, Meditari Accountancy Research Vol. 12 No. 1, pp. 39–59, 2004;
[5] Dierks, P. A., Patel. A., What is EVA, and how can it help your company?, Management Accounting, pp. 52-58, November 1997;
[6] Ehrbar, A. L., Using EVA to measure performance and assess strategy, Strategy & Leadership, 27(3), pp. 20-24, 1999;
[7] Firer, C., Investment Basics XXX EVATM: the real key to creating value, Investment Analysts Journal, No. 40, pp.57–59, 1995;
[9] Mäkeläinen, E., Economic Value Added as a management tool, Helsinki School of Economics and Business Administration, Department Accounting and Finance, 1998;
[10] Nakhaei, H., Hamid, N.I.N.B., The Relationship between Economic Value Added, Return on Assets, and Return on Equity with Market Value Added in Tehran Stock Exchange (TSE), Proceedings of Global Business and Finance Research Conference 28-29 October, Taipei, Taiwan, 2013;
[11] Panahi, B., Preece, C. N., Zakaria, W. N. W., Rogers, J., The Correlation of EVA and MVA with Stock Price of Companies in Tehran Stock Market, Interdisciplinary Journal of Contemporary Research in Business, vol. 6(2), pp. 291-309, June 2014;
[12] Rappaport, A., Creating Shareholder Value, The Free Press, New York, 1986;
[13] Reilly, F.K., Brown, K.C., Investment Analysis Portfolio Management, 7th edition, Thomson-South Western, Cincinnati, 2003;
[14] Sharma, A. K., Kumar, S., EVA Versus Convenational Performance Measures - Empirical Evidence from India, ASBBS Annual Conference, Las Vegas, 2012;
[15] Stern, J.,Value and People Management, Corporate Finance, pp. 35–37, July 1993; [16] Stewart, G.B., The Quest for Value, Harper-Collins, New York, 1991;
[17] Vasilescu L., Popa, A., Economic Value Added: Pros and Cons, Finance - Challanges of the Future, Vol. I(13), pp. 60-65, 2011;