Genetic Influence on Slope Variability in a
Childhood Reflexive Attention Task
Rebecca A. Lundwall1,2*, Jeffrey K. Watkins2
1Psychology Department, Brigham Young University, Provo, UT, United States of America,2Neuroscience Center, Brigham Young University, Provo, UT, United States of America
Abstract
Individuals are not perfectly consistent, and interindividual variability is a common feature in all varieties of human behavior. Some individuals respond more variably than others, how-ever, and this difference may be important to understanding how the brain works. In this paper, we explore genetic contributions to response time (RT) slope variability on a reflexive attention task. We are interested in such variability because we believe it is an important part of the overall picture of attention that, if understood, has the potential to improve inter-vention for those with attentional deficits. Genetic association studies are valuable in dis-covering biological pathways of variability and several studies have found such
associations with a sustained attention task. Here, we expand our knowledge to include a reflexive attention task. We ask whether specific candidate genes are associated with inter-individual variability on a childhood reflexive attention task in 9–16 year olds. The genetic
makers considered are on 11 genes:APOE,BDNF,CHRNA4,COMT,DRD4,HTR4,IGF2,
MAOA,SLC5A7,SLC6A3, andSNAP25. We find significant associations with variability with markers on nine and we discuss the results in terms of neurotransmitters associated with each gene and the characteristics of the associated measures from the reflexive atten-tion task.
Introduction
Interindividual variability occurs in a variety of human behaviors, including how we pay atten-tion. Such variability may arise because it takes effort to maintain focus while attending to cer-tain tasks, and there are periodic lapses in the ability to suscer-tain that effort [1]. Variability measures are commonly included on sustained attention tasks such as the Continuous Perfor-mance Test (CPT) [2] and the Sustained Attention to Response Task (SART) [3]. There are also elements of effort over the course of a reflexive attention task.
The variability captured during a reflexive attention task is an important component of attention (representing an individual’s ability to ignore distracting stimuli that“pull”attention in reorienting of the brain’s resources). It can be measured using a modification of Posner’s ori-enting task [4]. In these tasks, stimuli often newly appear, have a relatively salient color, or a11111
OPEN ACCESS
Citation:Lundwall RA, Watkins JK (2015) Genetic Influence on Slope Variability in a Childhood Reflexive Attention Task. PLoS ONE 10(6): e0130668. doi:10.1371/journal.pone.0130668
Editor:Ana Paula Arez, Instituto de Higiene e Medicina Tropical, PORTUGAL
Received:February 2, 2015
Accepted:May 22, 2015
Published:June 23, 2015
Copyright:© 2015 Lundwall, Watkins. This is an open access article distributed under the terms of the Creative Commons Attribution License, which permits unrestricted use, distribution, and reproduction in any medium, provided the original author and source are credited.
Data Availability Statement:Data data are available from the Brigham Young University Scholars Archive athttp://works.bepress.com/rebecca_lundwall/.
involve motion [5–7]. Like many human behaviors, the ability to ignore distractors varies from time to time. Some participants will display more variability than others.
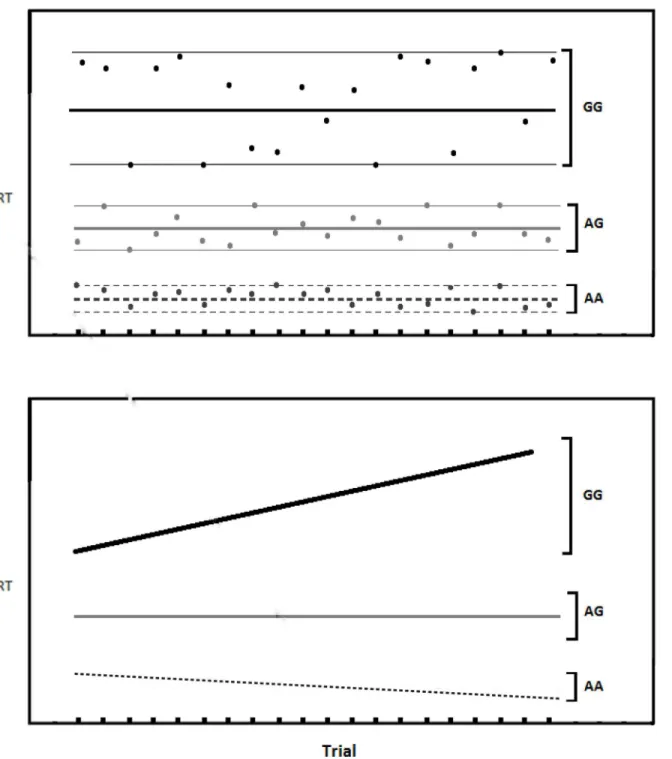
While moment-to-moment variability (see the top portion ofFig 1) is commonly measured, we are interested in the less commonly measuredslope variability, which refers to the change in a participant’s RT over the course of the task. It might be observed, for example, that early task RTs are faster than later task RTs (see the bottom portion ofFig 1). This might occur because once-salient stimuli become habituated (less-novel). Alternatively, some participants may start a task with slow RTs and speed up as the task progresses, which might happen if learning is improving performance. RT variability seems to be as important in examining indi-vidual differences as mean RT [8–10]. The tendency to speed up or slow down might index cer-tain aspects of the individual’s overall ability to pay attention.
While slope variability is not well studied in reflexive attention tasks, genetic associations are particularly lacking. Genes make proteins, including neurotransmitters, receptors, and enzymes that catabolize neurotransmitters. Therefore, it is plausible that the biological pathway between the brain and behavior (such as attending) will include neurotransmitters whose avail-ability make neural transmission more or less efficient. Two types of genetic markers are single nucleotide polymorphisms (SNPs) and variable number tandem repeats (VNTRs). A SNP is a variation at a single point (i.e., a single nucleotide) in the genetic sequence. A VNTR is a varia-tion in the number of copies of a short string of nucleotides. The nucleotide (for SNPs) and number of copies of a repeat (for VNTRs) is inherited from parents.
Although few studies have examined the influence of genetic markers on reflexive attention task variability at all (either moment-to-moment or slope), several studies have found plausible evidence for the link between specific genetic markers and variability on sustained attention tasks. For example, one hypothesis is that genetic contribution to RT variability occurs via a dopamine deficit. This hypothesis is supported, in part, because those with ADHD have been found to have reduced dopamine levels [11] and medication that increases dopamine availabil-ity is helpful in treating ADHD [12]. But there are also subtle effects on individuals in the gen-eral population. For example, Stefanis, van Os [13] found that a Val allele onCOMT(which catabolizes dopamine) is associated with increased RT variability on the CPT in the general population. This is significant because it indicates that research that may lead to pharmacologi-cal treatments can begin by studying very specific deficits (endophenotypes) [8,14] in the gen-eral population.
In addition, some genes have been associated with slope variability on sustained attention tasks. For example, Thakur, Sengupta [15] found significant associations betweenSLC6A2
(which codes for the norepinephrine transporter) and Hit RT Block change of the CPT (which measures slowing over the course of the task). The risk allele was overtransmitted to individuals with higher scores (i.e., more RT slowing).SLC6A2is responsible for reuptake of norepineph-rine into the presynaptic membrane. Because norepinephnorepineph-rine is synthesized from dopamine the relative levels of these two neurotransmitters are related and this is indirect evidence that genotype can influence the slope of RT over the course of a task.
Another genetic hypothesis is that acetylcholine contributes to attentional variability. This hypothesis is supported, in part, because nicotine patches (which act on acetylcholine recep-tors) improve general attention in both schizophrenic patients and nonpsychiatric controls [16]. Findings with acetylcholine also have implications that may be used to further research into pharmacological treatments and practical interventions targeted to very specific atten-tional behaviors.
Finally, we examine genes that are associated with serotonin, which acts as a signal in brain development [17] and has been associated with social attention in infants [18]. Serotonin has also been associated with attention-deficit disorder generally [19,20] and with both behavioral index.aspx). The funders had no role in study design,
data collection and analysis, decision to publish, or preparation of the manuscript.
and cognitive impulsivity more specifically [21]. Of particular interest to this study, serotonin has been associated with increased RT variability [22–24]. Therefore, this neurotransmitter likewise appears linked with some aspects of attention.
Since evidence exists that links specific genes with interindividual variability on sustained attention tasks and with slope variability as well as moment-to-moment variability, research
Fig 1. Hypothetical illustration of the two types of variability addressed in this paper.Top. Moment-to-moment variability showing more variability for the GG genotype and less for the AA genotype.Bottom. Slope variability showing increase RT over the course of the task (GG genotype) and decreasing RT (AA genotype). It is possible for subjects to have both types of variability. In this paper we examine slope variability.
should be conducted to see if this link holds in reflexive attention tasks. We examine genes related to three neurotransmitters (acetylcholine, dopamine, and serotonin) which have already been associated with attentional variability and brain development. The genetic mark-ers selected for the study are on 11 genes:APOE,BDNF,CHRNA4,COMT,DRD4,HTR4,
IGF2,MAOA,SLC5A7,SLC6A3, andSNAP25. We studied these genes using slope variability on a reflexive attention task where we expected individual differences in the ability to maintain consistent RTs. Performance data on RT slope over the reflexive attention task was analyzed in relation to genetic data.
Materials and Methods
Participants
Recruitment. Participants were recruited after Institutional Review Board (IRB) approval from Rice University (IRB-Human subjects) and the University of Wisconsin-Madison (the Social and Behavioral Sciences IRB). Additional data analysis was performed under Institu-tional Review Board approval from Brigham Young University (the IRB for Human Subjects). All procedures were in accordance with the ethical standards of these universities and with the Helsinki Declaration of 1975, as revised in 2000. Written informed consent was obtained from the parents of all children and assent was obtained from children included in the study. Partici-pants were recruited from 854 children (9–16 years old) for whom we had infant attention scores [25]. When they were 3–6 months old, the participants had been presented with a dis-play with a moving bar in a field of static bars. An adult observer, blind to the side of the mov-ing bar, made left-right judgments of the side of the infants’looking. The data we have on the infants includes the percent correct (PC) compared to the actual side of the moving bar. We used infant PC the residual scores (representing variability to be explained after controlling for gestational age, sex, and birthweight) and these scores were used to determine which children to invite for computer testing in the lab. Data collected represent an oversampling of the upper and lower one-third of the distribution because we determined that these children most likely to represent children who might require intervention.
Of the 854 original participants, we excluded 77 children who could not be located 10–15 years after they were first tested and 21 who had a sibling in the study (to avoid genetic associa-tions due to non-independence). Remaining children who lived in the Madison, Wisconsin, area and were in the upper and lower one-third of the infant distribution of residual PC scores were invited to visit the Waisman Center to complete the computerized attention task. Chil-dren who did not live in the Madison area or were in the middle one-third of the infant distri-bution were invited to participate by mail, however 14 children from the middle one-third also participated. Of the 756 invited to participate, 203 participated in-person and 129 participated by mail. This is a 44% participation rate, which is not unusual for a long-term longitudinal fol-low-up study [26–28], especially when there is no intervening contact over the 10 to 15 years. All children, whether they participated in-person or by mail, provided a saliva sample and their parents completed a questionnaire. The attention task completed by the 203 children available to travel to the Waisman Center is described below.
excluded for having uncorrected visual disorders. The data of these remaining 190 children are included in final analyses.
Measures
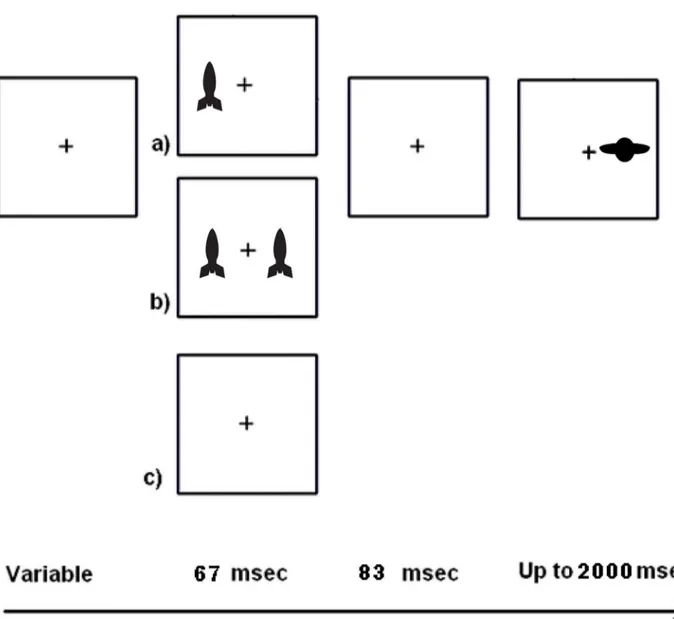
The spatial cueing (SC) task used in this study was a Posner-like reflexive attention task [4] and was similar to that used in our previous study conducted with adults [30]. The child ver-sion of the task was modified to engage the interest of children while still maintaining the abil-ity to measure visual reflexive attention to suddenly appearing stimuli a (Fig 2). The stimuli we used, rockets and alien spaceships, were designed to be salient and attractive to children (in contrast with a sustained attention task, which has tedious stimuli by design).
Participants were tested in a darkened room on a 381 x 305 mm monitor with a 60 Hz refresh rate. Viewing distance was maintained at 57 cm with a chin rest. EPrime (Sharpsburg, PA) was used to present stimuli. Cues had an inner edge 7.0 deg from central fixation. Targets
Fig 2. Schematic of the child spatial cueing (SC) task.The cue duration plus the gap duration (inter-stimulus interval) makes the stimulus onset asynchrony (SOA) 150 msec. The inter-trial interval varied from 600–3000 msec.
had an inner edge 5.7 deg from fixation. The task was designed as a game with friendly“earth”
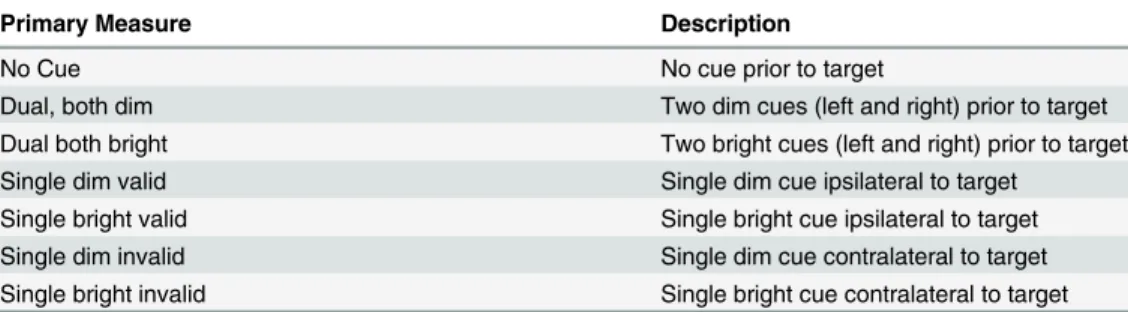
rockets and alien spaceships. Earth rockets flashed briefly (67 msec) and acted as cues. Children were told to ignore them as much as possible. After a brief gap (83 msec) an alien spaceship could appear. These were targets to which children were instructed to make a right or left key press (spatially mapped to the location of the target). The cues could be valid (i.e., appear near where the target would appear) or invalid (appear contralateral to the target). Fifty-percent of the cues were valid. Since this is chance, children were told that paying attention to the earth rockets would not help them. Participants are typically faster at responding to a target that is preceded by a valid pre-cue even though the stimuli presentation is too brief to depend on eye movement. There were also neutral cues, with one cue on each side of the display. This condi-tion did not bias attencondi-tion to either the left- or the right-side. The use of two different cue con-trasts (faded and unfaded, described here as dim and bright, respectively) yielded seven measures (i.e., No Cue, Neutral Dim, Neutral Bright, Single Bright Valid, Single Bright Invalid, Single Dim Valid, and Single Dim Invalid). There were 24 trials of each condition intermixed and pseudo-randomly presented over the course of the task. There were also 12 catch trials with not target on which participants were instructed to withhold response. Only a partici-pant’s correct trials were included in analyses (Table 1).
We also measured daytime sleepiness in children using the Epworth Sleepiness Scale-Chil-dren (ESS-C) [31]. The original version of the Epworth Sleepiness Scale (ESS) has eight items. All items are statements to which the participant is to respond“How likely are you to doze off or fall asleep in the following situations in contrast to just feeling tired?”The child version (ESS-C) has seven of the original items plus a replacement item. Instead of likelihood of falling asleep“in a car, while stopped for a few minutes in the traffic”the child version has likelihood of falling asleep while“doing homework or taking a test.”All questions have to do with falling asleep in daytime situations where people who are getting enough sleep are unlikely to fall asleep [31]. Parents completed the questionnaire for their children. We used sleepiness scores as a covariate in the statistical models.
Genetic data
The markers under consideration were on 11 genes (i.e.,APOE,BDNF,CHRNA4,COMT,
DRD4,HTR4,IGF2,MAOA,SLC5A7,SLC6A3 [DAT1], andSNAP25). These genes are related either to the availability of neurotransmitters such as acetylcholine, dopamine, and serotonin and to growth, brain development, attention, or general cognition. Multiple markers were used for each gene. These markers are SNPs and VNTRs. Risk alleles for some aspect of attention or cognition are known for 23 of the 39 markers.
Table 1. Primary measures.
Primary Measure Description
No Cue No cue prior to target
Dual, both dim Two dim cues (left and right) prior to target
Dual both bright Two bright cues (left and right) prior to target
Single dim valid Single dim cue ipsilateral to target
Single bright valid Single bright cue ipsilateral to target
Single dim invalid Single dim cue contralateral to target
Single bright invalid Single bright cue contralateral to target
Genetic data were collected from each participant using an Oragene-500 kit (DNA Genotek, Kanata, Ontario, Canada). Each kit collects approximately 2 ml of saliva, which can then be purified to obtain DNA. Nucleotides can be tagged with a fluorescent dye. Genotyping was per-formed using the GoldenGate assay on the BeadXpress system (Illumina, Inc.). Once the array had been visualized with the BeadXpress reader, wavelength and intensity values of the fluores-cence were used to determine genotype. Allele detection and genotype calling were performed using GenomeStudio software v2011.1 (Illumina, Inc.). Genotype was coded as an ordinal vari-able with zero indicating no genetic risk, one indicating intermediate risk, and two indicating higher risk of attentional deficits.
Statistical analysis
As described under Recruitment, we used a modified extreme group design including a limited number of participants from the middle of the infant PC distribution. This is an oversampling of the extreme ends of the distribution. Those in the extreme groups might need intervention in the sense that (if we could determine infant indicators of child difficulties) we could try to prevent infants from developing problems as children. However, we did not specifically try to recruit children who were having such problems because the traits we are interested in are likely normally distributed in the population. Using a specific endophenotype rather than a diagnosis to define groups is a genetically sound practice.
Statistically, by minimizing the within-group variance and maximizing the between group differences in the predictor variables it becomes easier to look at the relations between predic-tors and outcomes. Even though some researchers have discouraged the use of extreme group designs, the use of a continuous variable and an oversampling of the extremes is statistically justified [32]. We have data from 14 cases in the middle one-third of the infant distribution who are included in the analysis.
Prior to analyses, RTs were prepared as follows. Only RTs of correct trials were analyzed for genetic association. Correct responses were those for which the participant (1) selected the side on which the target appeared and (2) responded between 200 and 1000 msec after the target appeared. It is nearly impossible for a child to respond to a target in under 200 msec and so RTs lower than this were assumed to be anticipatory. Likewise, RTs longer than 1000 msec are quite slow for this type of task and were assumed to represent lapses in attention.
To examine slope we used a mixed (multilevel) model analysis. A multilevel model analysis is similar to a regression analysis but accounts for the nested nature of the data. We used this method because an intraclass correlation indicated that 31% of the variance came from the individual (level 2) data and we needed to take this into account when analyzing trial level (level 1) data. We entered all 39 markers, sleepiness, age, trial number, infant percent correct score, and the interaction between trial number and genetic marker as predictors of RT. How-ever, because we were interested in slopes over the course of the task, we only examined output pertaining to the interaction between the genetic marker and trial number. Models for each of the seven outcome variables were tested separately using SPSS version 21.
Results
Descriptives
In this study, all SNPs were in Hardy-Weinberg equilibrium with allp-values greater than .36. This indicates that, given the minor allele frequency based on a Caucasian population, the observed genotypes are not significantly different from the expected genotypes.
Average error rate per child was highly variable (range 0% to 53.89%,M= 7.83%,
with an error rate over 40% (n= 5). Of the children whose data were included, 50.92% were male. Their ages ranged from 9 to 16 years (M= 12.46,SD= 1.77).
Using only included participants, RTs ranged from 200 to 999 milliseconds (M= 390.90 msec,SD= 95.04 msec). Because RTs were somewhat skewed (skewness = 1.48,SE= 0.18), the logarithm of RT was used for statistical analyses so that the data met assumptions for normal-ity. As expected, skewness was reduced, skewness = 0.04,SE= 0.18.
Main analyses
We examined interactions between genotype and trial number using seven multilevel models predicting log transformed RT. As described above, multilevel modeling is similar to regression analysis but accounts for the nested nature of the data (i.e., trials can be attributed to individu-als). We entered 39 genetic markers, sleepiness, age, infant percent correct score, trial number and the interaction between trial number and genetic marker as predictors of log transformed RT. The improvement of each model over a baseline model with no predictors was significant (for all models,χ2[134,N= 29880]>1934.70, p<.001), and all models passed Bonferroni correction. Because our primary question involved genetic associations with RT slope, we examined the interaction between genotype and trial number in predicting log transformed RT for each of seven outcome measures. Five of seven mixed multilevel models contained a total of 21 significant associations (involving 15 genetic markers; seeTable 2). Following a brief over-view, we will report each significant genetic association.
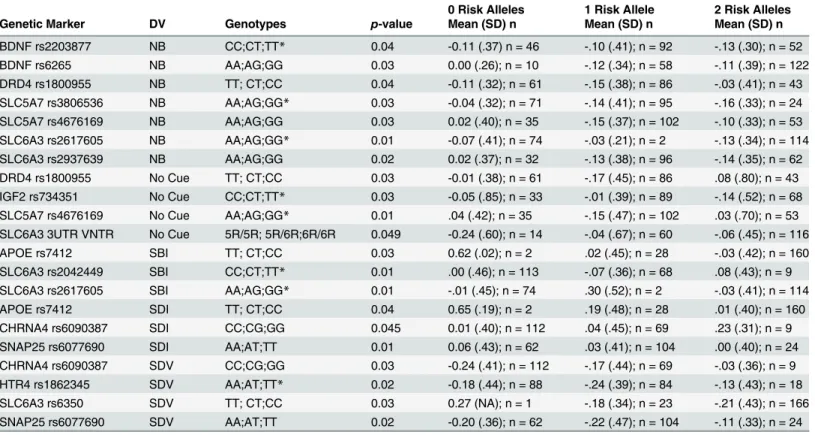
The interaction between genotype and trial number (i.e., slope) was significantly associated with markers on nine genes. As can be seen inTable 2, two SNPs onBDNF, one onDRD4, two onSLC5A7, and two onSLC6A3were significantly associated with slopes for the Neutral Bright condition. One SNP each onDRD4,IGF2,SLC5A7, andSLC6A3was associated with slopes for the No Cue condition. One SNP onAPOEand two SNPs onSLC6A3were significantly associ-ated with slopes for the Single Bright Invalid condition. One SNP each onAPOE,CHRNA4, andSNAP25was associated with the slopes for the Single Dim Invalid condition. Finally, one SNP each onCHRNA4,HTR4,SLC6A3, andSNAP25was associated with the Single Dim Valid condition. We will describe the direction of these significant findings in more detail by the neu-rotransmitter with which each gene is associated.
Acetylcholine. There were two associations with markers onAPOE, both involving the rs7412 SNP. Rs7412 genotype groups differed significantly for slopes on the Single Bright Invalid condition,F(2, 3348) = 3.58,p= .03. Mean slope RT for those with zero risk alleles was 0.62 msec (SD= 0.02 msec), although there were only two individuals in this genotype group. Nevertheless, slope for those with one risk allele is in a different direction (0.02 msec;SD= 0.45 msec) from those with two risk alleles (-0.03 msec;SD= 0.42 msec). Only the two risk allele group is improving over the course of the task (over 180 total trials since trial number is used in analyses).
TheAPOErs7412 genotype groups also differed significantly for slopes corresponding to the Single Dim Invalid condition,F(2, 3587) = 3.28,p= .04. Slope RT for those with zero risk alleles was 0.65 msec (SD= 0.19 msec). Slope RT for those with one risk allele was 0.19 msec (SD= 0.48 msec), and was 0.01 msec (SD= 0.40 msec) for those with two risk alleles. No indi-viduals were improving over the course of the task for this condition, but the two-risk allele group showed the smallest increase in RT.
SD= 0.45 msec). Likewise, Single Dim Valid (F[2, 3534] = 3.68,p= .03) had a significant linear trend in the same direction. Those with no risk alleles had a slope of -0.24 msec (SD= 0.41 msec), those with two risk alleles had slopes of -0.03 msec (SD= 0.36 msec), and heterozygotes had slopes between these two extremes,M= -0.17 msec;SD= 0.44 msec. This is a linear trend showing worse performance the more copies of the risk allele.
TheSLC5A7gene had two SNPs significant for differential association with slopes by geno-type. Rs3806536 was associated with Neutral Bright,F(2, 3577) = 3.50,p= .03. The risk allele for this SNP is unknown for attentional deficits. Slope RT for those with the AA genotype was -0.04 msec (SD= 0.32 msec). Slope for those with the AG genotype was -0.14 msec (SD= 0.41 msec) and -0.16 msec (SD= 0.33 msec) for those with the GG genotype. In other words, those with the AA genotype showed the least improvement over the course of the task. Rs4676169 was associated with the No Cue condition,F(2, 3778) = 4.69,p= .01 and with the Neutral Bright condition,F(2, 3577) = 3.70,p= .03. For the No Cue condition, those with the AA genotype has slopes of 0.04 msec (SD= 0.42 msec). Those with the AG genotype had slopes of -0.15 msec (SD= 0.47 msec) and those with the GG genotype had slopes of .03 msec (SD= .70 msec). For the Neutral Bright condition those with the AA genotype had slopes of 0.02 msec (SD= 0.40 msec). Those with the AG genotype had slopes of -0.15 msec (SD= 0.37 msec) and those with the GG genotype had slopes of -0.10 msec (SD= 0.33 msec). In both cases the
Table 2. RT Slope Variability Means
0 Risk Alleles 1 Risk Allele 2 Risk Alleles Genetic Marker DV Genotypes p-value Mean (SD) n Mean (SD) n Mean (SD) n
BDNF rs2203877 NB CC;CT;TT* 0.04 -0.11 (.37) n = 46 -.10 (.41); n = 92 -.13 (.30); n = 52
BDNF rs6265 NB AA;AG;GG 0.03 0.00 (.26); n = 10 -.12 (.34); n = 58 -.11 (.39); n = 122
DRD4 rs1800955 NB TT; CT;CC 0.04 -0.11 (.32); n = 61 -.15 (.38); n = 86 -.03 (.41); n = 43 SLC5A7 rs3806536 NB AA;AG;GG* 0.03 -0.04 (.32); n = 71 -.14 (.41); n = 95 -.16 (.33); n = 24 SLC5A7 rs4676169 NB AA;AG;GG 0.03 0.02 (.40); n = 35 -.15 (.37); n = 102 -.10 (.33); n = 53 SLC6A3 rs2617605 NB AA;AG;GG* 0.01 -0.07 (.41); n = 74 -.03 (.21); n = 2 -.13 (.34); n = 114 SLC6A3 rs2937639 NB AA;AG;GG 0.02 0.02 (.37); n = 32 -.13 (.38); n = 96 -.14 (.35); n = 62 DRD4 rs1800955 No Cue TT; CT;CC 0.03 -0.01 (.38); n = 61 -.17 (.45); n = 86 .08 (.80); n = 43 IGF2 rs734351 No Cue CC;CT;TT* 0.03 -0.05 (.85); n = 33 -.01 (.39); n = 89 -.14 (.52); n = 68 SLC5A7 rs4676169 No Cue AA;AG;GG* 0.01 .04 (.42); n = 35 -.15 (.47); n = 102 .03 (.70); n = 53 SLC6A3 3UTR VNTR No Cue 5R/5R; 5R/6R;6R/6R 0.049 -0.24 (.60); n = 14 -.04 (.67); n = 60 -.06 (.45); n = 116
APOE rs7412 SBI TT; CT;CC 0.03 0.62 (.02); n = 2 .02 (.45); n = 28 -.03 (.42); n = 160
SLC6A3 rs2042449 SBI CC;CT;TT* 0.01 .00 (.46); n = 113 -.07 (.36); n = 68 .08 (.43); n = 9 SLC6A3 rs2617605 SBI AA;AG;GG* 0.01 -.01 (.45); n = 74 .30 (.52); n = 2 -.03 (.41); n = 114
APOE rs7412 SDI TT; CT;CC 0.04 0.65 (.19); n = 2 .19 (.48); n = 28 .01 (.40); n = 160
CHRNA4 rs6090387 SDI CC;CG;GG 0.045 0.01 (.40); n = 112 .04 (.45); n = 69 .23 (.31); n = 9 SNAP25 rs6077690 SDI AA;AT;TT 0.01 0.06 (.43); n = 62 .03 (.41); n = 104 .00 (.40); n = 24 CHRNA4 rs6090387 SDV CC;CG;GG 0.03 -0.24 (.41); n = 112 -.17 (.44); n = 69 -.03 (.36); n = 9 HTR4 rs1862345 SDV AA;AT;TT* 0.02 -0.18 (.44); n = 88 -.24 (.39); n = 84 -.13 (.43); n = 18
SLC6A3 rs6350 SDV TT; CT;CC 0.03 0.27 (NA); n = 1 -.18 (.34); n = 23 -.21 (.43); n = 166
SNAP25 rs6077690 SDV AA;AT;TT 0.02 -0.20 (.36); n = 62 -.22 (.47); n = 104 -.11 (.33); n = 24
NB = Neutral Bright; SBI = Single Bright Invalid; SDI = Single Dim Invalid; SDV = Single Dim Valid
Analyses were conducted with the log transformed RT using covariates; however unadjusted, raw RTs are shown for interpretability. Positive slopes indicate increasing RT across approx. 24 trials of a given type (only correct trials were used).
*= unknown risk allele
heterozygotes improved in RT across the task. This pattern of results is termed heterozygous advantage.
TheSNAP25gene is associated with all three neurotransmitters discussed in this paper. It had one SNP significant for differential association with two outcomes. Rs6077690 was signifi-cantly associated with slopes for Single Dim Invalid (F[2, 3587] = 4.39,p= .01) and Single Dim Valid,F(2, 3534) = 3.73,p= .02. For the association with Single Dim Invalid, the slope for those with the zero risk alleles the slope was 0.06 msec (SD= 0.43 msec). For those with one risk allele the slope was 0.03 msec (SD= 0.41 msec), and for those with two risk alleles the slopes was 0.00 msec (SD= 0.40 msec). For Single Dim Invalid, those with two risk alleles are not slowing over the course of the task while the other two genotype groups are. This is an overall linear trend. For Single Dim Valid, the linear trend is reversed so that those with two risk alleles are making the least improvement over the task. Slope for the zero risk allele group is -0.20 msec (SD= 0.36 msec). For the one risk allele group the slope is -0.22 msec (SD = 0.47 msec) and for the two risk allele group the slope is -0.11 msec (SD= 0.33 msec). This pattern of results is consistent with the risk allele as established in the literature.
Dopamine. TheDRD4rs1800955 is significantly associated with slopes for the No Cue condition (F[2, 3778] = 3.43,p= .03) and for the Neutral Bright condition,F(2, 3577) = 3.27,
p= .04. For the No Cue condition, slope RT for those with zero risk alleles was -0.01 msec (SD= 0.38 msec). Slope RT for those with one risk allele was -0.17 msec (SD= 0.45 msec), and was 0.08 msec (SD= 0.80 msec) for those with two risk alleles. Those with two risk alleles get slower over the course of the task while heterozygotes made the most improvement. While this is consistent with the risk allele as identified in the literature, the pattern of results also shows heterozygous advantage. For Neutral Bright, those with zero risk alleles had slopes of -0.11 msec (SD= 0.32 msec); those with one risk allele had slopes of -0.15 msec (SD= 0.38 msec); and those with two risk alleles had slopes of -0.03 msec (SD= 0.41 msec). This also shows a pat-tern consistent with heterozygous advantage.
TheIGF2gene had one SNP significant for differential association with slopes by genotype. Rs734351 was associated with No Cue,F(2, 3778) = 3.39,p= .03. The risk allele for this SNP has not been established. Slope RT for those with the CC genotype was -0.05 msec (SD= 0.85 msec). Slope for heterozygotes was -0.01 msec (SD= 0.39 msec), and -0.14 (SD= 0.52 msec) for those with the TT genotype. This indicates that those with the TT genotype are getting the fastest over the course of the task.
SLC6A3 had six significant associations on four outcome measures. TheSLC6A3VNTR was significantly associated with slopes for the No Cue condition,F(2, 3778) = 3.00,p= .049. Those with no risk alleles (i.e., the 5R/5R genotype) had slopes of -0.24 msec (SD= 0.60 msec). Heterozygotes had slopes of -0.04 msec (SD= 0.67 msec) and those with two risk alleles had slopes of -0.06 msec (SD= 0.45 msec). That is, those with two risk alleles are not getting faster over the course of the task for this condition as much as those with no risk alleles.
For rs2042449 there were also significant differences by genotype on slopes for the Single Bright Invalid condition,F(2, 3348) = 4.44,p= .01. The risk allele for this SNP has not been established; however, those with the CC genotype did not improve on RTs over the course of the task (their slope was 0.00 msec;SD= 0.46 msec) and those with the TT genotype slowed down over the course of the task (their slope was 0.08 msec;SD= 0.43 msec). Heterozygotes, however, did improve (their slope was -0.07 msec;SD= 0.36 msec). This pattern is heterozy-gous advantage.
(SD= 0.52 msec), but there were only two participants in this group. This pattern is suggestive of a heterozygote disadvantage, but the heterozygote group is so small that it is difficult to say for sure. For Neutral Bright, those in the zero risk group had slopes of -0.07 msec (SD= 0.41 msec); heterozygotes had slopes of -0.03 msec (SD= 0.21 msec); and those in the two risk group had slopes of -0.13 msec (SD= 0.34 msec). For this condition results are opposite those expected for sustained attention.
Rs2937639 onSLC6A3was significant for slopes on Neutral Bright (F[2, 3577] = 3.82,
p= .02). Slopes for those with zero risk alleles were 0.02 msec (SD= 0.37 msec) while those with one risk allele had slopes of -0.13 msec (SD= 0.38 msec) and those with two risk alleles had slopes of -0.14 msec (SD= 0.35 msec). This is the opposite direction of effect from estab-lished risk.
Rs6350 onSLC6A3was significant for slopes on Single Dim Valid,F(2, 3534) = 3.69,
p= .03. Slopes for those with zero risk alleles were 0.27 msec (but there was only one partici-pant in this genotype group). Nevertheless, those with one risk allele had slopes of -0.18 msec (SD= 0.34 msec) and those with two risk alleles had slopes of -0.21 msec (SD= 0.43 msec). Both genotype groups are getting faster, but the two risk allele group improved more.
Serotonin. TheBDNFgene had two SNPs significant for differential association with slopes by genotype. Rs2203877 was associated with slopes for the Neutral Bright condition (F(2, 3577) = 3.13,p= .04) and rs6265 was also associated with slopes for the Neutral Bright condition,F(2, 3577) = 3.61,p= .03. For rs2203877, the risk allele is unknown. Slope RT for those with the CC genotype was -0.11 msec (SD= 0.37 msec). Slope for heterozygotes was -0.10 msec (SD= 0.41 msec), and slope for those with the TT genotype was -0.13 msec (SD= 0.30 msec). In this pattern, C appears to be the risk allele for this condition with a reflex-ive attention task. For rs6265 the zero risk allele group showed no improvement in RT over the course of the task (the slope was 0,00 msec (SD= 0.26 msec). For the one risk allele group slope was -0.12 msec (SD= 0.34 msec). For the two risk allele group, slope was -0.11 msec (SD = .39 msec). This pattern is opposite the expected based on the risk allele.
HTR4rs1862345 is significantly associated with slopes for the Single Dim Valid condition,
F(2, 3534) = 4.17,p= .02. The risk allele is unknown. Those with the AA genotype had a slope of -0.18 msec (SD= 0.44). Those with the AT genotype had a slope of -0.24 msec (SD= 0.39 msec). Those with the TT genotype had a slope of -0.13 msec (SD= 0.43 msec). This pattern of results suggests heterozygous advantage.
Discussion
Here we have shown that genetic markers influence slope variability on a reflexive attention task. Our findings are unlikely to be due solely to chance because (1) the models reported sur-vived correction for multiple comparisons, (2) entering all genetic markers in a single model negates the need for correction for multiple comparisons within that model, and (3) they are biologically plausible. Regarding this third point, we tested genes involved in dopamine path-ways (i.e.,COMT,DRD4,IGF2,MAOA,SLC6A3, andSNAP25), which have been established as associated with some aspects of attention [33,34]. Similarly,BDNF,HTR4,MAOAand
SNAP25have been implicated in serotonin pathways, which have also been associated with attention [21], andAPOE,SLC5A7,CHRNA4, andSNAP25have been connected to acetylcho-line pathways, likewise associated with attention [35].
showing heterozygous advantage onDRD4andSLC6A3) or for similar effects on theSLC5A7
associated with acetylcholine and theHTR4gene associated with serotonin. This idea is explained later in more detail but essentially involves the idea that either too little or too much dopamine is problematic. Other findings might be explained by differences between this task and the task with which the gene (APOE,BDNF,SLC6A3, orSNAP25) was previously associ-ated in the literature (because 7 of 14 associations with known risk allele in this report show an opposite direction of effect than that previously identified). Risk was established with atten-tional components in disorders such as Alzheimer’s disease [36], ADHD [37–39], depression [40,41], memory impairment [42,43], sustained attention deficits [21,44–48].
In all, there were 21 association between 15 genetic markers (on nine genes) and slope on five outcome measures: Neutral Bright (7 associations), No Cue (4 associations), Single Bright Invalid (3 associations), Single Dim Invalid (3 associations), and Single Dim Valid (4
associations).
The Neutral Bright condition involves two equiluminant cues, one on each side of the dis-play. Which side the target appears on is at chance. Participants might get slower over the course of the task for this condition more than for neutral dim if the bright cues become harder and harder to ignore over the course of the task. This might occur, for example, if the bright cues induce fatigue. Related ideas have been explored in studies dealing with visual fatigue associated with computer use [49–52], but it is not clear how these ideas relate to our task given that the tasks used in these studies are very different from ours.
The No Cue condition entails the target appearing after a variable delay from the previous trial. This condition might be especially difficult for participants who rely on a temporal warn-ing that the target is about to appear, although (like the other conditions where validity is at chance) it also does not provide reliable location information.
The Single Bright Invalid condition presents a cue contralateral to where the target subse-quently appears. It provides a temporal cue but the spatial information is misleading. Some participants may get worse at this condition over the course of the task if fatigue makes it harder and harder to ignore invalid cues. The Single Dim Invalid condition also involves a cue appearing contralateral to where the target will subsequently appear but uses a dim cue. We anticipated that dim cues (which are still clearly visible) might be more sensitive at distinguish-ing between genotypes.
The Single Dim Valid condition involves an ipsilateral cue preceding a target. Typically in this situation, participants are faster to respond than in a Single Dim Invalid or No Cue condi-tion because attencondi-tion is already in the correct locacondi-tion for responding to the target—there is no need to ignore the cue and attend only to the target. However, fatigue could make a partici-pant respond more slowly over the course of the task. Once again, we will discuss the results by neurotransmitter.
Acetylcholine
Of the three genes associated with acetylcholine, (APOE,CHRNA4,SLC5A7, andSNAP25), two were significantly associated with Single Dim Invalid, and one each with No Cue, Neutral Bright, Single Bright Invalid, and Single Dim Valid. In the case ofSLC5A7, two different gens on the same gene were associated with the same outcome measure (Neutral Bright).
opposite direction expected based on the literature regarding physiological impact of stress [53]. Since both luminances were affected, this implies that it is the validity (i.e., contralateral cues) that is giving some participants more difficulty as the task continues.APOE’s association with RT slope on the Single Bright Invalid condition is a replication of our finding in another sample using adult participants [30].
CHRNA4had a single SNP (rs6090387) that was associated with two dim outcomes, Single Dim Invalid and Single Dim Valid. In contrast withAPOE(where both luminances were affected), here both validities are affected. This implies that it is the luminance (i.e., dim versus bright cues) that is giving some participants more difficulty as the task continues. We had anticipated that dim cues might give some participants more trouble because, while they are still clearly visible, they are not as salient and the bright cues [54]. The linear trend implies a gene-dose response very similar to a drug-dose response: the more copies of the risk allele, the stronger the effect.
SLC5A7had two SNPs (rs3806536 and rs4676169) that were associated with the Neutral Bright outcome. Rs4676169 was also associated with the No Cue condition.SLC5A7is a cho-line transporter involved in acetylchocho-line synthesis for chocho-linergic neurons [55]. As mentioned previously, this gene has been associated with attentional disorders [56–58], but the risk allele for neither SNP has been established. In our sample, heterozygotes tend to get faster over the course of the task for both SNPs and those with the AA genotype tend to either get slower (rs4676169) or show the smallest RT improvement (rs3806536). This suggests that those with the AA genotype on both SNPs are having trouble ignoring the bright cues for the Neutral Bright condition. There is no evidence that the SNPs are in linkage and so each result replicates the other result to indicate the importance of this gene to reflexive attention tasks. This contrib-utes information for other researchers that the A allele on each SNP is the risk for the particular aspect of our reflexive attention task. Note that rs4676169 was also significantly associated with the No Cue condition in which participants must respond to a target with less warning because there are no cues that precede the target. While the risk allele has not been established for rs4676169, it is interesting to note that for both the No Cue and Neutral Bright conditions het-erozygotes are performing faster as the task continues. Neither condition biases attention to one side or the other. That there is heterozygous advantage may indicate that there is an opti-mal level of acetylcholine for these conditions and that either too much or too little can have deleterious effects. This is a well-known pattern for dopamine and may apply to other neuro-transmitters as well [59–62].
SNAP25also had a SNP (rs6077690) that was significantly associated with two outcome mea-sures, Single Dim Invalid and Single Dim Valid. This gene acts in the presynaptic plasma mem-brane during neural transmission and is involved in the regulation of neurotransmitter release (including all three neurotransmitters we discuss: acetylcholine, dopamine, and serotonin).
SNAP25has been associated with ADHD and symptoms of ADHD, such as impulsivity [63–66]. The association of this SNP with the two dim conditions is similar to that ofCHRNA4and sug-gests that the relatively lower saliency might make this task progressively more difficult for some participants who are sensitive to luminance saliency in external cues. This seems to be the overall pattern in the cholinergic genes, that they are more sensitive to cue luminance such that dim cues (such as in the Single Dim Invalid) distinguish more between cholinergic genotypes.
Dopamine
DRD4is a type-four dopamine receptor and has been associated with ADHD and novelty seeking [67–73]. Our findings are consistent with those reported for rs1800955; participants with two copies of the risk allele (i.e., the CC group) either get slower over the course of the task (for the No Cue condition) or are not improving as much as the other genotype groups (for the Neutral Bright conditions). This might indicate decreased ability to ignore cues and attend only to targets. However, our findings are also consistent with heterozygous advantage which is a known characteristic of dopaminergic systems [59–62]. This suggests that too much or too little availability of dopamine can impair task performance.
IGF2had one SNP (rs734351) associated with an outcome. LikeDRD4,IGF2is associated with the No Cue condition. TheIGF2gene is an imprinted gene (i.e., expressed only from the allele inherited from the father). It is involved in growth and development generally, including cell differentiation of dopamine neurons during brain development [74]. Even though a risk allele for this SNP has not been established in the literature, those with the T allele get faster over the course of the task. Getting faster generally indicates learning. On the No Cue condition getting faster might indicate increased learning as well as the ability to attend to targets when there is no temporal warning that a target is about to appear.
SLC6A3is also known as the dopamine transporter,DAT1. TheSLC6A3gene had six associ-ations on the reflexive attention task. One of the findings (SNP rs2042449 with the No Cue condition) has an unknown risk allele. Our results are consistent with T as the risk allele (because those with the TT genotype get slower over the course of the task for this condition) or as consistent with heterozygous advantage (because heterozygotes get the fastest over the course of the task). The VNTR results are consistent with the direction of effects for sustained attention. However, the direction of effect for another SNP (rs2617605) appears to show oppo-site effects for our sustained attention task on the Neutral Bright and Single Bright Invalid con-ditions than those established for sustained attention. The two remaining associations (No Cue with rs2937639 and rs6350) are inconsistent with that established for sustained attention tasks. This is an important and useful finding because it indicates that reflexive attention might have fundamentally different associations than sustained attention.
As was mentioned above,SNAP25is associated with all three neurotransmitters we discuss.
SNAP25was associated with Single Dim Invalid and Single Dim Valid conditions. As such, it shares association with one other dopaminergic gene.SLC6A3has one SNP (rs6350) associated with Single Dim Valid.
Overall the pattern for dopamine is similar to that for acetylcholine, showing sensitivity to luminance. However, for dopamine it is bright cues that differentiate more between genotypes. It is notable that there were five significant associations with bright cues and only one signifi-cant association with dim cues for these genetic markers.
Serotonin
reflexive attention task in childhood suggests that there may be a somewhat inadequate seroto-nergic system in some children with attentional deficits.
HTR4had one SNP (rs1862345) that was significantly associated with slope for the Single Bright Invalid condition.HTR4codes for a serotonin receptor. Reduced receptor number might decrease neural transmission even if there is otherwise enough serotonin available. How-ever, somehow too many receptors is also nonideal. Perhaps too many receptors interfere with other actions necessary for neural transmission. Heterozygous disadvantage can happen when there is an optimal amount of a gene product (receptors) for performance and too much or too little can interfere with a particular outcome. One neurotransmitter with optimal level effects is dopamine [59–62], but the effect may occur for other gene products as well.
As was mentioned above,SNAP25is associated with all three neurotransmitters we discuss.
SNAP25was associated with Single Dim Valid conditions as wereCHRNA4in the acetylcho-line system,SLC6A3in the dopamine system, andHTR4in the serotonin system. SNAP25 was also associated with Single Dim Invalid. This seems to indicate that dim cue conditions are especially sensitive at detecting issues with neurotransmitter release.
Conclusion
Overall our results show that Neutral Bright cues and No Cue conditions (conditions which do not bias attention to one side or the other) distinguish well by genotype for genes associated with all three neurotransmitters. Conditions with dim cues also seem sensitive to genetic differ-ences (also for all three neurotransmitters). Other patterns in the data suggest that there are dif-ferent risk alleles for reflexive attention tasks than for sustained attention tasks and that there are optimal levels of availability of neurotransmitters (evidenced by heterozygous advantage). The genes that had significant markers on them wereAPOE(1 marker),BDNF(2 markers),
CHRNA4(1 marker),DRD4(1 marker),IGF2(1 marker),SLC5A7(2 markers), SLC6A3 (5 markers), andSNAP25(1 marker). The genes are associated with all three neurotransmitters we tested (acetylcholine, dopamine, and serotonin). All these neurotransmitters have been established to have association with sustained attention.
As with all genetic association studies, our findings will need replication. This is especially true because genetic association studies with reflexive attention tasks are rare. However, we have shown partial replication and extension of previous results using sustained attention to reflexive attention tasks. In some cased the direction of effects were the same as for disorders commonly associated with sustained attention deficits, but more often the results were in the opposite direction. This indicates the additional usefulness of reflexive attention tasks in study-ing attentional deficits. Studies should not be limited to sustained attention tasks when measur-ing attention. We have also contributed by makmeasur-ing associations with SNPs for which the direction of effect was not known even though they are on genes associated with attention. This information is useful and warrants replication attempts. Ultimately, the present results add further evidence that genetics do contribute to slope variability in reflexive attention tasks. Further research into the genetics of attention has the potential to improve intervention for those with attentional deficits by targeting for intervention the specific types of tasks that give them trouble.
Acknowledgments
Author Contributions
Conceived and designed the experiments: RAL. Performed the experiments: RAL. Analyzed the data: JKW RAL. Wrote the paper: RAL JKW.
Reference
1. Doran S, Van Dongen H, Dinges DF. Sustained attention performance during sleep deprivation: evi-dence of state instability. Arch Ital Biol. 2001; 139(3):253–67. PMID:11330205
2. Conners CK. Continuous Performance Test Computer Program (Version 2.0). North Tonawanda, NY: Multi-Health Systems; 1992.
3. Robertson IH, Manly T, Andrade J, Baddeley BT, Yiend J. 'Oops!': Performance correlates of everyday attentional failures in traumatic brain injured and normal subjects. Neuropsychologia. 1997; 35:747–58. PMID:9204482
4. Posner MI. Orienting of attention. Q J Exp Psychol. 1980; 32:3–25. PMID:7367577 5. Posner MI. Chronometric Explorations of Mind. Hillsdale, NJ: Lawrence Erlbaum; 1978.
6. Wang CA, Boehnke SE, Itti L, Munoz DP. Transient pupil response is modulated by contrast-based saliency. The Journal of Neuroscience. 2014; 34(2):408–17. PMID:24403141. doi:10.1523/ JNEUROSCI.3550-13.2014
7. Witte EA, Marrocco RT. Visual orienting and alerting in Rhesus monkeys: Comparison with humans. Behav Brain Res. 1996; 82:103–12. PMID:9021075
8. Castellanos FX, Tannock R. Neuroscience of attention-deficit/hyperactivity disorder: the search for endophenotypes. Nat Rev Neurosci. 2002; 3(8):617–28. doi:10.1038/nrn896PMID:12154363. 9. Poitou T, Pouget P. Variability, noise and predictability in motor response times: Adaptation or
misadap-tation? In: Norvilitis JM, editor. Contemporary Trends in ADHD Research. Rijeka, Croatia: InTech; 2012. p. 15–28.
10. Vaurio RG, Simmonds DJ, Mostofsky SH. Increased intra-individual reaction time variability in atten-tion-deficit/hyperactivity disorder across response inhibition tasks with different cognitive demands. Neuropsychologia. 2009; 47(12):2389–96. doi:10.1016/j.neuropsychologia.2009.01.022PMID: 19552927.
11. Bidwell LC, Willcutt EG, McQueen MB, DeFries JC, Olson RK, Smith SD, et al. A family based associa-tion study of DRD4, DAT1, and 5HTT and continuous traits of attenassocia-tion-deficit hyperactivity disorder. Behav Genet. 2011; 41(1):165–74. PMID:21207241; PubMed Central PMCID: PMC3674022. doi:10. 1007/s10519-010-9437-y
12. Lijffijt M, Kenemans JL, ter Wal A, Quik EH, Kemner C, Westenberg H, et al. Dose-related effect of methylphenidate on stopping and changing in children with attention-deficit/hyperactivity disorder. Eur Psychiatry. 2006; 21(8):544–7. PMID:15994064.
13. Stefanis NC, van Os J, Avramopoulos D, Smyrnis N, Evdokimidis I, Stefanis CN. Effect of COMT Val158Met polymorphism on the Continuous Performance Test, Identical Pairs Version: Tuning rather than improving performance. Am J Psychiatry. 2005; 162:1752–4. PMID:16135641
14. Gottesman II, Gould TD. The endophenotype concept in psychiatry: etymology and strategic intentions. American Journal of Pscyhiatry. 2003; 160(4):636–45.
15. Thakur GA, Sengupta SM, Grizenko N, Choudhry Z, Joober R. Comprehensive phenotype/genotype analyses of the norepinephrine transporter gene (SLC6A2) in ADHD: Relation to maternal smoking dur-ing pregnancy. PLoS One. 2012; 7(11):e49616. doi:10.1371/journal.pone.0049616PMID:23185385; PubMed Central PMCID: PMC3502190.
16. Barr RS, Culhane MA, Jubelt LE, Mufti RS, Dyer MA, Weiss AP, et al. The effects of transdermal nico-tine on cognition in nonsmokers with schizophrenia and nonpsychiatric controls. Neuropsychopharma-cology. 2008; 33(3):480–90. PMID:17443126.
17. Whitacker-Azmitia PM, Druse M, Walker P, Lauder JM. Serotonin as a developmental signal. Behav Brain Res. 1996; 73:19–29. PMID:8788472
18. Forssman L, Peltola MJ, Yrttiaho S, Puura K, Mononen N, Lehtimaki T, et al. Regulatory variant of the TPH2 gene and early life stress are associated with heightened attention to social signals of fear in infants. J Child Psychol Psychiatry. 2014; 55(7):793–801. doi:10.1111/jcpp.12181PMID:24304270. 19. Gizer IR, Ficks C, Waldman ID. Candidate gene studies of ADHD: a meta-analytic review. Hum Genet.
2009; 126(1):51–90. doi:10.1007/s00439-009-0694-xPMID:19506906.
21. Oades RD, Lasky-Su J, Christiansen H, Faraone SV, Sonuga-Barke EJ, Banaschewski T, et al. The influence of serotonin- and other genes on impulsive behavioral aggression and cognitive impulsivity in children with attention-deficit/hyperactivity disorder (ADHD): Findings from a family-based association test (FBAT) analysis. Behavioral and Brain Functions. 2008; 4:48. PMID:18937842; PubMed Central PMCID: PMC2577091. doi:10.1186/1744-9081-4-48
22. Epstein JN, Langberg JM, Rosen PJ, Graham A, Narad ME, Antonini TN, et al. Evidence for higher reaction time variability for children with ADHD on a range of cognitive tasks including reward and event rate manipulations. Neuropsychology. 2011; 25(4):427–41. PMID:21463041; PubMed Central PMCID: PMC3522094. doi:10.1037/a0022155
23. Karalunas SL, Huang-Pollock CL, Nigg JT. Is reaction time variability in ADHD mainly at low frequen-cies? J Child Psychol Psychiatry. 2013; 54(5):536–44. PMID:23278286; PubMed Central PMCID: PMC3620969. doi:10.1111/jcpp.12028
24. Nandam LS, Hester R, Wagner J, Cummins TD, Garner K, Dean AJ, et al. Methylphenidate but not ato-moxetine or citalopram modulates inhibitory control and response time variability. Biol Psychiatry. 2011; 69(9):902–4. doi:10.1016/j.biopsych.2010.11.014PMID:21193172.
25. Dannemiller JL. Evidence against a maximum response model of exogenous visual orienting during early infancy and support for a dimensional switching model. Developmental Science,. 2005; 8:567– 82. PMID:16246248
26. Cotter RB, Burke JD, Stouthamer-Loeber M, Loeber R. Contacting participants for follow-up: How much effort is required to retain participants in longitudinal studies? Eval Program Plann. 2005; 28 (1):15–21.
27. Ribisl KM, Walton MA, Mowbray CT, Luke DA, Davidson WS, Bootsmiller BJ. Minimizing participant attrition in panel studies through the use of effective retention and tracking strategis: Review and rec-ommendations. Evaluations and Program Planning. 1996; 19:1–25.
28. Tebes JK, Snow DL, Arthur MW. Panel attrition and external validity in the short-term follow-up study of adolescent substance abuse. Evaluation Review. 1992; 16(2):151–70.
29. Thomas DC, Witte JS. Point: Population stratification: A problem for case-control studies of candidate-gene associations? Cancer Epidemiol Biomarkers Prev. 2002; 11:505–12. PMID:12050090 30. Lundwall RA, Guo D-C, Dannemiller JL. Exogenous visual orienting is associated with specific
neuro-transmitter genetic markers: A population-based genetic association study. PLoS One. 2012; 7(2): e30731. doi:10.1371/journal.pone.0030731PMID:22348020
31. Melendres MC, Lutz JM, Rubin ED, Marcus CL. Daytime sleepiness and hyperactivity in children with suspected sleep-disordered breathing. Pediatrics. 2004; 114(3):768–75. doi:10.1542/peds.2004-0730 PMID:15342852.
32. Preacher KJ, Rucker DD, MacCallum RC, Nicewander WA. Use of the extreme groups approach: A critical reexamination and new recommendations. Psychol Methods. 2005; 10:178–92. PMID: 15998176
33. Kebir O, Tabbane K, Sengupta S, Joober R. Candidate genes and neuropsychological phenotypes in children with ADHD: Review of association studies. J Psychiatry Neurosci. 2009; 34:88–101. PMID: 19270759
34. Sagvolden T, Johansen EB, Aase H, Russell VA. A dynamic developmental theory of attention-deficit/ hyperactivity disorder (ADHD) predominantly hyperactive/impulsive and combined subtypes. Behav Brain Sci. 2005; 28:397–419. PMID:16209748
35. Huang X, Xu Y, Li Q, Liu P, Yang Y, Zhang F, et al. Nicotinic acetylcholine receptor alpha-4 subunit gene variation associated with attention deficit hyperactivity disorder. Tsinghua Science and Technol-ogy. 2009; 14:534–40.
36. Belbin O, Dunn JL, Ling Y, Morgan L, Chappell S, Beaumont H, et al. Regulatory region single nucleo-tide polymorphisms of the apolipoprotein E gene and the rate of cognitive decline in Alzheimer's dis-ease. Hum Mol Genet. 2007; 16(18):2199–208. doi:10.1093/hmg/ddm171PMID:17613540.
37. Friedel S, Saar K, Sauer S, Dempfle A, Walitza S, Renner T, et al. Association and linkage of allelic var-iants of the dopamine transporter gene in ADHD. Mol Psychiatry. 2007; 12(10):923–33. doi:10.1038/sj. mp.4001986PMID:17579611.
38. Kim JW, Biederman J, Arbeitman L, Fagerness J, Doyle AE, Petty C, et al. Investigation of variation in SNAP-25 and ADHD and relationship to co-morbid major depressive disorder. Am J Med Genet B Neu-ropsychiatr Genet. 2007; 144B(6):781–90. doi:10.1002/ajmg.b.30522PMID:17455213.
40. van de Giessen EM, de Win MM, Tanck MW, van den Brink W, Baas F, Booij J. Striatal dopamine trans-porter availability associated with polymorphisms in the dopamine transtrans-porter gene SLC6A3. J Nucl Med. 2009; 50(1):45–52. doi:10.2967/jnumed.108.053652PMID:19091889
41. Krishnan V, Han M-H, Graham DL, Berton O, Renthal W, Russo S, et al. Molecular adaptations underly-ing susceptibility and resistance to social defeat in brain reward regions. Cell. 2007; 131:391–404. PMID:17956738
42. Egan MF, Kojima M, Callicott JH, Goldberg TE, Kolachana BS, Bertolino A, et al. The BDNF val66met polymorphism affects activity-dependent secretion of BDNF and human memory and hippocampal function. Cell. 2003; 112:257–69. PMID:12553913
43. Söderqvist S, Matsson H, Peyrard-Janvid M, Kere J, Klingberg T. Polymorphisms in the Dopamine Receptor 2 Gene Region Influence Improvements during Working Memory Training in Children and Adolescents. J Cogn Neurosci. 2013:1–9. doi:10.1162/jocn_a_00478PMID:24047384
44. Bellgrove MA, Mattingley JB. Molecular genetics of attention. Ann N Y Acad Sci. 2008; 1129:200–12. PMID:18591481. doi:10.1196/annals.1417.013
45. Evans S, Dowell NG, Tabet N, Tofts PS, King SL, Rusted JM. Cognitive and neural signatures of the APOE E4 allele in mid-aged adults. Neurobiol Aging. 2014; 35(7):1615–23. doi:10.1016/j.
neurobiolaging.2014.01.145PMID:24582638.
46. Faraone SV, Mick E. Molecular genetics of attention deficit hyperactivity disorder. The Psychiatric Clin-ics of North America. 2010; 33(1):159–80. doi:10.1016/j.psc.2009.12.004PMID:20159345; PubMed Central PMCID: PMC2847260.
47. Greenwood PM, Sunderland T, Friz JL, Parasuraman R. Genetics and visual attention: Selective defi-cits in healthy adult carriers of the epsilon 4 allele of the apolipoprotein E gene. Proc Natl Acad Sci U S A. 2000; 97:11661–6. PMID:11027364
48. Newman EL, Gupta K, Climer JR, Monaghan CK, Hasselmo ME. Cholinergic modulation of cognitive processing: insights drawn from computational models. Front Behav Neurosci. 2012; 6:24. doi:10. 3389/fnbeh.2012.00024PMID:22707936; PubMed Central PMCID: PMC3374475.
49. Chu CA, Rosenfield M, Portello JK. Blink patterns: Reading from a computer screen versus hard copy. Optom Vis Sci. 2014; 91:297–302. doi:10.1097/OPX.0000000000000157PMID:24413278
50. Duffy VG, Chan AHS. Effects of virtual lighting on visual performance and eye fatigue. Human Factors and Ergonomics in Manufacturing. 2002; 12(2):193–209.
51. Stern JA. Blink rate: A possible measure of fatigue. Human Factors and Ergonomics in Manufacturing. 1994; 36:285–97.
52. Wolska A,Świtula M. Luminance of the surround and visual fatigue of VDT operators. International Jour-nal of OccupatioJour-nal Safety and Ergonomics. 1999; 5:553–80. PMID:10657927
53. Kring SI, Brummett BH, Barefoot J, Garrett ME, Ashley-Koch AE, Boyle SH, et al. Impact of psychologi-cal stress on the associations between apolipoprotein E variants and metabolic traits: Findings in an American sample of caregivers and controls. Psychosom Med. 2010; 72(5):427–33. PMID:20467002; PubMed Central PMCID: PMC3625667. doi:10.1097/PSY.0b013e3181de30ad
54. Carrasco M. Visual attention: The past 25 years. Vision Res. 2011; 51(13):1484–525. doi:10.1016/j. visres.2011.04.012.2011-16191-007PMID:21549742
55. Apparsundaram S, Ferguson SM, George AL Jr., Blakely RD. Molecular cloning of a human, hemicholi-nium-3-sensitive choline transporter. Biochem Biophys Res Commun. 2000; 276(3):862–7. PMID: 11027560.
56. Dong Y, Dani JA, Blakely RD. Choline transporter hemizygosity results in diminished basal extracellular dopamine levels in nucleus accumbens and blunts dopamine elevations following cocaine or nicotine. Biochem Pharmacol. 2013; 86(8):1084–8. PMID:23939187. doi:10.1016/j.bcp.2013.07.019
57. English BA, Hahn MK, Gizer IR, Mazei-Robison M, Steele A, Kurnik DM, et al. Choline transporter gene variation is associated with attention-deficit hyperactivity disorder. J Neurodev Disord. 2009; 1(4):252– 63. PMID:21547719; PubMed Central PMCID: PMC3164006. doi:10.1007/s11689-009-9033-8 58. Kristofikova Z, Ripova D, Hegnerova K, Sirova J, Homola J. Protein tau-mediated effects on rat
hippo-campal choline transporters CHT1 and tau-amyloid beta interactions. Neurochem Res. 2013; 38 (9):1949–59. PMID:23824558. doi:10.1007/s11064-013-1101-5
59. Cools R D'Esposito M. Inverted-U-shaped dopamine actions on human working memory and cognitive control. Biol Psychiatry. 2011; 69(12):e113–25. PMID:21531388; PubMed Central PMCID:
PMC3111448. doi:10.1016/j.biopsych.2011.03.028
61. Kroener S, Chandler LJ, Phillips PE, Seamans JK. Dopamine modulates persistent synaptic activity and enhances the signal-to-noise ratio in the prefrontal cortex. PLoS One. 2009; 4(8):e6507. doi:10. 1371/journal.pone.0006507PMID:19654866; PubMed Central PMCID: PMC2715878.
62. Monte-Silva K, Kuo MF, Thirugnanasambandam N, Liebetanz D, Paulus W, Nitsche MA. Dose-depen-dent inverted U-shaped effect of dopamine (D2-like) receptor activation on focal and nonfocal plasticity in humans. The Journal of Neuroscience. 2009; 29(19):6124–31. PMID:19439590. doi:10.1523/ JNEUROSCI.0728-09.2009
63. Feng Y, Crosbie J, Wigg K, Pathare T, Ickowicz A, Schachar R, et al. The SNAP25 gene as a suscepti-bility gene contributing to attention-deficit hyperactivity disorder. Mol Psychiatry. 2005; 10(11):998– 1005, 973. PMID:16088329.
64. Forero DA, Arboleda GH, Vasquez R, Arboleda H. Candidate genes involved in neural plasticity and the risk for attention-deficit hyperactivity disorder: A meta-analysis of 8 common variants. J Psychiatry Neurosci. 2009; 34:361–6. PMID:19721846
65. Hawi Z, Matthews N, Wagner J, Wallace RH, Butler TJ, Vance A, et al. DNA variation in the SNAP25 gene confers risk to ADHD and is associated with reduced expression in prefrontal cortex. PLoS One. 2013; 8(4):e60274. doi:10.1371/journal.pone.0060274PMID:23593184; PubMed Central PMCID: PMC3625226.
66. Nemeth N, Kovacs-Nagy R, Szekely A, Sasvari-Szekely M, Ronai Z. Association of impulsivity and polymorphic microRNA-641 target sites in the SNAP-25 gene. PLoS One. 2013; 8(12):e84207. doi:10. 1371/journal.pone.0084207PMID:24391914; PubMed Central PMCID: PMC3877256.
67. Albrecht B, Brandeis D, von Sandersleben HU, Valko L, Heinrich H, Xu X, et al. Genetics of preparation and response control in ADHD: The role of DRD4 and DAT1. Journal of Child Psychology and Psychia-try, and Allied Disciplines. 2014; 55:914–23. PMID:24521003. doi:10.1111/jcpp.12212
68. Bellgrove MA, Hawi Z, Lowe N, Kirley A, Robertson IH, Gill M. DRD4 gene variants and sustained atten-tion in attenatten-tion deficit hyperactivity disorder (ADHD): Effects of associated alleles at the VNTR and -521 SNP. American Journal of Medical Genetics Part B, Neuropsychiatric Genetics 2005; 136B (1):81–6. PMID:15909295.
69. Epstein JN, Novick O, Umansky R, Priel B, Osher Y, Blaine D, et al. Dopamine D4 receptor (DRD4) exon III polymorphism associated with the human personality trait of novelty seeking. Nat Genet. 1996; 12:78–80. PMID:8528256
70. Lasky-Su J, Lange C, Biederman J, Tsuang M, Doyle AE, Smoller JW, et al. Family-based association analysis of a statistically derived quantitative traits for ADHD reveal an association in DRD4 with inat-tentive symptoms in ADHD individuals. American Journal of Medical Genetics Part B, Neuropsychiatric Genetics. 2008; 147B(1):100–6. PMID:17579349.
71. Manor I, Tyano S, Eisenberg J, Bachner-Melman R, Kotler M, Ebstein RP. The short DRD4 repeats confer risk to attention deficit hyperactivity disorder in a family-based design and impair performance on a continuous performance test (TOVA). Mol Psychiatry. 2002; 7:790–4. PMID:12192625 72. MunafòMR, Yalcin B, Willis-Owen SA, Flint J. Association of the dopamine D4 receptor (DRD4) gene
and approach-related personality traits: Meta-analysis and new data. Biol Psychiatry. 2008; 63(2):197– 206. PMID:17574217.
73. Thomson CJ, Hanna CW, Carlson SR, Rupert JL. The -521 C/T variant in the dopamine-4-receptor gene (DRD4) is associated with skiing and snowboarding behavior. Scand J Med Sci Sports. 2013; 23 (2):e108–13. PMID:23252368. doi:10.1111/sms.12031