Scientific Papers Series Management , Economic Engineering in Agriculture and Rural Development Vol. 13 , Issue 1, 2013
PRINT ISSN 2284-7995 , E-ISSN 2285-3952
223
INFLUENCE OF ECONOMIC GROWTH ON THE SUSTAINABLE
DEVELOPMENT OF ROMANIA 2007-2012
AlinaăM RCUT ,ăLiviuăM RCUT ,ăCarmenăANGELESCU
University of Agricultural Sciences and Veterinary Medicine, Bucharest, Romania, E- mail: [email protected], [email protected], [email protected]
Corresponding author: [email protected]
Abstract
This paper intends to analyse the correlation between the level of economic growth of a country and its rural development. The phrase sustainable development combines the economic growth and the preservation and improvement of environmental and human health, preservation of social justice and assurance of democratic environment in social life. Therefore, the sustainable economic growth provides for the meeting of current consumption requirements without compromising or prejudicing those of the future generations. By adding the requirements regarding environmental protection and preservation of natural resources to economic growth we may speak of a proper sustainable development.
Key words: economic growth,sustainable development
INTRODUCTION
The concept of sustainable economic growth has appeared as a result of establishing the irreversible diminishing of the capacity of economic resources, of any kind, as a result of human activity. Academic studies and more applied analyses showed that the old economic optimization criteria are inconsistent with the natural dynamics of basic resources. This fundamental observation in conjunction with the occurrence of global problems led to the necessity of a long or very long term approach of the manner, degree, pace and structure in which the economic resources of any kind are created, consumed and recycled.
MATERIALS AND METHODS
In order to meet the need of information to be used for presenting the subject to be discussed, a bibliographical research and a statistical research have been performed, through which data for the conclusions regarding the performed study were collected, processed and analysed. Statistical tables have been used by which data were presented in a tabular way. This is a method which allows the description of indicators on which the
performed analysis is based, and the establishing of the existing connections between its component elements. Graphical representations have been used to emphasize the extent and/or variation of data subject to the statistical research in view of showing their evolution in time.
RESULTS AND DISCUSSIONS
The best known definition of the sustainable development is the one from the Declaration on Environment and Development, given within the World Summit held in Rio de Janeiro in 1992 which defines this concept as
"the development which answers to the current needs without prejudicing the capability of next generations to meet their
own needs. [...] In order to meet the
desideratum of sustainable development, the environmental protection will be an integral part of the development process and may not
be approached independently of
it."(Declaration on Environment and
Development, Rio de Janeiro, 1992).
Scientific Papers Series Management , Economic Engineering in Agriculture and Rural Development Vol. 13 , Issue 1, 2013
PRINT ISSN 2284-7995 , E-ISSN 2285-3952
224
preparing of several legal instruments: Rio
Declaration on Environment and
Development, Agenda 21 (a plan for supporting the sustainable development), United Nations Framework Convention on Climate Change, Convention on Biological Diversity, Statement of Principle on Forrest Management, and United Nations Convention to Combat Desertification in Those Countries
Experiencing Serious Drought and/or
Desertification, by which, a sustainable development is to be provided for.
In 2002, during the Johannesburg Word
Summit on Sustainable Development, the
progress made by countries towards a sustainable development was analysed and the participants' commitment to promote the principles of sustainable development were renewed.
In 1997, the sustainable development was included in the Maastricht Treaty, thus becoming an objective of the European Union. In 2001, within the Goteborg
Summit, the European Union Sustainable
Development Strategy was adopted, which
was renewed in 2006 by the Sustainable Development Strategy for an Enlarged
European Union which was aimed to change
the behaviour within the European society by involving the policymakers, both public and private, and the citizens in preparing, implementing and monitoring the sustainable development objectives.
The following 7 priority axes of the European Union Sustainable Development Strategy have been reviewed: Climate change and energy, Sustainable transport, Conservation and management of natural resources, Sustainable consumption and production, Public health, Social inclusion, demography and migration, Global poverty and sustainable development challenges. Through the Sustainable Development Strategy for an Enlarged European Union, the implementing, monitoring and follow-up procedures have been established. The undertakings have been monitored through reports prepared one in two years. Romania, as a member state of the European Union, is subject to the same sustainable development principles.
In order to measure the sustainable development at national level, there is a set of indicators, established by the Statistical Office of the European Community (Eurostat) together with the National Statistical Institute, categorized on three levels: 1. Main indicators; 2. Indicators usable to monitor and review the sustainable development programs; 3. Analytical indicators, which also includes economic, social and environmental indicators.
In order to measure the sustainable development in Romania, there are 85 indicators, classified according to the European system. In turn, indicators are grouped on 10 subjects: economic development, poverty and social exclusion, ageing society, public health, climate change and energy, production and consumption models, ecological efficiency, management of natural resources, good quality governance and global partnership. Within the category of indicators used to assess the sustainable development, the indicators for material flows are also included, indicators which put pressure on the environment because their action is related to the diminishing of renewable resources and the ecological damage. The material flows may be analysed through the domestic material extraction, direct and total material inputs, domestic and total material consumption, direct and total material outputs, material productivity, material efficiency, dependency on domestic natural resources, material imports etc.
Two of the main sustainable development assessment indicators are: GDP/capita and population pushed close to the poverty line.
Table 1 – Evolution of GDP/capita - 2007-2012 % change compared with the previous year
Indicator 2007 2008 2009 2010 2011 Q1 2012 2012 Q2 GDP 6.3 7.3 -6.6 -1.6 2.5 0.3 1.1
Domestic demand, out of which:
14.2 7.3 -12.0 -1.5 3.1 1.2 1.3
Private consumption 11.9 9.0 -10.1 -0.4 1.3 0.5 2.2 Governmental
consumption
-0.1 7.2 3.1 -4.4 -3.5 -1.2 -2.4
Gross fixed capital
formation 30.3 15.6 -28.1 -2.1 6.3 12.2 15.5 Export of goods and
services 7.8 8.3 -6.4 14.0 9.9 -2.2 -0.5 Import of goods and
services 27.3 7.9 -20.5 11.9 10.5 -0.3 0.2
Scientific Papers Series Management , Economic Engineering in Agriculture and Rural Development Vol. 13 , Issue 1, 2013
PRINT ISSN 2284-7995 , E-ISSN 2285-3952
225 Fig.1 – Evolution of GDP in the period 2007-2012
Analysing the % change of GDP/capita compared with the previous period, an increase is established with an annual average pace of 6.8 % for 2007-2008. In 2009, a decrease of the analysed indicator took place, with -6.6 %. The decrease continued in 2010, when a decrease with 1.6 % of GDP/capita took place, compared with the previous year, followed by an increase with 2.5 % in 2011. For the first two quarters of 2012, the increases were of 0.3 % and 1.1 % respectively. If, during the period 2007-2008, a real economic convergence process of the domestic economy towards the average level of European Union economy took place, during the period 2009-2010, this process was interrupted, due to the economic and financial crisis and the diminishing of international financing which influenced the domestic economy evolution. The false exit from the recession process in 2011 was caused by the agricultural production registered in that year. If we analyse the added value brought by several sectors of the domestic economy in the obtaining of GDP, it is established that in 2011 agriculture has contributed to the recovery of the analysed indicator. This was not the case in 2009 and 2010 when the climate change had negative influences. During the period 2009-2011, the annual average growth was of 0.3 %.
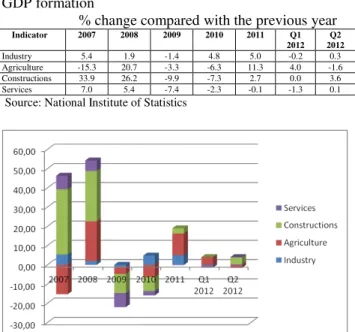
Industry had a positive trend in 2007-2008, followed by a decrease in 2009 and a recovery in the next period.
The other two sectors, constructions and services, have registered decreases in the analysed period due to the fact that the economic recession led to a decrease of real
estate investments, and to the diminishing of public investments in infrastructure.
Table 2 – Contribution of several economy sectors to GDP formation
% change compared with the previous year Indicator 2007 2008 2009 2010 2011 Q1
2012 Q2 2012
Industry 5.4 1.9 -1.4 4.8 5.0 -0.2 0.3
Agriculture -15.3 20.7 -3.3 -6.3 11.3 4.0 -1.6
Constructions 33.9 26.2 -9.9 -7.3 2.7 0.0 3.6
Services 7.0 5.4 -7.4 -2.3 -0.1 -1.3 0.1
Source: National Institute of Statistics
Fig.2 – Contribution of several economy sectors to GDP formation in the period 2007-2012
Data registered by the National Institute of Statistics and Eurostat show that, starting with 2011, Romania is the poorest country of the European Union. In 2010, the weight of population pushed close to the poverty line was of 41.4 %, compared to 41.6 % registered in Bulgaria, when in EU, this indicator is at a level of 23.4 %. This issue is in contradiction with the natural resources endowment of our country.
Table 3 – Population at risk of poverty
% of total population Indicator 2007 2008 2009 2010 2011 Romania 45.9 44.2 43.1 41.4 40.3
North-West 38.3 33.7 35.2 30.8 34.3 Centre 37.6 37.2 33.2 30.3 28.5 North-East 55.1 54.5 52.9 51.0 51.2 South-East 51.0 48.6 42.4 51.8 50.0 South-Muntenia 50.3 45.6 48.1 42.7 43.1 Bucharest-Ilfov 35.1 36.2 41.9 34.4 28.4 South-West Oltenia 55.4 56.5 52.9 48.0 44.8 West 34.2 33.4 30.1 35.5 33.1 Source: Eurostat
By analysing the weight of total population at risk of poverty by regions, it is established that in North-West Region, the population at poverty risk is decreasing, being under the national average.
Scientific Papers Series Management , Economic Engineering in Agriculture and Rural Development Vol. 13 , Issue 1, 2013
PRINT ISSN 2284-7995 , E-ISSN 2285-3952
226
weight is registered in the North-East Region, followed by the South-West Oltenia Region and South-East Region.
The poor economic development of Romania is also shown by the indicators related to the average life expectancy at birth. In 2010, in Romania, the average life expectancy from birth is of approximately 70 years for men and 77.6 years for women, while the average values of European Union is of 76.7 years for men and 82.6 for women.
CONCLUSIONS
Achieving a sustainable economy lies in achieving an economic growth in the context of diminished material consumption.
The increased demand of goods and services drives the sustainable economic development in the context of meeting the eco-efficiency system requirements.
For the eco-efficiency to be obtained, it is necessary to promote market instruments which reflect the real cost of using natural resources and the impact on society.
At the level of our country, it is established that the recovery of the economic growth left its mark on the sustainable development. Human development may not be obtained without material and financial resources, the economic growth being the conditio sine qua non for welfare and social cohesion.
REFERENCES
[1] * * * Agenda 21
[2] * * * Earth Charter, Hanover, 2000
[3] * * * European Union Sustainable Development Strategy
[4] * * * Sustainable Development Strategy for an Enlarged European Union, 2006
[5] * * * INSSE (National Institute of Statistics) [6] * * * EUROSTAT