The Sustainable Development Model
Cristina BURGHELEA “Hyperion” University, Bucharest [email protected]
Abstract. Sustainable development concept approaches quality of life in complexity, as economic, social and environmental issues, promoting the idea of balance between economic development, social equity, efficient utilization and environment conservation.
An essential condition for achieving sustainable development is the right mix of macroeconomic policies coherent, consistent with resources to ensure sustainability of materials and energy used for growth.
Keywords: sustainable development; economic models; sustainable growth.
1. Introduction
Of all sub-models within the European Union, Nordic sub-model proved most efficient in achieving the objectives agreed in the Lisbon Strategy, since it generated the macroeconomic efficiency and social equity.
Northern sub-model analyzed refers to Denmark, Sweden, Finland and the Netherlands being characterized by a high degree of redistribution through social inclusion, high welfare, social dialogue and a high degree of cooperation between social partners and govern. Nordic economies are some of the most competitive European economies.
The second sub-model is the model of Central and Eastern known chatting-up. This sub-model includes Czech Republic, Slovakia, Slovenia, Hungary, Estonia, Lithuania, Latvia, Romania and Bulgaria. All these economies have gone through the process of transition to a market economy; however there are significant differences in terms of national welfare systems organization. Sub-model analysis suggests a whole regulated labor markets, an institution of social dialogue and a little low developed social security. Employment rates, means the most significant growth in Bulgaria, where employment levels approached the continental sub-model.
Scandinavian model is often called the model for other countries in Europe. The fact that the Nordic welfare has become a common thing is not a coincidence.
Relatively poor in natural deposits, Denmark successfully exploit another resource, the human. This is one of the reasons why international giants invest in these countries. Economic growth in 2009 was 1.7%. GDP per capita reached $36,700 in 2009, the IMF said. Norwegian economic growth reached 2.2% in 2010. GDP per capita was U.S. $52,238, thus occupying the fourth place among the richest countries in the world (Socol et al., 2011, pp. 25-44).
Sweden had a growth of 4.5% in 2010; GDP per capita has reached over 37,000 dollars. The state is rich in natural resources-timber, minerals iron and huge hydropower potential. Northern peopled managed to direct the export industry. State's major trading partners are European countries that have dramatically reduced investment funds. But even so, Sweden has exported over one million cubic timbers in the first ten months of 2009.
fragility of banking systems and unemployment rates has caused a huge anemic advance even within the Euro area. The inhabitants of the Scandinavian countries have escaped such problems; their living standards did not suffer major changes.
2. The indicators on employment rates in northern sub-model
Having a job does not always protect people from poverty. In 2006, 8% of employed EU citizens (over 18 years) are living below the poverty line, and thus difficult to get actively involved in society. Poverty employment is associated with low wages, low skills, insecure employment and often involves involuntary part-time employment. It is also the type of household they live in employment and economic status of other household members. In households with children, for example, the model of a single employee who maintains the family is no longer sufficient to prevent poverty. Next we analyze the situation of the Nordic countries on the employment rate among people in the age group 20-64 years.
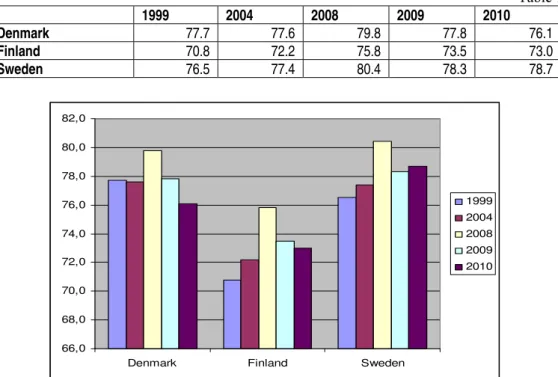
Table 1
1999 2004 2008 2009 2010
Denmark 77.7 77.6 79.8 77.8 76.1
Finland 70.8 72.2 75.8 73.5 73.0
Sweden 76.5 77.4 80.4 78.3 78.7
66,0 68,0 70,0 72,0 74,0 76,0 78,0 80,0 82,0
Denmark Finland Sweden
1999 2004 2008
2009 2010
Source: www.eurostat.ro, Headline Indicators/Europe 2020.
The Nordic countries are characterized by high employment; Denmark recorded the highest rates (76.1%) and Sweden (78.7%). As a result of financial and economic crisis, the employment rate for the Nordic countries has been affected, situation which was remarked in 2009 compared with same period last year. But these countries were not so severely affected than other Member States, the maximum decrease being of 2.3 percentage points for Finland.
The share of health workers in the total number of employees ranks the Nordic countries on the first three places in the European Union as follows: Denmark with percentage 18.7%, Finland (17.3%) and Sweden (17.0%), placing in the opposite side countries like Estonia (5.6%), Bulgaria (5.1%) and Romania (6.0%)(4).
Nordic model is distinguished by the importance of their active measures to combat unemployment, high levels of expenditure for social welfare; it is a generalized system, has an intensive intervention on the work market and powerful trade unions that ensures a consistent level of wages.
3. Indicators on employment rates in Central-Eastern Europe
World economic crisis has seriously affected the labor market in the European Union, leaving behind more than 23 million unemployed who have little hope to find a job in the coming months. Only in the last year and a half it was lost 4.3 million jobs, representing 1.9 percent of total employment across the EU. In this context, the unemployment rate is expected to reach an average of 10 percent and remain at this level at least until the end of 2011.
Table 2
1999 2004 2008 2009 2010
Romania 69.4 63.5 64.4 63.5 63.3
Bulgaria 55.3 60.1 70.7 68.8 65.4
0 10 20 30 40 50 60 70 80
Romania Bulgaria Hungary 1999
2004
2008 2009
2010
Source: www.eurostat.ro, Headline Indicators/Europe 2020.
Figure 2.Employment rate in Central-Eastern sub-model
Thus, for the countries analyzed in the graph we can remark that the highest employment rate in Bulgaria was in 2008, i.e. 70.7 percentage points before crisis beginning, followed in 2009 by a 1.9% decrease, not a collapse. But Bulgaria is facing other problems namely high unemployment and a high degree of pessimism among its citizens. Bulgarian officials will even exceed the target rate of absorption of the EU workforce by 2020 – 75 percent – and raised the bar with a percentage, at 76 percent. To achieve this, the employment rate should increase by 0.75 percent each year until 2020.
In Romania, the employment rate was 64.4% in 2008, well below the target of 70% set by the Lisbon Strategy the EU member states apply for 2010, says the National Strategy for Sustainable Development, presented by the Ministry the environment. Women, young people and people over 45 years in Romania still have problems in finding a job.
Discrepancies between men and women are higher (65.7% vs. 52.5%). These differences are even more significant in the employment rate of older people (only 34.4% for women compared with 53% for men)(3).
The target of increasing employment rates is of paramount importance for Romania. In my opinion, this is the most important objective of Europe 2020.
improved, revenues also will improve significantly and will decrease the need for social transfers. However, achieving this objective is not sufficient to ensure the high rates of economic growth, as the employment rate increased only marginally during the previous boom. Specifically, active policies are needed, both at central government and local level.
Fight against social exclusion is one of the objectives of EU social policy. The target set in Europe 2020 aims to reduce with 20 million the number people at risk of poverty by 2020. Measured as a share of persons with an equivalent income below the poverty risk available, which is set at 60% of national average equivalent to disposable income (after social transfers), the indicator reached 23% in Romania, the second highest in the EU.
In Hungary the government is preparing measures of employment policy work at national level, to start economic growth and improve the absorption rate of employment among their citizens, especially among young people and unemployed people. The government has promised a million jobs over the next ten years, which would allow the EU closer to the target rate by 2020.
The Romanian economy is facing a labor shortage increasingly important due to the rapid and strong migration. However, the employment rate of employment is still low and unemployment is high, so there are, in principle, important sources of unused labor. In this context, the Romanian NRP focuses on attracting and retaining more people in work, by addressing the high level of non-wage costs through flexible contractual provisions by developing education and training and enhancing public employment labor. The Commission supports this objective.
4. Indicators on gross domestic expenditures on research and development
Indicator is called GERD (Gross domestic expenditure on R&D) as percentage of GDP. “Research and development comprises creative work undertaken systematically to increase the stock of knowledge, including knowledge of man, culture and society and use this stock of knowledge to devise new applications”. Research and development is an activity where there are significant transfers of resources between units, organizations and sectors and it is important to follow the flow of R&D funds(4).
The report is considered an attempt to monitor progress and effectiveness of implementing measures performance by the European research system.
There are three main strategies of the new Europe 2020: smart, sustainable growth and inclusive growth.
Priority Area “Smart growth” is to promote knowledge-based economy. This can be measured by two of the five EU objectives: 3% of EU GDP should be invested in research and development, school dropout rate below 10% and at least 40% of the younger generation should have a specialization or a diploma(5). Member States must transpose these targets into national targets and trajectories that reflect the current situation in each Member State and the level to be reached. The first target of investing 3% of GDP in research and development was established by the Lisbon Agenda, but the costs of R&D in Europe is below 2% (in comparison, the US reached 2.6% and 3.4% in Japan). Moreover, progress is extremely slow, with an increase of only 1.1 percentage points over the last decade, and only six Member States that invest more than 2% in R&D, while in most new Member States this level is less than 1%.
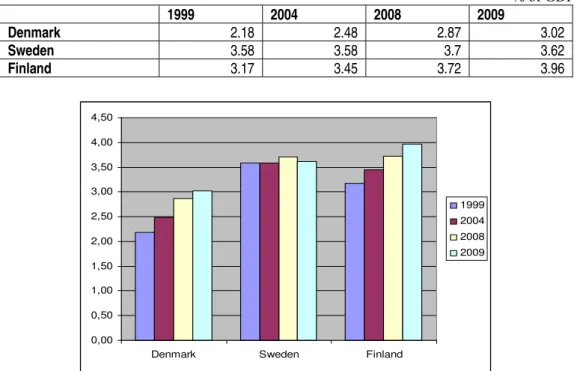
Table 3 % of GDP 1999 2004 2008 2009
Denmark 2.18 2.48 2.87 3.02
Sweden 3.58 3.58 3.7 3.62
Finland 3.17 3.45 3.72 3.96
0,00 0,50 1,00 1,50 2,00 2,50 3,00 3,50 4,00 4,50
Denmark Sweden Finland
1999 2004 2008 2009
Source: www.eurostat.ro, Headline Indicators/Europe 2020.
Gross domestic expenditure is on research and development (F&E) were for the Nordic countries amounted to about 3% of GDP in 2008, above the average of EU. Investments by foreign companies in the Nordic countries in research and development increased from 1995 until 2009 more than 6 times and stands at aproximatively 15% of total spending on research and development. Domestic industry spending on research and development has doubled in the last 10 years.
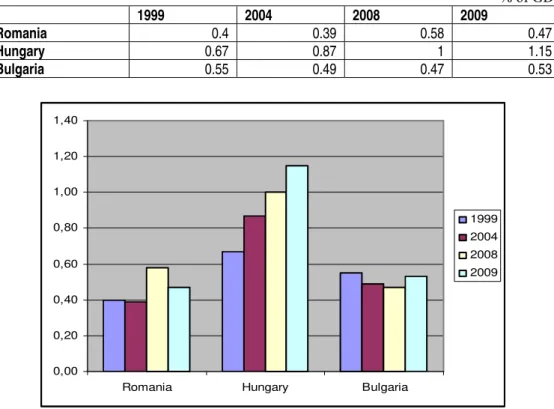
Table 4 % of GDP 1999 2004 2008 2009
Romania 0.4 0.39 0.58 0.47
Hungary 0.67 0.87 1 1.15
Bulgaria 0.55 0.49 0.47 0.53
0,00 0,20 0,40 0,60 0,80 1,00 1,20 1,40
Romania Hungary Bulgaria
1999 2004 2008 2009
Source: www.eurostat.ro, Headline Indicators/Europe 2020.
Figure 4.GERD in Central-Eastern countries
Eastern European countries are below the EU in terms of gross domestic expenditure, the best topping Hungary in 2008, reaching 1%. In Romania I noticed a decrease from 2004 until 2008 due to weak foreign investment and due to low investment in research and development.
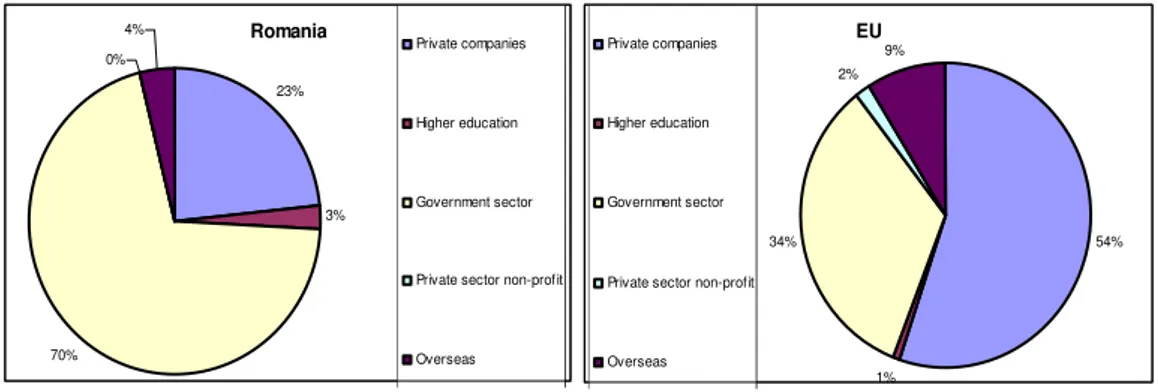
returned to the level existing before the boom, 0.2% of GDP respectively. Weak contribution of the private sector (more than 30% of total investments in R&D) is explained by the type of competition on the domestic market based on price rather than innovation. In addition, public research funds are used ineffective because they fail to create an effect of spreading in the private sector. There is also a bad connection between academic research and industrial applications. In the EU, on the other hand, the main contribution comes from the business and, unlike Romania, nonprofit private sector also invests in R&D.
Source: www.eurostat.ro.
Figure 5.GERD source funds in 2008
Innovation and research category still includes indicators from a wide range of sectors: Internet access, high-tech exports or e-government – and all three sectors are underdeveloped in Romania compared to EU average. Progress in recent years in the area related to Internet use is significant. Percentage of households having internet access at home is only 38%, compared with 65% EU average, but increased steadily in recent years, at a rapid pace (only 14% in 2006). Broadband penetration (number of dedicated connections, high speed, for 100 inhabitants), on the other hand, is almost the lowest in the EU (second lowest, with 12.3%). E-commerce is also an area where the difference between Romania and the EU average is important (in 2007, only 1.2% of total turnover of the companies came from e-commerce over the Internet, while the percentage reaches 4.2% in EU), but tripled the previous year. E-government, on the other hand, is a very underdeveloped sector – rate of online availability of e-government (measured as a percentage of 20 basic services are fully available online) is only 45% to 74% average
Romania
23%
3%
70% 0%
4%
Private companies
Higher education
Government sector
Private sector non-profit
Overseas
EU
54%
1% 34%
2% 9% Private companies
Higher education
Government sector
Private sector non-profit
EU (2009) and use of e-governance by individuals and businesses is the lowest in the EU, 6% and 41%, compared to 30% and 71% average EU(4).
Reduced public sector investments made in areas relevant to the objective “smart growth” are also highlighted by the low rate of public expenditure on education. But despite the relatively low spending on education, Romania manages to maintain a level of youth participation in education very close to EU average (78.3% vs. 78.5%), although the level is the lowest among the new Member States (including Bulgaria). In addition, the quality of education is affected by limited funding and inefficient use.
School dropout is also a point due to interest for Europe 2020. Percentage of population aged 18-24 years with at most lower secondary education (and without further education or training) is targeted to fall below 10%. In 2008, the share was 14.9% drop in the EU and 15.9% in Romania.
The objective of smart growth is at risk due to difficult fiscal position. Increasing public debt (although it remains well below the EU average) and budgetary constraints from the IMF agreement raises questions about Romania's ability to increase public expenditure on education and innovation on short and medium term. One of the objectives set by Europe 2020 is that 75% of the population aged 20-64 be employed. A primary objective for the employment policies that are directed is that of an average employment rate for the EU of 70% overall and at least 60% for women by 2010. They do not seem very ambitious, given that in 2008 the employment rate was 65.9% and 59.1% for women, but the recession that hit the world economy in 2009 had a massive impact on the labor market. Therefore, continuous improvement of indicators in terms of employment is likely to be stopped, and the trend could be just the opposite.
5. Conclusions
that the highest rates for 2009 are in the Nordic countries, where employment rates are higher. Thus, while the European average is 9.3%, the participation of individuals in lifelong learning in 2009 was 31.6% in Denmark, 22.2% in Sweden, 22.1% in Finland, 20.1% in the UK and 17% in the Netherlands.
If we analyze the situation in terms of poverty rate in the two sub-models we see that the Nordic countries registered a percentage of about 13%, the highest rate in Finland 13.18% in 2009, ranking among the first countries in the European Union's growth. Instead Eastern Europe countries register a rather high encounter rate in terms of poverty rate, the highest rate recorded in 2009 a Romania of 22%, respectively. The explanation for this major being difference would be quite simple: the economic stability of the Nordic countries, favorable policies for the population and the state, combined with active labor market policies of national security measures.
To learn about the case of Romania, where the sustainable development is questionable, the answer would be very simple: there are viable solutions to achieve the developed countries. Romania should enter the track as fast growth, sustainable growth based on performance management in all sectors of economic and social activities. Thus we are left to achieve as quickly as the national strategy objectives in areas like education, health, investment in research and development, rural development and administrative capacity.
Notes
(1)
According to www.eurostat.ro, Headline indicators/Europe 2020. (2)
“Risks and social inequalities, Presidential Commission for social and demographic risks”, September 2009.
(3)
See www.gea.org.
(4)
See www.eurostat.ro, Employment rate. (5)
References
Comisia prezidenţială pentru riscuri sociale și demografice, „Riscuri şi inegalităţi sociale”, Septembrie 2009
Dinu, M., Socol, C., Marinaș, M. (2008). Economie europeană. O prezentare sinoptică, Editura Economică, Bucureşti
Dinu, M., Socol, C., Marinaș, M. (2007). Modelul european de integrare,Editura Economică, Bucureşti
Guvernul României, Ministerul Mediului, „Strategia naţională pentru dezvoltare durabilă, Orizonturi 2013-2020-2030”, Bucureşti, 2008
Socol, C., Marinaș, M., Socol, A., „Sustenabilitatea fiscală şi coeziune socială. Comun şi specific în submodelele UE”, Economie Teoretică şi Aplicată, vol. XVII, no. 3, 2010, pp.25-44