Atlas Journal of Biology 2 (3): 154–161, 2013 doi: 10.5147/ajb.2013.0129
Atlas J
our
nal of
Biolog
y - ISSN 2158-9151. Published By Atlas Publishing
, LP (www
.atlas-publishing
.o
rg)
Transcript Abundance Responses of Resistance Pathways of
Arabidopsis thaliana
to Deoxynivalenol
Jiazheng Yuan
1,2, Michelle Zhu
3, Khalid Meksem
4, Matt Geisler
2, Patrick Hart
5, and David A.
Lightfoot
1,2*1
Department of Plant, Soil Sciences, and Agriculture System, Southern Illinois University at Carbondale,
Car-bondale, IL 62901 USA;
2Department of Plant Biology, Southern Illinois University at Carbondale,
Carbon-dale, IL 62901 USA;
3Department of Computer Science, Southern Illinois University at Carbondale,
Carbon-dale, IL 62901 USA;
4Plants and Microbes Genomics and Genetics lab, Department of Plant, Soil Sciences,
and Agriculture System, Southern Illinois University at Carbondale, Carbondale, IL 62901 USA;
5Department
of Pathology, Michigan State University, East Lansing MI , 48824 USA.
Received: June 30, 2013 / Accepted: August 22, 2013
__________________________________________________
Abstract
Mycotoxin deoxynivalenol (DON), produced by Gibberella zeae (Schwein.) Petch (teleomorph of Fusarium graminearum
Schwabe) was known to be both a virulence factor in the pathogenesis of Triticum aestivum L. (wheat) and an inhibi-tor of Arabidopsis thaliana L. seed germination. Fusarium gra-minearum causes both Gibberella ear rot in maize (Zea mays
L.) and Fusarium head blight (FHB) in wheat and barley.
Arabidopsis thaliana was also a host for the related root rot pathogen F. virguliforme Aoki. A. thaliana seedling growth was reduced by the pathogen in a proportional response to in-creasing spore concentrations. Here, the changes in transcript abundances corresponding to 10,560 A. thaliana expressed sequence tags (ESTs) was compared with changes in 192 known plant defense and biotic/abiotic stress related genes in soybean roots after infestation with F. virguliforme. A paral-lel comparison with a set of resistance pathways involved in response to the DON toxicity in A. thaliana was performed.
A. thaliana data was obtained from the AFGC depository. The variations of transcript abundances in Arabidopsis and soybean treated with pathogen suggest that both plants re-spond to the pathogen mainly by common, possibly global responses with some speciic secondary metabolic pathways involved in defense. In contrast, DON toxin appeared to im-pact central metabolisms in Arabidopsis plants with signiicant alterations ranging from the protein metabolism to redox pro-duction. Several new putative resistance pathways involved in responding to both pathogen and DON infestation in soy-bean and A. thaliana were identiied.
Keywords: Glycine max, Arabidopsis thaliana, Fusarium, de-oxynivalenol, DON, pathway, interaction.
Introduction
In the ield, many fungal species cause plant diseases, sev-eral of which produce speciic mycotoxins (Bai et al., 2002). Mycotoxins are diverse secondary metabolites formed by fungi through terpenoid, polyketide, and other biosynthetic pathways. One of the important groups of Fusarial mycotoxins, named the trichothecenes, that include deoxynivalenol (DON) and T-2 toxin, are commonly found in cereal grains as a result of fungal infec-tion. Trichothecenes inhibit protein synthesis. DON inhibits a wide set of steps in gene expression but has been shown to reduce the activity of eukaryotic ribosomes (60S subunit) and impairs the initiation or elongation and termination steps of protein synthesis (Ehrlich and Daigle, 1987; Feinberg and Mclaughlin, 1989).
Sudden death syndrome (SDS) of soybean (Glycine max L. Merr.) caused by fungal pathogen Fusarium virguliforme (Aoki; ex. F. solani Mart. Sacc., ex f.sp. glycines Roy) produces root cell infection as well as leaf scorch, which mycotxins produced in roots translocated into soybean leaves and resulted in disease symptom. Both root rot and leaf scorch can cause signiicant yield losses. Iqbal et al. (2005) measured changes in transcript abundance (TA) of 192 known plant defense and biotic/abiotic stress related genes from a soybean root cDNA library within a time course study. They found at least two-fold TA increase among 36 of these resistance genes from day 3 to day 10 after the pathogen was infested in the soil surrounding the roots of a resistance genotype.
Atlas J
our
nal of
Biolog
y - ISSN 2158-9151. Published By Atlas Publishing
, LP (www
.atlas-publishing
.o
rg)
the concentration of DON were seen for Arabidopsis root elon-gation (Shin et al., 2012). Transgenic expression of a barley UDP-glucosyltransferase provided resistance to DON.
Masuda et al. (2007) demonstrated that seedlings showed dwarism with morphological changes such as petiole shortening, curled dark-green leaves, and reduced cell size under T-2 toxin treatment. When T-2 toxin was applied into the leaves of Arabi-dopsis, it showed an elicitor-like activity in plant cells (Nishiuchi et al., 2006). DON tends to be harmful to the translational machin-ery in plants but may also inhibit transcription and elicitor-like signaling pathways in Arabidopsis cells (Masuda et al., 2007; Shin et al., 2012). Studies showed that pathogens with toxicity (Tox) gene mutations were often nonvirulent (Graniti, 1991), or caused less symptoms than the wild-type counterparts, suggest-ing that trichothecenes were pathogenesis factors of Fusarium graminearum (Desjardins and Hohn, 1997; Awad et al., 2008). Genetic engineered defense response genes provide an alter-native strategy to reduce F. graminearum infection. Overexpres-sion of a barley class II chitinase (EC 3.2.1.14) gene increased the resistance against F. graminearum in wheat (Mackintosh et al., 2007; Shin et al., 2008) and thereby reduced head blight and DON toxicity. DON and glutathione formed a glucose-conjugate to reduce DON toxicity in vivo and wheat transgenic plants carrying barley UDP-glucosyltransferase converted DON into a DON-glucoside and displayed an enhanced tolerance to DON (Shin et al., 2012). To date, there is no a single model of plant vs. toxin interaction and no simple or common resistance mechanism to explain the mechanism of plant resistance to tri-cothecene toxins like DON and T2. Whether there is a close correlation between DON toxicity and Fusarium infection is still not fully understood.
Microarray experiments allow the dissection genome wide patterns of mRNA abundances and improve understanding of the molecular basis of the plant defense responses. These global and simultaneous analyses of TA proiles enable variations in mRNA abundances under speciic treatments to be compared. In order to compare the plant resistance mechanism to DON toxicity and infection of Fusarial pathogens, microarray data from Arabidopsis thaliana cells challenged with the mycotoxin DON was compared to the data from the plants responding to
F. virguliforme infestations herein. The cDNA microarray chips used contained over 10,000 different ESTs (AFGC set 2001) was employed in both analyses. The irst objective of this ap-proach was to identify genes that were transcriptionally regulat-ed when plants were treatregulat-ed with the toxin. The second objective using the microarray data was to identify resistance pathways where these co-regulated genes were positioned. The parallel comparison on transcriptional activities among Arabidopsis and soybean after fungal pathogen F. virguliforme pathogenesis and
Arabidopsis with DON treatment was also performed.
Materials and Methods
Arabidopsis thaliana Seed Germination, RNA Isolation and Micro-array Procedure
A. thaliana ecotype ‘Columbia’ seeds were germinated and
RNA was extracted from young seedlings treated with DON (for 6 hours or 24 hours) or water (ftp://smd-ftp.stanford.edu /smd/organi sms/AT), respectively. Microarray (21124.xls and 22172.xls at ftp://smd-ftp.stanford.edu/smd/ organisms/AT/) platform for the gene expression analysis was performed in this experiment. The mRNA samples corresponding to DON treat-ment and non-treated control were labeled using Cy3- or Cy5- labeled dUTP. One technical replicate was applied by using reversed dye labels compared to the irst hybridization (ftp:// smd-ftp.stanford.edu/smd/). Dr. Patrick Hart at Michigan State University carried out the microarray experiment.
Microarray Gene Expression Data Analysis
The cDNA microarray data were normalized by local (lo-cal background value was subtracted from the intensity value of each spot) metrics. Stringent quality control measures were applied to all stages of data analysis. The normalization pro-cedure for the microarray data followed the method described by Pevsner (2003) to adjust for differences in the intensity of the two labels. Coeficients of means, variances of the signal intensi-ties in each channel, and ratios of signals from two replicates were calculated by a C++ program written for the purpose. The C++ program was also applied to handle the missing and extra data values.
MapManTM allows the visualization of transcriptomic and me-tabolomic data simultaneously (http://gabi.rzpd.de/projects/ MapMan/; Thimm et al., 2004). Classiication of Image Annota-tor in the software was also used to diagram the data display. After the Arabidopsis EST-based microarray data were convert-ed into Affymetrix 22K array annotation, all the genes that cor-responded from both reverse labeled arrays were subjected to pathway construction using the MapMan platform (http://gabi. rzpd. de/projects/MapMan). Transcripts that were increased in abundance were denoted as blue, and transcripts that were decreased in abundance were denoted as red. The identiied metabolic clusters and their relationships in metabolism by the MapMan platform were displayed as bins (1-100) and each bin represented a set of related pathways. In the scale used for the visualized data, a 2-fold (1 on Log2) change was required to produce a visible coloration. A computer platform, Arabidopsis
Interactions Viewer (renamed Interactome 2.0, http://bar.uto-ronto.ca/interactions/cgi-bin/arabidop sis_interactions_viewer. cgi) was employed to predict protein-protein interactions (intero-logs, Geisler-Lee et al., 2007). Output of interlogs was plugged into the Cytoscape software environment (Shannon et al., 2003) for network visualization and modeling to against each other in order to catalog all of their conserved pathways and gene interaction networks. The program was equipped with a plug-in architecture for customizing applications. Visual data were dis-played on Log 2 scale and saved as a Cytoscape graph. In the Cytoscape diagram of a transcriptional network, nodes repre-sented structural genes and their regulatory elements and links represented protein-protein (transcription factor DNA binding) interactions. Regulatory genes appeared as ‘hubs’ in a network and possessed many interactions.
Atlas J
our
nal of
Biolog
y - ISSN 2158-9151. Published By Atlas Publishing
, LP (www
.atlas-publishing
.o
Atlas J
our
nal of
Biolog
y - ISSN 2158-9151. Published By Atlas Publishing
, LP (www
.atlas-publishing
.o
rg)
Results
Overview of TA Alterations After DON Treatment
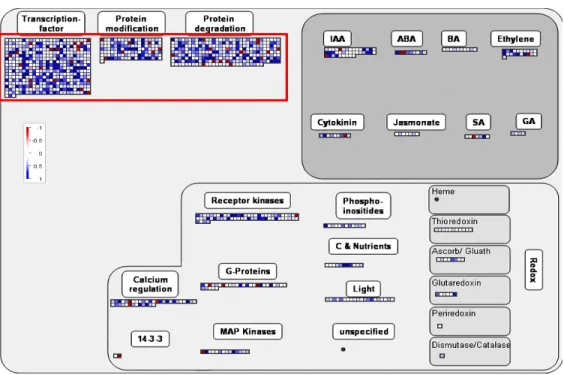
The microarray analysis clearly indicated that deoxynivale-nol (DON) treatment resulted in major responses among tran-script abundances (TAs; Figure 1; Table 1). TAs in cell cultures derived from Arabidopsis seedlings were altered differently by DON over time. Six hours (6h) after DON treatment, 391 transcripts were increased in abundance by more than 2 fold (displayed as 1 fold on Log 2 scale) but 169 transcripts were decreased in abundance by more than 2 fold (displayed as -1 fold on Log 2 scale) and 119 of them were reduced by more than 3 fold. However, only 120 transcripts appeared to be in-creased in abundance by more than 2 fold 24 hours (24h) after DON was applied (Figure 1; Table 2). Conversely, 181 tran-scripts were decreased in abundance by more than 2 fold at this time point. Moreover, the transcripts that could be detected by the microarray experiment were signiicantly reduced by nearly 40% suggesting that the toxicity to transcription and subsequent metabolic perturbations might occur in the process of the time course experiment (data not shown).
Description of Signiicantly Regulated Pathways in the MapMan Platform
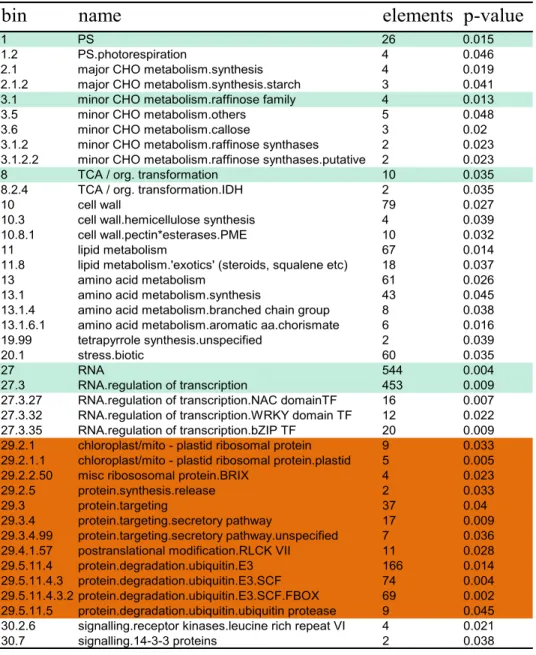
The Arabidopsis transcript abundances that were signiicantly increased (log 2 ≥ 1) and decreased (log2 ≥ -1) were visual-ized within the MapMan platform to identify metabolic clusters and their relationships in metabolism. The preliminary analysis displayed by the MapMan platform indicated that the transcript abundances following the DON treatment had been dramati-cally altered in many metabolic clusters. By 6 hours after DON treatment, the 560 genes that had signiicantly altered TA (≥1 or ≤-1 on Log2 scale) in the two reversed labeled slides were assembled into 12 major bins and each bin represented a set of related pathways (Table 1). Within these 12 bins, more than 41 sub-bins were differentially regulated by DON. The toxicity of DON had a major effect on the pathways of the protein syn-thesis and degradation. There were 12 sub-bins in bin29 (pro-tein metabolism) and 4 sub-bins in bin27 (RNA synthesis) being strongly affected by DON, which suggested that DON toxicity also targeted to the gene transcription (Table 1A, B). Moreover, TA changes in signaling and hormone metabolism bins were also altered.
At 24h after DON treatment, 301 genes that had TAs sig-niicantly altered were assembled into 16 major bins, within which were a total 1,945 genes (Table 2). There were more than 35 sub-bins that contained TAs that were signiicantly af-fected by the DON toxin (P<0.05). TAs in bin27 (RNA transcrip-tion) and bin29 (protein metabolism) were reduced signiicantly at this stage. In total 1,045 genes encompassed by the bin27 were affected by DON 6h after treatment but only 776 genes remained in the bin 24h after the treatment. The bin29 also showed clearly an inhibition in protein metabolism indicating a suppressed responsiveness by the toxin 24h post DON treatment (Figure 1B). Only 3 of the 12 sub-bins altered at 6h were still
preserved at 24h after DON treatment. The number of genes encompassed by these affected sub-bins were reduced from 410 to 79. Therefore, a large proportion of genes involved in protein metabolism that were poisoned by the mycotoxin at 24h were normally abundant at 6h after treatment. In paral-lel, several other bins such as transporter genes and the genes related with lipid metabolism and redox reactions were altered at 24h, whereas they were not at 6h. Furthermore, about half of the transcripts altered at 24h had unknown functions (713 genes) and can now be annotated as invilvoed in responses to DON. Whether the plants attempt to reconigure and bypass the inhibited enzymes and damaged pathways still need to be determined.
Unlike F. virguliforme infestation of soybean and Arabidopsis, none of the crucial gene transcripts that potentially involved in secondary metabolism (bin 16) had been increased in abun-dance after DON toxin was applied. No pathway leading to isoprenoid, phenylpropanoid, and lignin biosynthesis was shown increased in TA at either 6 or 24 h after treatment. Therefore, DON inhibition does not appear to trigger all of the same biotic and abiotic stress response pathways as F. virguliforme infesta-tion.
Networks of Protein-protein Interaction
Bin29 contained many genes involved in plant defense sche-ma (Wang et al., 2006) and transcripts in this bin were greatly affected by DON treatment. The 417 genes encompassed in this bin (from the stage of 6 hours after DON treatment) were visu-alized using the Arabidopsis Interactions Viewer (Geisler-Lee et al., 2007) to investigate the potential molecular protein-protein interactions among genes with TA changes. The output of the interlogs from the Arabidopsis Interaction Viewer (Geisler-Lee et al., 2007) was plugged into the Cytoscape software envi-ronment (Shannon et al., 2003) for network visualization and modeling. In these diagrams of protein –protein interaction net-works, nodes represented structural genes and their regulatory elements while links denoted protein-protein interactions. Regu-latory genes like transcription factors appeared to be ‘hubs’ in a network and had many interactions. Four hubs, At2g38560 (TFIIF (-3.258/Log2)), At3g55620 (EMB1624 (1.310/Log2)), At1g36730 (ETIF5 (1.025/Log2)), and At2g47020 (PCRF (1.079/Log2)) were identiied 6h after DON was applied (Fig-ure 3). The multiple network characteristics among several hubs (highlighted in red) inferred resistance related protein-protein interactions and displayed a correlation between the complexity of a network and the property of resistance.
among genes of unknown function was in contrast to the reduc-tion in the number of TAs that were involved in other metabolisms in Arabidopsis plants at this stage. Whether or how the increased TA of these genes of unknown function provides a bypass for
damaged enzymes and compartments to escape the toxin selec-tion is still not known.
Atlas J
our
nal of
Biolog
y - ISSN 2158-9151. Published By Atlas Publishing
, LP (www
.atlas-publishing
.o
rg)
Atlas J
our
nal of
Biolog
y - ISSN 2158-9151. Published By Atlas Publishing
, LP (www
.atlas-publishing
.o
rg)
Figure 1. Transcript abundance changes in responses of Arabidopsis cells to DON treatments. The crucial metabolic pathways in the MapMan program were marked in red rectangles . The small blue and red squares denoted increased (positive) and decreased (negative) transcript abundances (TAs) of individual genes. The bar was shown on log 2 scale (1=two fold change). A. 6 hours after DON was applied. B. 24 hours after DON was applied.
Discussion
A number of fusarial species cause infections that both reduce yield and grain quality on major cereal crops such as wheat, barley, and maize. Mycotoxins produced by these pathogens lead to feed-born intoxications in farm animals (Awad et al., 2008). Mycotoxins have also been considered as aggressive-ness factors in pathogens in both wheat and maize. Cumagun et al. (2008) identiied loci associated with pathogenicity and ag-gressiveness in a F. graminearum population derived from a cross between a NIV producer lineage 6 from Japan and a DON producer lineage 7 from Kansas. Lineage 7 was the dominant race that caused FHB and Gibberella ear rot in crops (O’Donnell et al., 2000; Xu and Nicholson, 2009). Mycotoxin trichothecenes (that include DON and T2 toxin) appeared to possess multiple
Atlas J
our
nal of
Biolog
y - ISSN 2158-9151. Published By Atlas Publishing
, LP (www
.atlas-publishing
.o
rg)
inhibitory effects ranging from protein, DNA, and RNA synthesis to signaling and membrane functions in eukaryotes (Rocha et al., 2005). The toxins enhance the spread of F. graminearum
fungal pathogen (Lori et al., 1997). A close relationship between the concentration of DON and FHB severity and 1,000 kernel weight was observed suggesting that the trait was affected by the production of the toxin (Lori et al., 1997; Hestbjerg et al., 2002). DON also affected root elongation and the roots were less organized compared with the control in A. thaliana (Hart, unpublished data, AAFC). Evidences demonstrated that reduction of toxin production by the pathogen or removal/degradation of the toxin by the host reduced aggressiveness of some pathogens (Foroud and Eudes, 2009). Pathogens with toxicity (Tox) gene mutation appeared to be non-virulent (Graniti, 1991) or caused lesser disease symptoms than the wild-type (Desjardins and
bin
name
elements p-value
1 PS 26 0.015
1.2 PS.photorespiration 4 0.046
2.1 major CHO metabolism.synthesis 4 0.019
2.1.2 major CHO metabolism.synthesis.starch 3 0.041
3.1 minor CHO metabolism.raffinose family 4 0.013
3.5 minor CHO metabolism.others 5 0.048
3.6 minor CHO metabolism.callose 3 0.02
3.1.2 minor CHO metabolism.raffinose synthases 2 0.023 3.1.2.2 minor CHO metabolism.raffinose synthases.putative 2 0.023
8 TCA / org. transformation 10 0.035
8.2.4 TCA / org. transformation.IDH 2 0.035
10 cell wall 79 0.027
10.3 cell wall.hemicellulose synthesis 4 0.039
10.8.1 cell wall.pectin*esterases.PME 10 0.032
11 lipid metabolism 67 0.014
11.8 lipid metabolism.'exotics' (steroids, squalene etc) 18 0.037
13 amino acid metabolism 61 0.026
13.1 amino acid metabolism.synthesis 43 0.045
13.1.4 amino acid metabolism.branched chain group 8 0.038 13.1.6.1 amino acid metabolism.aromatic aa.chorismate 6 0.016
19.99 tetrapyrrole synthesis.unspecified 2 0.039
20.1 stress.biotic 60 0.035
27 RNA 544 0.004
27.3 RNA.regulation of transcription 453 0.009
27.3.27 RNA.regulation of transcription.NAC domainTF 16 0.007 27.3.32 RNA.regulation of transcription.WRKY domain TF 12 0.022 27.3.35 RNA.regulation of transcription.bZIP TF 20 0.009 29.2.1 chloroplast/mito - plastid ribosomal protein 9 0.033 29.2.1.1 chloroplast/mito - plastid ribosomal protein.plastid 5 0.005
29.2.2.50 misc ribososomal protein.BRIX 4 0.023
29.2.5 protein.synthesis.release 2 0.033
29.3 protein.targeting 37 0.04
29.3.4 protein.targeting.secretory pathway 17 0.009
29.3.4.99 protein.targeting.secretory pathway.unspecified 7 0.036 29.4.1.57 postranslational modification.RLCK VII 11 0.028
29.5.11.4 protein.degradation.ubiquitin.E3 166 0.014
29.5.11.4.3 protein.degradation.ubiquitin.E3.SCF 74 0.004 29.5.11.4.3.2 protein.degradation.ubiquitin.E3.SCF.FBOX 69 0.002 29.5.11.5 protein.degradation.ubiquitin.ubiquitin protease 9 0.045 30.2.6 signalling.receptor kinases.leucine rich repeat VI 4 0.021
30.7 signalling.14-3-3 proteins 2 0.038
Atlas J
our
nal of
Biolog
y - ISSN 2158-9151. Published By Atlas Publishing
, LP (www
.atlas-publishing
.o
rg)
Hohn, 1997) also suggesting that there was a biological role for the trichothecenes in the virulence of F. graminearum.
Here DON toxin was shown to have a profound and patho-gen-like impact on the transcript abundance of genes encoding several crucial metabolic pathways in Arabidopsis with a scope from the protein metabolism to redox control. In contrast, some of the responses might not be related to pathogenicity. For ex-ample, many of the 1,045 genes distributed among bin27 of the RNA transcription related bins were altered in TA by DON. This result contrasted to that of F. virguliforme infestation where there was no bin27 pathway effect was observed (Yuan et al 2008). Similarly, during F. virguliforme infection, a large proportion of altered TAs that were in protein metabolism related genes as-signed to bin29 (protein metabolism) were not concentrated in the same sub-bins of protein synthesis and posttranslational modiication altered by DON (Yuan et al., 2008). Only a few of transcripts altered were involved in protein activation, post-translational modiication, degradation, and folding. . This was
Atlas J
our
nal of
Biolog
y - ISSN 2158-9151. Published By Atlas Publishing
, LP (www
.atlas-publishing
.o
rg)
consistent with the known activities of DON as an inhibitor of translation and a pathogenesis factor (Ueno et al., 1969; Fein-berg and Mclaughlin, 1989; Ehrlich and Daigle, 1987; Harris et al., 1999; Cumagus et al., 2008; Shin et al., 2012).
The toxic function of DON is an inhibitor for the protein syn-thesis on the 60S subunit of eukaryotic ribosomes and inhibits the initiation or elongation and termination steps of protein synthesis (Feinberg and Mclaughlin, 1989; Ehrlich and Daigle, 1987). From 6 to 24h after DON treatment, the number of af-fected transcripts in bin27 and bin29 was reduced signiicantly. There were only 3 sub-bins left in bin29 24h after DON treat-ment. This suggested that a large proportion of genes involved in protein metabolism were affected by the mycotoxin initially but metabolism was restored later. However, several other new bins emerged, such as transporter genes and the genes related with lipid metabolism and redox reactions at this stage. About half of the transcripts altered were among bins encompassing genes with unknown functions (713 genes). The results were in
Table 2. Description of the Mapman bins (metabolic clusters) with signiicant changes in TAs by 24 hours after DON treatment. The bin numbers were denoted from 1-100. Sub-bins were listed as deci-mals. Only bins encompassing genes with signiicant changes in transcript abundance (P<0.05) were listed. The number of elements in each bin present on the array was listed. The bins highlighted by light blue and brown colors contained many TAs highly affected by the mycotoxin. (P<0.05).
bin
name
elements p-value
1.1.30 PS.lightreaction.state transition 2 0.024
1.3 PS.calvin cyle 5 0.042
3.1.2 minor CHO metabolism.raffinose synthases 2 0.04
3.6 minor CHO metabolism.callose 2 0.033
8 TCA / org. transformation 15 0.01
8.1.1 TCA / org. transformation.TCA.pyruvate DH 2 0.017
8.2.10 TCA / org. transformation 2 0.026
11.2 lipid metabolism.FA desaturation 5 0.036
13.2 amino acid metabolism.degradation 14 0.008
16.7 secondary metabolism.wax 3 0.022
17.8 hormone metabolism.salicylic acid 6 0.049
17.8.1 hormone metabolism.SA.synthesis-degradation 6 0.049
20.2.99 stress.abiotic.unspecified 17 0.001
21 redox.regulation 29 7.00E-04
21.6 redox.dismutases and catalases 3 0.005
23.1 nucleotide metabolism.synthesis 9 0.016
23.1.2 nucleotide metabolism.synthesis.purine 6 0.03
26.19 misc.plastocyanin-like 2 0.048
27 RNA 394 0.015
27.3 RNA.regulation of transcription 333 0.008
27.3.11 RNA.regulation of transcription.C2H2 zinc finger family 18 0.029 27.3.15 RNA.regulation of transcription. HAP3 2 0.033 27.3.21 RNA.regulation of transcription.GRAS TA 5 0.029 27.3.25 RNA.regulation of transcription.MYB domain TA 19 0.01 27.3.69 RNA.regulation of transcription.SET-domain TA 5 0.024
29.2.3 protein.synthesis.initiation 23 0.016
29.4.1.57 protein.postranslational modification.kinase.RLCK VII 7 0.042 29.5.11.4.3 protein.degradation.ubiquitin.E3.SCF 49 0.042
33 development 81 8.00E-04
33.99 development.unspecified 70 0.0002
34.12 transport.metal 13 0.048
34.21 transport.calcium 4 0.018
35.1.41 not assigned.no ontology.hydroxyproline rich proteins 14 0.014 35.1.5 not assigned.no ontology.pentatricopeptide (PPR) P. 65 0.0005
Atlas J
our
nal of
Biolog
y - ISSN 2158-9151. Published By Atlas Publishing
, LP (www
.atlas-publishing
.o
rg)
concordance with earlier studies of Fusarium infested in Arabi-dopsis thaliana (Yuan et al., 2008). If plants rather attempt to reconigure those inhibited enzymes and bypass the damaged pathways via a backup system is still unknown and functions for these genes can be inferred. Unlike in soybean F. virguliforme in-festation (Yuan et al., 2008), none of the crucial gene transcripts that were classiied as potentially being involved in secondary metabolism (bin 16) had been increased in abundance when DON toxin was applied. No pathway leading to isoprenoid,
phenylpropanoid, and lignin biosynthesis was shown increased in the TAs. F. virguliforme infection of A. thaliana only increase PAL and C3H suggesting phenolics rather than lavonoids were being produced. Therefore, it appears that lavonoids (anthocyanins, proanthocyanidins, lavones, and lavonols) in Arabidopsis may indeed not play a signiicant role in defense.
Dissection of gene transcript abundance regulation may be one of the main strategies used to decipher resistance gene func-tion because many transcript changes may be involved in plant defense processes (Journot-Catalino et al., 2006). By compari-son of species, organ, and time speciic transcript abundances of thousands of genes simultaneously, investigations of alterations in these transcripts have provided unique opportunities to delve into gene function. To analyze the dynamics of TA change during DON mycotoxin treatments, Arabidopsis seedlings were treated with DON toxin and transcript abundances were evaluated in a time course study. Moreover, in speciic metabolic pathways, the transcripts that could be detected by the microarray experi-ment were signiicantly reduced and a large number of genes of unknown function were emerged 24 hours after DON treat-ment suggesting that the toxicity to transcription and subsequent metabolic perturbations might have largely occurred in the later stage of the time course experiment. The reasons for the anti-parallel reduction in one pathway and induction of the unknowns still need to be investigated. If a transcription factor or factors underlay the inhibition of groups of genes, each individual met-abolic pathway should be interrogated for a common cis-acting element. In contrast, if toxicity occurred in the transcriptome, in-vestigations of adaptive changes in the metabolic transcriptome should be performed.
The similarities and differences inferred among the metabolic responses of Arabidopsis thaliana to DON and Fusarium virgu-liforme might be attributed to nature of the pathogenesis fac-tors. The resistance regulation and signaling pathways in Ara-bidopsis plants to these pathogenesis factors may share similar components. Based on results here, DON toxin appeared to be a remarkable pathogenesis factor with effects on the crucial metabolic pathways ranging from the protein metabolism to redox reactions with signiicant metabolic alterations in Arabi-dopsis plants. Therefore, the results presented here may provide basic knowledge and an alternative strategy for developing more cultivars with resistance/tolerance to the toxin. Overex-pression of defense response genes such as a barley class II chi-tinase (EC 3.2.1.14) gene that broke chitin, a key component of the cell wall in Fungi enhanced the resistance against Fusarium graminearum (Mackintosh et al., 2007; Shin et al., 2008) and thereby reduced FHB (Fusarium head blight) and DON toxicity. Shin et al. (2012) showed that DON conjugated with glutathi-one into a glucose-conjugate in vivo was no longer toxic. Barley UDP-glucosyltransferase converted DON into a DON-glucoside and therefore, transgenic Arabidopsis carrying the barley gene displayed an enhanced tolerance to DON. Therefore, the effec-tive neutralization of DON and other trichothecene toxins can be used to provide resistance/tolerance to the Fusarium pathogens and this strategy should be also explored in genetic engineering soybean plants.
TFIIS PCRF
EMB162 4 ETIF5
Figure 2. Network of predicted protein-protein interactions among genes from bin 29 in A. thaliana 6 hours post DON treatment. The networks were generated by Cytoscape (Shannon et al. 2003) and visual displays were saved as Cy-toscape graphs. Major interaction hubs were marked by red.
Figure 3. Network predicted protein-protein interactions from bin29 in A. thaliana treated with DON after 24 hours. The networks were generated by Cytoscape (Shannon et al. 2003) and visual displays were saved as Cytoscape graphs. Major interaction hubs were marked by yellow.
Protein Kinase APG4a APG7
Atlas J
our
nal of
Biolog
y - ISSN 2158-9151. Published By Atlas Publishing
, LP (www
.atlas-publishing
.o
rg)
Acknowledgements
This research was funded in part by grants from the National Science Foundation, the Illinois Soybean Association and the United Soy Board.
References
Aoki T, K O’Donnell, Y Homma, and AR Lattanzi (2003) Sudden death syndrome of soybean is caused by two morphologically and phy-logenetically distinct species within the Fusarium solani species com-plex—F. virguliforme in North America and F. tucumaniae in South America. Mycologia 95: 660–684.
Bai GH, AE Desjardins, and RD Plattner (2002) Deoxynivalenol non-producing Fusarium graminearum causes initial infection, but does not cause disease spread in wheat spikes. Mycopathologia 153: 91-98.
Baker RA and S Nemec (1994) Soybean sudden death syndrome: iso-lation and identiication of a new phytotoxin from cultures of the causal agent, Fusarium solani. (Abstract). Phytopathology 84:1144. Desjardins AE and RH Proctor (2007) Molecular biology of Fusarium
mycotoxins. Internat J Food Microb, 119 (1-2): 47–50.
Desjardins AE and Hohn TM (1997) Mycotoxins in plant pathogenesis. Molec Plant Microb Inter, 10: 147-152
Gallo A, G Mulè, M Favilla, and C Altomare (2004) Isolation and char-acterisation of a trichodiene synthase homologous gene in Tricho-derma harzianum. Physiol Molec Plant Path 65: 11-20
Geisler-Lee J, N O’Toole, R Ammar, J Nicholas, A Provart, H Millar, and M Geisler (2007) A predicted interactome for Arabidopsis. Plant Physiology, 145: 317–329
Graniti A (1991) Phytotoxins and their involvement in plant disease. Experentia, 4: 751-755.
Hohn TM, and PD Beremand (1989) Isolation and nucleotide sequence of a sesquiterpene cyclase gene from the trichothecene-producing fungus Fusarium sporotrichioides. Gene 79 (1): 131–138.
Journot-Catalino N, IE Somssich, D Roby, and T Kroj (2006) The tran-scription factors WRKY11 and WRKY17 act as negative regulators of basal resistance in Arabidopsis thaliana. Plant Cell, 18:
3289-3302.
Iqbal MJ, S Yaegashi, R Ahsan, R Shopinski, and DA Lightfoot (2005) Root response to F. solani f. sp. glycines: Temporal accumulation of transcripts in partially resistant and susceptible soybean. Theor Appl Genet, 110: 1429-1438.
Lebeda A, L Luhova, M Sedlarova, and D Jancova (2001) The role of enzymes in plant–fungal pathogens interactions. J Plant Dis Protect 108: 89–111.
Masuda D , M Ishida, K Yamaguchi, I Yamaguchi, M Kimura, and T Nishiuchi (2007) Phytotoxic effects of trichothecenes on the growth and morphology in Arabidopsis thaliana. J Exp Bot 58: 1617-1626. Nishiuchi T, D Masuda, H Nakashita, K Ichimura, K Shinozaki, S Yo-shida, M Kimura, I Yamaguchi, and K Yamaguchi (2006) Fusarium phytotoxin trichothecenes have an elicitor-like activity in Arabidopsis thaliana, but the activity differed signiicantly among their molecular species. Molec Plant Microb Inter 19: 512-520.
Pevsner J (2003) Bioinformatics and Functional Genomics, New York: John Wiley & Sons Inc.
Shannon P, A Markiel, O Ozier, NS Baliga, JT Wang, D Ramage, N Amin, B Schwikowski, and T Ideker (2003) Cytoscape: a software environment for integrated models of biomolecular interaction net-works. Genome Res. 13: 2498–2504.
Shin S, JA Torres-Acosta, SJ Heinen, S McCormick, M Lemmens, MP Paris, F Berthiller, G Adam, and GJ Muehlbauer (2012) Transgenic Arabidopsis thaliana expressing a barley UDP-glucosyltransferase exhibit resistance to the mycotoxin deoxynivalenol. J Exp Bot 63: 4731-4740.
Thimm O, O Blasing, Y Gibon, N Nagel, S Meyer, P Kruger, J Selbig, LA Muller, SY Rhee, and M Stitt (2004) MAPMAN: a user-driven tool to display genomics data sets onto diagrams of metabolic pathways and other biological processes. Plant J, 37: 914–939.
Wang Y, B Yun, Y Kwon, J Hong, J Yoon, and G Loake (2006) S-Nitro-sylation: an emerging redox-based post-translational modiication in plants. J Exp Bot, 2006, 57: 1777-17784.