Submitted20 December 2015 Accepted 27 April 2016 Published18 May 2016
Corresponding author
Heloise Gibb, h.gibb@latrobe.edu.au
Academic editor Donald Kramer
Additional Information and Declarations can be found on page 13
DOI10.7717/peerj.2049
Copyright 2016 Gibb et al.
Distributed under
Creative Commons CC-BY 4.0
OPEN ACCESS
Foraging loads of red wood ants:
Formica
aquilonia
(Hymenoptera: Formicidae)
in relation to tree characteristics and
stand age
Heloise Gibb1,2, Jon Andersson1and Therese Johansson1
1Department of Wildlife, Fish and Environmental Sciences, Swedish University of Agricultural Sciences, Umea, Sweden
2Department of Ecology, Environment and Evolution, La Trobe University, Melbourne, Australia
ABSTRACT
Background.Foraging efficiency is critical in determining the success of organisms and may be affected by a range of factors, including resource distance and quality. For social insects such as ants, outcomes must be considered at the level of both the individual and the colony. It is important to understand whether anthropogenic disturbances, such as forestry, affect foraging loads, independent of effects on the quality and distribution of resources. We asked if ants harvest greater loads from more distant and higher quality resources, how individual efforts scale to the colony level, and whether worker loads are affected by stand age.
Methods.First, we performed a fine-scale study examining the effect of distance and resource quality (tree diameter and species) on harvesting of honeydew by red wood ants,Formica aquilonia, in terms of crop load per worker ant and numbers of workers walking up and down each tree (ant activity) (study 1). Second, we modelled what the combination of load and worker number responses meant for colony-level foraging loads. Third, at a larger scale, we asked whether the relationship between worker load and resource quality and distance depended on stand age (study 2).
Results. Study 1 revealed that seventy percent of ants descending trees carried honeydew, and the percentage of workers that were honeydew harvesters was not related to tree species or diameter, but increased weakly with distance. Distance positively affected load mass in both studies 1 and 2, while diameter had weak negative effects on load. Relationships between load and distance and diameter did not differ among stands of different ages. Our model showed that colony-level loads declined much more rapidly with distance for small diameter than large diameter trees.
Discussion.We suggest that a negative relationship between diameter and honeydew load detected in study 1 might be a result of crowding on large diameter trees close to nests, while the increase in honeydew load with distance may result from resource depletion close to nests. At the colony level, our model suggests that very little honeydew was harvested from more distant trees if they were small, but that more distant larger trees continued to contribute substantially to colony harvest. Although forestry alters the activity and foraging success of red wood ants, study 2 showed that it does not alter the fundamental rules determining the allocation of foraging effort.
SubjectsAnimal Behavior, Ecology, Ecosystem Science, Entomology, Zoology
INTRODUCTION
Foraging efficiency is critical in determining the success of organisms. Our understanding of foraging efficiency has been shaped by theories of optimal foraging, whereby organisms are predicted to forage to maximise their energy intake per unit time (MacArthur & Pianka, 1966). Where animals return to a central place (e.g., a nest), central place foraging theory, in its original formulation, predicted that more valuable resources or larger loads would be harvested at greater distances from the central place (Orians & Pearson, 1979). This is because the energy expenditure of foragers is proportional to the distance travelled. Positive load-distance relationships have previously been observed in a range of taxa that act as central place foragers (Giraldeau & Kramer, 1982;Mellgren, Misasi & Brown, 1984; Kacelnik, Houston & Schmidhempel, 1986;Kaspari, 1991). However, more recent models of central place foraging suggest that observed positive load-distance relationships may represent a special case, where costs associated with greater travel time and resource loads, including missed opportunity, metabolic and predation risk costs, are negligible (Olsson, Brown & Helf, 2008). This may explain why some studies have failed to detect a positive load-distance relationship (e.g.,Wetterer, 1991). Alternatively, positive load-distance rela-tionships might also occur where resource quality or quantity increases with distance from nest (Olsson, Brown & Helf, 2008). This pattern might be expected if foraging activity results in resource depletion, a phenomenon that is particularly likely to be important for colonial organisms, such as ants.
As central place foragers, ants commonly show positive load-distance relationships in empirical studies. This pattern occurs frequently where workers control load size (leaf-cutting, Roces, 1990; e.g., liquid food harvesting,Bonser et al., 1998;Wright, Bonser & Chukwu, 2000), but is less prevalent where resource size is fixed (e.g., seeds,Rissing & Pol-lock, 1984;Holder & Polis, 1987). While this appears inconsistent with recent models, the in-crease in metabolic costs and predation risk with distance may be negligible for some species: metabolic costs do not increase substantially with foraging load for ants (Nielsen, Jensen & Holmjensen, 1982), energetic rewards are orders of magnitude higher than worker energetic expenditure (Baroni-Urbani & Nielsen, 1990), and increases in foraging speed with resource distance might minimise additional exposure to predation (Torres-Contreras & Vasquez, 2004). Further, the higher density of foraging workers close to colonies (De Vita, 1979; Savolainen & Vepsäläinen, 1988) suggests that resource depletion (exploitation competi-tion) or intra-colonial interference competition might drive individuals to forage at greater distances from the nest, where more desirable load sizes might be obtained (Wright, Bonser & Chukwu, 2000;Grüter et al., 2012). Positive load-distance relationships for social insects, such as ants, might therefore result from increases in resource quality and quantity with distance. However, positive load-distance relationships have also been ob-served in laboratory-based studies, where resource quality and quantity is tightly controlled (e.g.,Bonser et al., 1998).
both individual loads and the number of foragers active (Burd & Howard, 2005). This is because selection on eusocial organisms is expected to operate most strongly at the level of the colony as workers of most species are sterile (Bourke & Franks, 1995). This could occur through recruitment or other cues based on encounter densities and through size-dependent foraging behaviour in polymorphic species. Even in only moderately polymorphic or monomorphic species, larger ants travel greater distances to forage and they are more efficient, i.e., they are able to carry a greater load relative to their body weight (Her-bers & Cunningham, 1983;Rosengren & Sundström, 1987;McIver, 1991;McIver & Loomis, 1993;Burd, 1995;Wright, Bonser & Chukwu, 2000) (but seeRissing & Pollock, 1984). In addition to distance, the harvesting efficiency of ants is affected by a range of other factors, including resource quality, such as sucrose concentration, carbohydrate:protein ratio, resource quantity, temperature or crowding (Dreisig, 1988;Bonser et al., 1998;Cerda, Retana & Cros, 1998;Detrain et al., 2000;Kay, 2002;Segev et al., 2014).
Habitat structure plays a key role in determining the success of species (e.g.,Petren & Case, 1998;Stephens et al., 2004;Cushman, 2006), particularly ants (Lassau & Hochuli, 2004;Sorvari & Hakkarainen, 2004;Sarty, Abbott & Lester, 2006;Gibb & Parr, 2010). For example, larger ants are more successful competitors in structurally simple habitats, probably because they are faster to discover and exploit resources (Gibb & Parr, 2010). Anthropogenic disturbances, including urbanisation, agriculture and forestry, transform landscapes, significantly altering habitat structure (Harrison & Bruna, 1999; Gibb & Hochuli, 2002). For example, forestry practices in mid-boreal Sweden have resulted in a disproportionately large area of relatively young and dense stands, with structure differing substantially from old growth stands (Linder & Östlund, 1998). Previous studies suggest that stand age (a measure of time since disturbance or successional stage) and the associated structural differences have significant effects on the abundance and behaviour of ants (Punttila, 1996;Sorvari & Hakkarainen, 2004;Gibb & Johansson, 2010) and on resource quality (Johansson & Gibb, 2012). However, no previous study has tested whether succes-sional stage affects foraging loads of ants. We might expect differences because later suc-cessional stages are associated with increases in resource quality and quantity (Guariguata & Ostertag, 2001; Johansson & Gibb, 2012), ant density, inter-specific competition and predator richness (Niemelä, Haila & Punttila, 1996;Gibb, 2011).
MATERIALS AND METHODS
Ethics statement
This study complies with the current laws of Sweden. The forestry companies Holmen Skog AB, Sveaskog AB, SCA and Scaninge gave permission to use their land.
Study sites and species
This study was conducted in boreal forests in northern Sweden between the latitudes of 63.6◦N and 64.5◦N and longitudes of 19.7◦E and 20.7◦E. The forest was dominated by
Norway spruce,Picea abies(70–100%), while birches,Betula pubescensandBetula pendula, and Scots pine, Pinus silvestris,also occurred in significant numbers. The field layer consisted mainly of dwarf shrubs (Vaccinium spp.) and soils were moist and of the sandy moraine type. A detailed study of foraging loads was first conducted in a single mature pro-duction forest (study 1). The effect of stand age on forager loads was then examined using a further twelve stands (study 2): mature stands (n=4, tree age 80–100 years, non-sapling
mean basal diameter (BD)=30.3±1.6 cm, mean height (H)=17.9±0.6 m, mean stem
density (SD) = 1974 ±146 stems.ha−1), middle aged stands (n=4, 30–40 years,
BD=13.8±0.9 cm,H=8.1±0.3 m, SD=3,923±471 stems.ha−1) and clear cuts with
5–10 retention trees per ha (n=4, 1–4 years, BD=4.8±0.7 cm,H=2.1±0.3 m, SD= 942±50 stems.ha−1). Further details on site characteristics are provided inTable S1and
Gibb & Johansson, 2010, Appendix 1. Measures of basal diameter included all trees >1 cm BD. Basal diameter was used in preference to diameter at breast height so that seedlings, which may be shorter than 1.3 m in height, but also provide a food source to ants, could be included. Stands of different ages were geographically interspersed and each study plot supported several nests of the northern red wood ant,Formica aquilonia. Mean±SE stand
separation was 17.5±1.0 km.
F. aquiloniabelongs to the F. rufagroup, which consists of territorial behaviourally dominant ant species that have been reported to structure ant communities (Savolainen & Vepsalainen, 1989;Gibb, 2011;Gibb & Johansson, 2011). It has polygynous and polydomous colonies throughout its range (Pamilo, 1982) and is the most commonF. rufa group species in the central boreal region of Fennoscandia (Collingwood, 1979). In the study area, F. aquiloniais commonly observed climbing trees, where it tends the aphidsCinara pruinosa andC. piceicola(Johansson & Gibb, 2012) (aphids identified by R Danielsson, University of Lund and Nils Ericson, Umeå). A previous study showed that honeydew makes up approximately 80% of the diet ofF. aquiloniain Finland, with the remainder consisting of invertebrate prey (Domisch et al., 2009).
Study 1: Do ants adjust their foraging based on resource quality and distance?
through increases in the concentrations of some sugars, including fructose, melezitose and trehalose (Johansson & Gibb, 2012), and changes in secondary metabolites (Whitham, 1978; Price, 1991). Unpublished data from our study sites suggests that the composition of sugars and amino acids differs among honeydew samples collected fromP. abies,P. sylvestrisand Betula spp.Sampling was performed once at each site on fine days in July 2007 between 9:00 and 17:00. We selected 10 nests ofF. aquilonia(Mean±SE nest volume: 0.40±0.16)
in mature forest and located two spruce, one birch and one pine tree (basal diameter range: 9.5–48 cm) with high levels of ant activity within 20 m of each nest (thousands of workers active on and around the nest), with clear trails originating from the target nest. The distance from the nest and the basal diameter of each tree was measured and ambient temperatures were recorded for each tree at the time sampling commenced. Nests contained multiple entrance holes, so distances were measured from the centre of the nest. All nests were greater than 60 m from an edge with another habitat type and greater than 50 m from another nest. We used modified battery-driven vacuum cleaners with aspirators attached to collect 20 ants walking up and 20 ants walking down each of the trees (a total of 40 ants×10
nests×4 trees=1,600 ants). This method was selected as ants proved less likely to squirt
formic acid (and therefore lose weight) when removed using an aspirator than by forceps. The forty ants were collected from each tree in quick succession, irrespective of the tasks they were performing, but ants not travelling in a clear direction were avoided. For collected individuals, we recorded whether the ant was carrying anything (needles or leaves or arthro-pod prey) and its liquid feeding status. Liquid feeding status was assessed by examining the gaster of individuals and allocating them to the following classes: (1) full: arthrodial membrane stretched, such that the length of arthrodial membrane visible along the mid-line of the gaster was at least half of that of the sclerites; (2) half full: some stretching of the arthrodial membrane, but with the visible length less than half that of the sclerites; (3) empty: no visible stretching of the arthrodial membrane.
Ants were killed or subdued using ether in the field and were later frozen for three days at−20 ◦C. They were weighed in groups of twenty ants travelling in the same direction on
the same tree (tree was the replicate measure in this study and ants were weighed in bulk to improve accuracy). Any needles or prey items were removed before weighing. The total mass of ants was divided by twenty to obtain a mean mass per ant and the mean mass of the ‘‘Up’’ ants was subtracted from that of the ‘‘Down’’ ants to determine the average mass gain of ants on each tree.
Study 2: Are foraging loads of individuals affected by resource quality and stand age?
As described above, twelve spruce-dominated stands (4 mature, 4 middle-aged and 4 clear-cut) were used for this component of the study. To compare the mass of honeydew collected by individual ants in different stand ages, we collected ants moving up and down spruce trees between 9:00 and 17:00 on fine days in July 2008 using the methods described above. Temperatures varied from 11.3 to 27.9 ◦C during these surveys. Ten spruce trees (basal
nests were greater than 60 m from any edge with stands of a different age category. Trees with highF. aquiloniaactivity were preferred in order to reduce collection times. Using an aspirator, we collected five ants moving up and five ants moving down each of the ten trees at four sites belonging to each of the three stand ages for a total of 1,200 ants. We did not specifically select ants with laden and non-laden gasters because we aimed to compare harvesting loads per ant. Ants were placed in a cold box (approximately 5 ◦C) in the field
and were later frozen for 3 days at−20 ◦C to ensure that they were killed. Ants were weighed
individually (mass range: 2–21 mg) in the lab using a Mettler AE166 balance (sensitive to
±0.1 mg) and maximum head width (range: 1.03–2.06 mm) was measured using an
eyepiece micrometer on a Leica MS5 microscope. Any needles or prey items were removed before weighing.
Statistical analyses
For study 1, a pairedt-test on JMP (SAS-Institute, 2007) was used to compare the mean mass of ants walking up and down per tree. We used a general linear mixed model to test the effects of the fixed predictors temperature, tree species, diameter, log10 distance and
their interactions and the random predictor nest, on: (1) the mean mass gain per ant; and (2) the exponential-transformed percentage of individuals carrying discernible liquid loads. Preliminary analyses, where tree height+distance was used instead of distance gave
similar results to the final analyses and, as we were unsure how high up the tree aphids were located, we used distance to the tree base in all analyses. Distance was log10-transformed to
improve model fit. We tested all possible models on MuMin (Barton, 2011) in R (R Development Core Team, 2013) and, because there was no clear best model, we performed model averaging of models within 2 AICc of the best model to determine the relative importance of variables in the set of best models (Burnham & Anderson, 2002). We present the coefficients from the model-averaged model with shrinkage and the importance of each variable among the set of best models. Az-test was used to compare the slopes of the ant mass (mean per tree)—distance from nest relationship for: (1) ants walking up and; (2) ants walking down a tree.
We modelled the effect of distance from a nest and tree diameter on harvesting rates at the colony level using the parameters from the model-averaged model predicting mean mass gain per ant from study 1 (described above) and the best model predicting ant activity per minute at the study site, using data from a previous study (Gibb & Johansson, 2010). The rate of ant activity was determined by recording the number of ants crossing a line 10 cm from the base of the tree in one minute. To illustrate responses across a distribution of diameters typical of mature stands, we present results for trees of basal diameter 10, 25 and 40 cm. We used set values of 22 ◦C for temperature (the mean value during surveys) and
spruce for tree species (the most commonly occurring tree species) for the modelled data. Finally, for data from study 2, a general linear mixed model with head width as a covariate and site as a (random) blocking factor, was used to test the effect of temperature, stand age, distance (log10-transformed), diameter and their interactions on the mass of ants walking
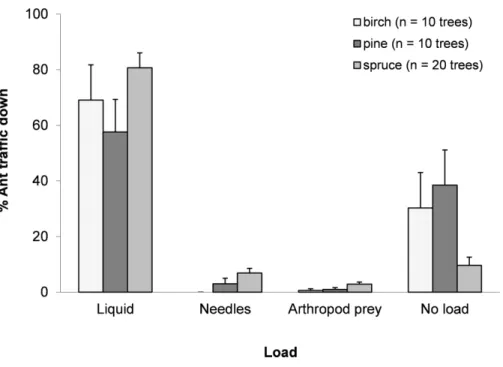
Figure 1 Mean±SE percentage of total trips for each resource collected.Ants collected honeydew, nee-dles, arthropod prey or nothing apparent for birch, pine and spruce.N=1,598 trips.
account for size-related load capacities of ants (Wright, Bonser & Chukwu, 2000). We again tested all possible models on MuMin and performed model averaging of models within 2 AICc of the best model to determine the relative importance of variables in the set of best models. We present the coefficients from the model-averaged model with shrinkage. We report both marginal (fixed effects;R2GLMM(m)) and conditional (fixed+random effects;
R2GLMM(c))R2values (Nakagawa & Schielzeth, 2013), calculated using the package MuMIn. We also used ANOVA on JMP to test the effect of stand age on microsite temperature.
RESULTS
Overview of ant loads
On average, ants walking up a tree weighed significantly less than those walking down (t(1,39)= −9.766,p<0.0001), gaining 2.11±0.19 mg (Mean±SE) in mass, or
approx-imately 33% of the average mass of an ant walking up the tree (up ants: 6.42±0.17 mg;
down ants: 8.53±0.27 mg). Observations of the loads carried by ants suggested that most
ants walking down a tree were carrying a discernible honeydew load (full or half full) (70.4
±4.9%). Although the mean weight gain for ants was 33%, not all ants carried honeydew
loads, indicating that ants with loads carried around 47% of their body weight. Among the collected ants, 8.0±4.0% carried nest material from trees, i.e., needles (birch leaves were
never taken) and 3.5±1.7% carried arthropod prey (mainly aphids and spiders) (Fig. 1).
Do ants adjust their foraging based on resource quality and distance?
Table 1 Estimates and importance (6wi) from model-averaged models for mass gain and liquid loads
at the site level.Models tested the effects of tree species, temperature, distance, basal diameter and their interactions on the mean mass gain and the percentage of individuals bearing liquid loads in their gasters. Random effects not shown.
Mass gain % Liquid bearers
Source Estimate (SE) 6wi Estimate (SE) 6wi
Intercept 3.00 (1.13) 1.64 (0.42)
Tree species (pine) 0.05 (0.26) 0.25 Tree species (spruce) −0.13 (0.30)
Temperature −0.03 (0.05) 0.30 0.01 (0.02) 0.31
Log10(distance) 0.52 (0.18) 1.00 0.07 (0.06) 0.75
Diameter −0.05 (0.02) 1.00
Figure 2 Contour plot showing the relationship between tree diameter, log10distance and mean mass
gain per ant for the small-scale study. Circles represent values for mass gain, ranging from−0.74 mg (smallest circles) to 2.11 mg (largest circles). Contour bin width is 0.5 mg.
(R2GLMM(m)=0.41,R2GLMM(c)=0.41) (Table 1). Mass gain was negatively, but weakly related to tree diameter, suggesting individual ants gained less on larger trees (Fig. 2). Mass gain was positively related to distance to nest, with ants travelling farther carrying heavier loads (Fig. 2). Tree species was of low importance in predicting mass gain. The model showed weaker predictive power for the percentage of workers carrying observable honeydew loads, with the random factor ‘nest’ contributing most to model fit (R2GLMM(m)=0.11,R2GLMM(c)= 0.49). The percentage of liquid bearers responded only weakly to distance, while tree species and diameter did not appear in any of the best models.
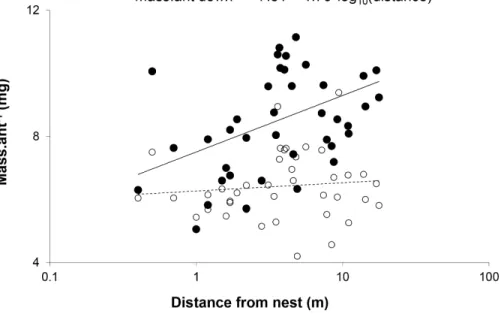
Figure 3 Mean mass per ant walking down ( ) and up () each of the trees plotted against distance from the nest.The slope for the relationship between weight and distance travelled was significant for ants walking down trees (F(1,38)=8.520,p=0.0059,R
2=0
.18), but not those walking up (F(1,38)=0.403,
p=0.5296,R2=0.01).X-scale is logarithmic.
The model incorporating the mass of honeydew harvested per ant (parameters inTable 1) and ant activity per tree suggests that the effect of distance from the colony on the mass gained by the colony at each tree depends on tree basal diameter (Fig. 4). Trees with larger diameters (40 cm) made relatively consistent contributions to mass gain, independent of distance (within 20 m from a colony), while the contribution of honeydew from smaller trees (diameter=10 cm) decreased with increasing distance from a colony. This is because mass
gain increased, while activity decreased with distance and activity increased, while mass gain decreased with diameter.
Are foraging loads of individuals affected by resource quality and stand age?
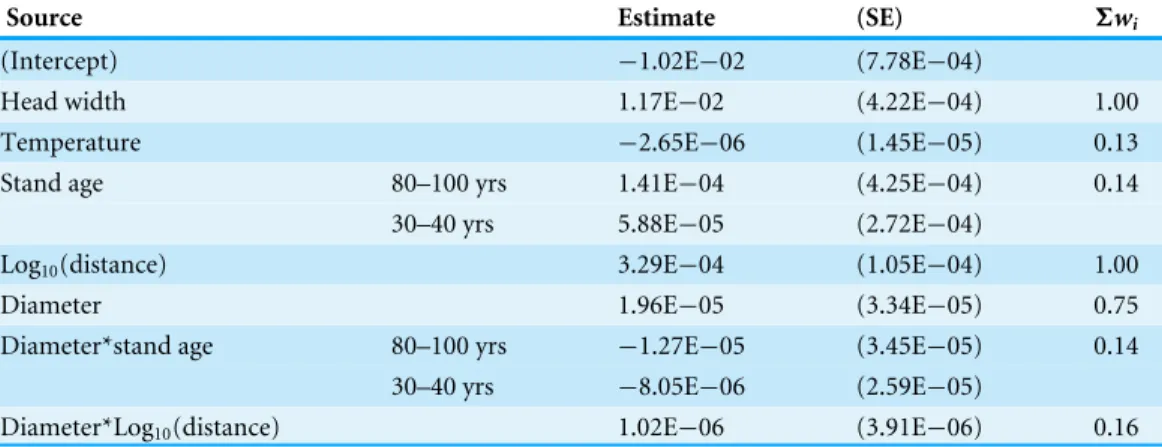
The model-averaged model testing the effects of head width, temperature, stand age, tree diameter, distance and their interactions on mass of ants walking down trees was a good fit to the data (R2
GLMM(m)=0.62,R2GLMM(c)=0.66). Interactions between stand age and distance
did not appear in the model. Stand age*diameter and distance*diameter interactions were included in the model, but had low importance (Table 2). The covariate ‘head width’ was an important predictor of worker mass, as expected. Consistent with survey 1, distance was positively related to the mass of workers walking down trees. In contrast to study 1, tree basal diameter had a positive effect on the mass of workers climbing down trees. How-ever, the importance of diameter was low in the model for study 2, suggesting a weak rela-tionship. Microsite temperatures measured during the surveys were not significantly higher at clear-cuts (mean ±SE: 19.2±2.1 ◦C) than mature (16.2±0.5 ◦C) or middle-aged
Figure 4 Model of the relationship between the mass of honeydew gained by the colony per minute and the distance of the tree from the nest at three different tree basal diameters (BD=10, 25 and 40 cm).The estimate was calculated by multiplying equations for mass gain per ant (Mass gain.ant−1 = 3
.82−0.05*Temperature+1.11*Log10(distance)−0.06*Diameter) by ant activity per
minute (Activity.min−1 = −16
.83+1.02*Temperature−2.18∗Log10(distance)+0.12*Diameter).
Calculations were made for spruce trees in mature forests at 22 ◦C.
Table 2 Estimates and importance (6wi) from model-averaged models for worker mass across stands.
Models tested the effects of stand age, temperature, distance, basal diameter and their interactions on the mass of workers climbing down trees. Random effects are not shown.
Source Estimate (SE) 6wi
(Intercept) −1.02E−02 (7.78E−04)
Head width 1.17E−02 (4.22E−04) 1.00
Temperature −2.65E−06 (1.45E−05) 0.13
Stand age 80–100 yrs 1.41E−04 (4.25E−04) 0.14
30–40 yrs 5.88E−05 (2.72E−04)
Log10(distance) 3.29E−04 (1.05E−04) 1.00
Diameter 1.96E−05 (3.34E−05) 0.75
Diameter*stand age 80–100 yrs −1.27E−05 (3.45E−05) 0.14 30–40 yrs −8.05E−06 (2.59E−05)
DISCUSSION
Resource harvesting
A high percentage of ants walking down trees (approximately 70%) appeared to be carrying honeydew in their gasters, suggesting that this was their main task in climbing trees. This is as expected as honeydew constitutes 78–92% of the diet of wood ants (Domisch et al., 2009). Of the 30% of ants for which no discernible stretching of the gaster was observed, it is possible that many were involved in other activities, such as guarding resources, or that they had collected much smaller volumes of honeydew. Smaller percentages of ants returning from trees collected arthropod prey and nest material. While it might appear opportune to collect arthropod prey if encountered in the canopy, the collection of nest material from such a height and in trees up to 14 m from the nest was unexpected. Ants collecting needles from pine or spruce canopies in older forests travel considerably farther than would appear necessary, given that needles are abundant on the forest floor. A possible explanation is that needle quality is better if needles are removed directly from the tree, perhaps because micro-organism activity is lower on such needles. The lower carbon to nitrogen ratio of needles found on ant mounds, relative to those found on the forest floor (Kilpeläinen et al., 2007), suggests that harvesting of needles from the canopy may be common practice for F. aquilonia. However, further sampling is required to properly address this supposition.
Do ants adjust their foraging based on distance?
The distance travelled positively affected the load collected by ants. Given that modern formulations of central place foraging theory do not support a positive load-distance relationship (Olsson, Brown & Helf, 2008), a likely explanation for the observed positive load-distance relationship is that high activity of ants on trees near mounds might lead to crowding and faster turnover of workers feeding from aphids, resulting in smaller loads as a consequence of reduced time spent harvesting due to physical interference (defence) or overexploitation of the resource (Sundström, 1993;Wright, Bonser & Chukwu, 2000;Grüter et al., 2012). Such a density-dependent response could also explain our finding that, al-though ants were more active on large-diameter trees, they harvested less honeydew. This is further supported by the appearance of distance as an important predictor of the percentage of individuals with liquid loads among the best models (Table 1), indicating more workers engaged in tasks other than harvesting at trees closer to the nest. Engagement in other tasks (e.g.,Novgorodova, 2015) might also explain the slightly lower colony mass gain for trees within a few metres of the nest (Fig. 4).
Do ants adjust their foraging based on resource quality?
Animals are expected to allocate more effort to harvesting resources of higher quality (optimal foraging theory,MacArthur & Pianka, 1966). Individual honeydew loads did not differ among tree species, despite differences in sugar composition (T Johansson, 2008, unpublished data). In contrast, ants in mature forest responded to trees differing in diameter as though they differed in quality, harvesting more from small-diameter trees. Dif-ferences between small- and large-diameter trees in the mature forest may reflect difDif-ferences in the quality of honeydew as a result of changes in tree defence against aphid herbivory with age. Vigorous and/or fast growing plants usually have fewer secondary metabolites and are therefore often preferred by herbivores, including aphids (Whitham, 1978; Price, Roininen & Tahvanainen, 1987;Price, 1991). However,Johansson & Gibb (2012) showed that spruce trees in mature forest, which tend to be of larger diameter, have a greater concentration of some sugars attractive to ants than young trees regenerating in clear-cuts. This suggests that sugar quality may actually be higher in large-diameter trees, so resource quality is unlikely to be a driver of this difference.
Despite the smaller individual loads harvested from larger trees, colonies allocated more workers to large trees. Models showed that the net result of opposing allocation of worker activity and individual loads was that, close to the nest, a similar mass of honeydew was harvested from small and large trees (Fig. 4). However, further from the nest, larger hon-eydew loads from smaller trees did not compensate for the greater activity on larger trees. Thus, the colony-level mass gain from large trees remained relatively constant with distance, while the mass gain from smaller trees declined rapidly.
At the colony level, a decline in selection of smaller trees with distance might occur if small trees act as small resource patches. This is in agreement with previous studies that have shown greater recruitment to better quality (or larger) resource patches (Taylor, 1977;Nonacs & Dill, 1991). However, another possible explanation for the rapid decline in use of small trees with distance may be related to the limitations of ant navigation, which, forFormica spp., is largely dependent on memorising the location of landmarks (Graham & Collett, 2002;Fukushi & Wehner, 2004). Larger trees may therefore present a clearer image for visual memory, although the panorama, rather than individual features, may be critical for navigation (Collett, 2009). Alternatively, foraging paths can be costly to maintain in com-plex habitats (Shepherd, 1982) and the low rate of return of workers from small trees may be insufficient to sustain recruitment (Pinter-Wollman et al., 2013), so resources available from smaller trees may fall below the threshold under which trail maintenance is efficient.
Is foraging load affected by stand age?
stand age, such as time since disturbance, competition or predation are not important in determining foraging load. Previous studies suggest foraging behaviours of ants and other species are often affected by anthropogenic disturbances (Mahan & Yahner, 1999;Goverde et al., 2002;Sorvari & Hakkarainen, 2004). However, changes in behaviour may reflect attempts by individuals to maximise foraging loads in the new environment, so may not alter this fundamental relationship.
Conclusions
Our findings suggest that mostF. aquiloniaworkers observed on trees are engaged in honey-dew harvesting. Distance had a clear positive effect on worker loads. However, for both dis-tance and diameter, worker activity declined as loads increased, indicating a role for crowd-ing in reduccrowd-ing colony-level efficiency (Dreisig, 1988;Grüter et al., 2012). Load-distance relationships were consistent across stands of different ages, suggesting no effect of stand age on this fundamental response, despite effects of stand age on activity and honeydew quality (Gibb & Johansson, 2010;Johansson & Gibb, 2012). This is in contrast with findings suggesting effects of anthropogenic disturbances on a range of behavioural responses. However, changes in behaviour may often occur to improve foraging loads or nesting success. Behavioural changes in responses to disturbance may thus tend to be consistent with maximising foraging loads if they are within the evolutionary experience of a species.
ACKNOWLEDGEMENTS
We would like to thank Åke Nordström and Ylva Nordström for invaluable assistance in the field.
ADDITIONAL INFORMATION AND DECLARATIONS
Funding
Funding for this project was provided by Formas (the Swedish Research Council 2005-3012-3674-25) and Lilla Fonden (the Swedish University of Agricultural Sciences). The funders had no role in study design, data collection and analysis, decision to publish, or preparation of the manuscript.
Grant Disclosures
The following grant information was disclosed by the authors: the Swedish Research Council: 2005-3012-3674-25.
the Swedish University of Agricultural Sciences.
Competing Interests
The authors declare there are no competing interests.
Author Contributions
• Heloise Gibb conceived and designed the experiments, performed the experiments,
analyzed the data, wrote the paper, prepared figures and/or tables.
• Jon Andersson and Therese Johansson performed the experiments, reviewed drafts of
Field Study Permissions
The following information was supplied relating to field study approvals (i.e., approving body and any reference numbers):
This study complies with the current laws of Sweden. The forestry companies Holmen Skog AB, Sveaskog AB, SCA and Scaninge gave permission to use their land.
Data Availability
The following information was supplied regarding data availability: The raw data is available asData S1.
Supplemental Information
Supplemental information for this article can be found online athttp://dx.doi.org/10.7717/
peerj.2049#supplemental-information.
REFERENCES
Baroni-Urbani C, Nielsen MG. 1990.Energetics and foraging behavior of the European seed harvesting antMessor capitatus2. Do ants optimize their harvesting. Physiologi-cal Entomology 15:449–461DOI 10.1111/j.1365-3032.1990.tb00534.x.
Barton K. 2011.MuMIn: multi-model inference. R package version 1.0.0. Vienna: R Foundation for Statistical Computing.Available athttps:// cran.r-project.org/ package=MuMIn.
Bonser R, Wright PJ, Bament S, Chukwu UO. 1998.Optimal patch use by foraging workers ofLasius fuliginosus,L. nigerandMyrmica ruginodis.Ecological Entomology
23:15–21DOI 10.1046/j.1365-2311.1998.00103.x.
Bourke AFG, Franks NR. 1995.Social evolution in ants. Princeton: Princeton University Press.
Burd M. 1995.Variable load size ant size matching in leaf-cutting ants,Atta colombica (Hymenoptera, Formicidae).Journal of Insect Behavior8:715–722
DOI 10.1007/BF01997240.
Burd M, Howard JJ. 2005.Global optimization from suboptimal parts: foraging sensu lato by leaf-cutting ants.Behavioral Ecology and Sociobiology59:234–242
DOI 10.1007/s00265-005-0029-4.
Burnham KP, Anderson DR. 2002.Model selection and multimodel inference: a practical information-theoretic approach. New York: Springer-Verlag.
Cerda X, Retana J, Cros S. 1998.Critical thermal limits in Mediterranean ant species: trade-off between mortality risk and foraging performance.Functional Ecology
12:45–55DOI 10.1046/j.1365-2435.1998.00160.x.
Collett M. 2009.Spatial memories in insects.Current Biology19:R1103–R1108
DOI 10.1016/j.cub.2009.10.004.
Collingwood CA. 1979.The Formicidae (Hymenoptera) of Fennoscandia and Denmark). Klampenborg: Scandinavian Science Press.
Cushman SA. 2006.Effects of habitat loss and fragmentation on amphibians: a review and prospectus.Biological Conservation128:231–240
Detrain C, Tasse O, Versaen M, Pasteels J. 2000.A field assessment of optimal foraging in ants: trail patterns and seed retrieval by the European harvester antMessor barbarus.Insectes Sociaux47:56–62DOI 10.1007/s000400050009.
De Vita J. 1979.Mechanisms of interference and foraging among colonies of the harvester antPogonomyrmex californicusin the Mojave Desert.Ecology 60:729–737
DOI 10.2307/1936610.
Domisch T, Finér L, Neuvonen S, Niemelä P, Risch AC, Kilpeläinen J, Ohashi M, Jurgensen MF. 2009.Foraging activity and dietary spectrum of wood ants (Formica rufagroup) and their role in nutrient fluxes in boreal forests.Ecological Entomology
34:369–377DOI 10.1111/j.1365-2311.2009.01086.x.
Douglas AE. 1993.The nutritional quality of phloem sap utilized by natural aphid popu-lations.Ecological Entomology18:31–38DOI 10.1111/j.1365-2311.1993.tb01076.x.
Dreisig H. 1988.Foraging rate of ants collecting honeydew or extrafloral nectar, and some possible constraints.Ecological Entomology13:143–154
DOI 10.1111/j.1365-2311.1988.tb00342.x.
Fukushi T, Wehner R. 2004.Navigation in wood antsFormica japonica: context dependent use of landmarks.Journal of Experimental Biology207:3431–3439
DOI 10.1242/jeb.01159.
Gibb H. 2011.Experimental evidence for mediation of competition by habitat succession. Ecology 92:1871–1878DOI 10.1890/10-2363.1.
Gibb H, Hochuli DF. 2002.Habitat fragmentation in an urban environment: large and small fragments support different arthropod assemblages.Biological Conservation
106:91–100 DOI 10.1016/S0006-3207(01)00232-4.
Gibb H, Johansson T. 2010.Forest succession and harvesting of hemipteran honeydew by boreal ants.Annales Zoologici Fennici47:99–110DOI 10.5735/086.047.0203.
Gibb H, Johansson T. 2011.Field tests of interspecific competition in ant assemblages: revisiting the dominant red wood ant.Journal of Animal Ecology80:548–557
DOI 10.1111/j.1365-2656.2010.01794.x.
Gibb H, Parr CL. 2010.How does habitat complexity affect ant foraging success? A test of functional responses on three continents.Oecologia164:1061–1073
DOI 10.1007/s00442-010-1703-4.
Giraldeau LA, Kramer DL. 1982.The marginal value theorem—a quantitative test using load size variation in a central place forager, the eastern chipmunk,Tamias striatus. Animal Behaviour30:1036–1042DOI 10.1016/S0003-3472(82)80193-0.
Goverde M, Schweizer K, Baur B, Erhardt A. 2002.Small-scale habitat fragmentation effects on pollinator behaviour: experimental evidence from the bumblebee Bombus veteranuson calcareous grasslands.Biological Conservation104:293–299
DOI 10.1016/S0006-3207(01)00194-X.
Grüter C, Schurch R, Czaczkes TJ, Taylor K, Durance T, Jones SM, Ratnieks FLW. 2012.Negative feedback enables fast and flexible collective decision-making in ants. PLoS ONE7:e44501DOI 10.1371/journal.pone.0044501.
Guariguata MR, Ostertag R. 2001.Neotropical secondary forest succession: changes in structural and functional characteristics.Forest Ecology and Management
148:185–206DOI 10.1016/S0378-1127(00)00535-1.
Harrison S, Bruna E. 1999.Habitat fragmentation and large-scale conservation: what do we know for sure?Ecography22:225–232DOI 10.1111/j.1600-0587.1999.tb00496.x.
Herbers JM, Cunningham M. 1983.Social organization inLeptothorax longispinosus Mayr.Animal Behaviour31:759–771DOI 10.1016/S0003-3472(83)80233-4.
Holder K, Polis G. 1987.Optimal and central-place foraging theory applied to a desert harvester ant,Pogonomyrmex californicus.Oecologia72:440–448
DOI 10.1007/BF00377577.
Johansson T, Gibb H. 2012.Forestry alters foraging efficiency and crop contents of aphid-tending red wood ants,Formica aquilonia.PLoS ONE7:e32817
DOI 10.1371/journal.pone.0032817.
Kacelnik A, Houston AI, Schmidhempel P. 1986.Central-place foraging in honey bees—the effect of travel time and nectar flow on crop filling.Behavioral Ecology and Sociobiology19:19–24DOI 10.1007/BF00303838.
Kaspari M. 1991.Central place foraging in grasshopper sparrows—opportunism or opti-mal foraging in a variable environment.Oikos60:307–312 DOI 10.2307/3545072.
Kay A. 2002.Applying optimal foraging theory to assess nutrient availability ratios for ants.Ecology83:1935–1944
DOI 10.1890/0012-9658(2002)083[1935:AOFTTA]2.0.CO;2.
Kilpeläinen J, Finer L, Niemela P, Domisch T, Neuvonen S, Ohashi M, Risch AC, Sundström L. 2007.Carbon, Nitrogen and Phosphorus dynamics of ant mounds (Formica rufagroup) in managed boreal forests of different successional stages. Applied Soil Ecology36:156–163DOI 10.1016/j.apsoil.2007.01.005.
Lassau SA, Hochuli DF. 2004.Effects of habitat complexity on ant assemblages. Ecogra-phy 27:157–164DOI 10.1111/j.0906-7590.2004.03675.x.
Linder P, Östlund L. 1998.Structural changes in three mid-boreal Swedish forest land-scapes, 1885–1996.Biological Conservation85:9–19
DOI 10.1016/S0006-3207(97)00168-7.
MacArthur RH, Pianka ER. 1966.On optimal use of a patchy environment.American Naturalist 100:603–609DOI 10.1086/282454.
Mahan CG, Yahner RH. 1999.Effects of forest fragmentation on behaviour patterns in the eastern chipmunk (Tamias striatus).Canadian Journal of Zoology77:1991–1997
DOI 10.1139/z99-174.
McIver JD. 1991.Dispersed central place foraging in Australian meat ants.Insectes Sociaux 38:129–138DOI 10.1007/BF01240963.
McIver JD, Loomis C. 1993.A size-distance relation in Homoptera-tending thatch ants (Formica obscuripes,Formica planipilis).Insectes Sociaux40:207–218
Mellgren RL, Misasi L, Brown SW. 1984.Optimal foraging theory—prey density and travel requirements inRattus norvegicus.Journal of Comparative Psychology
98:142–153DOI 10.1037/0735-7036.98.2.142.
Nakagawa S, Schielzeth H. 2013.A general and simple method for obtaining R2 from generalized linear mixed-effects models.Methods in Ecology and Evolution4:133–142
DOI 10.1111/j.2041-210x.2012.00261.x.
Nielsen MG, Jensen TF, Holmjensen I. 1982.Effect of load carriage on the respiratory metabolism of running worker ants ofCamponotus herculeanus(Formicidae).Oikos
39:137–142DOI 10.2307/3544477.
Niemelä J, Haila Y, Punttila P. 1996.The importance of small-scale heterogeneity in boreal forest: variation in diversity in forest-floor invertebrates across the success gradient.Ecography19:352–368DOI 10.1111/j.1600-0587.1996.tb01264.x.
Nonacs P, Dill LM. 1991.Mortality risk versus food quality trade-offs in ants—patch use over time.Ecological Entomology 16:73–80DOI 10.1111/j.1365-2311.1991.tb00194.x.
Novgorodova TA. 2015.Organization of honeydew collection by foragers of different species of ants (Hymenoptera: Formicidae): effect of colony size and species
specificity.European Journal of Entomology112:688–697DOI 10.14411/eje.2015.077.
Olsson O, Brown JS, Helf KL. 2008.A guide to central place effects in foraging. Theoreti-cal Population Biology74:22–33DOI 10.1016/j.tpb.2008.04.005.
Orians GH, Pearson NE. 1979. On the theory of central place foraging. In: Horn DJ, Mitchell R, Stair GR, eds.Analysis of ecological systems. Columbus: Ohio State University Press, 155–177.
Pamilo P. 1982.Genetic population structure in polygynousFormica ants.Heredity
48:95–106 DOI 10.1038/hdy.1982.10.
Petren K, Case TJ. 1998.Habitat structure determines competition intensity and invasion success in gecko lizards.Proceedings of the National Academy of Sciences of the United States of America95:11739–11744DOI 10.1073/pnas.95.20.11739.
Pinter-Wollman N, Bala A, Merrell A, Queirolo J, Stumpe MC, Holmes S, Gordon DM. 2013.Harvester ants use interactions to regulate forager activation and availability. Animal Behaviour86:197–207DOI 10.1016/j.anbehav.2013.05.012.
Price PW. 1991.The plant vigor hypothesis and herbivore attack.Oikos62:244–251
DOI 10.2307/3545270.
Price PW, Roininen H, Tahvanainen J. 1987.Plant-age and attack by the bud galler, euura-mucronata.Oecologia73:334–337DOI 10.1007/BF00385248.
Punttila P. 1996.Succession, forest fragmentation, and the distribution of wood ants. Oikos75:291–298DOI 10.2307/3546252.
R Development Core Team. 2013.R: a language and environment for statistical comput-ing. Vienna: R Foundation for Statistical Computing.Available athttps:// www.r-project.org/.
Roces F. 1990.Leaf-cutting ants cut fragment sizes in relation to the distance from the nest.Animal Behaviour40:1181–1183DOI 10.1016/S0003-3472(05)80185-X.
Rosengren R, Sundström L. 1987. The foraging system of a red wood ant colony (Formica s. str.)—collecting and defending food through an extended phenotype. In: Pasteels JM, Deneuberg JL, eds.From individual to collective behaviour in social insects. Basel: Birkhäuser Verlag, 117–139.
Sarty M, Abbott KL, Lester PJ. 2006.Habitat complexity facilitates coexistence in a tropical ant community.Oecologia149:465–473DOI 10.1007/s00442-006-0453-9.
SAS-Institute. 2007.JMP 7. Cary, N.C.
Savolainen R, Vepsäläinen K. 1988.A competition hierarchy among boreal ants: impact on resource partitioning and community structure.Oikos51:135–155
DOI 10.2307/3565636.
Savolainen R, Vepsalainen K. 1989.Niche differentiation of ant species within territories of the wood antFormica polyctena.Oikos56:3–16DOI 10.2307/3566082.
Segev U, Tielboerger K, Lubin Y, Kigel J. 2014.Consequences of climate and body size on the foraging performance of seed-eating ants.Ecological Entomology 39:427–435
DOI 10.1111/een.12115.
Shepherd JD. 1982.Trunk trails and the searching strategy of a leaf-cutter ant,Atta colombica.Behavioral Ecology and Sociobiology11:77–84DOI 10.1007/BF00300095.
Sorvari J, Hakkarainen H. 2004.Habitat-related aggressive behaviour between neigh-bouring colonies of the polydomous wood antFormica aquilonia.Animal Behaviour
67:151–153DOI 10.1016/j.anbehav.2003.03.009.
Stephens SE, Koons DN, Rotella JJ, Willey DW. 2004.Effects of habitat fragmentation on avian nesting success: a review of the evidence at multiple spatial scales.Biological Conservation115:101–110DOI 10.1016/S0006-3207(03)00098-3.
Sundström L. 1993.Foraging responses ofFormica truncorum(Hymenoptera, Formicidae)—exploiting stable vs spatially and temporally variable resources. Insectes Sociaux40:147–161DOI 10.1007/BF01240703.
Taylor B. 1977.Ant mosaic on cocoa and other tree crops in western Nigeria.Ecological Entomology2:245–255DOI 10.1111/j.1365-2311.1977.tb00887.x.
Torres-Contreras H, Vasquez RA. 2004.A field experiment on the influence of load transportation and patch distance on the locomotion velocity of Do-rymyrmex goetschi(Hymenoptera, Formicidae).Insectes Sociaux51:265–270
DOI 10.1007/s00040-004-0737-1.
Wetterer JK. 1991.Allometry and the geometry of leaf-cutting inAtta cephalotes. Behavioral Ecology and Sociobiology29:347–351 DOI 10.1007/BF00165959.
Whitham TG. 1978.Habitat selection byPemphigusaphids in response to resource limitation and competition.Ecology59:1164–1176DOI 10.2307/1938230.
Wright PJ, Bonser R, Chukwu UO. 2000.The size-distance relationship in the wood ant Formica rufa.Ecological Entomology25:226–233