Comprehensive Analysis of Temporal
Alterations in Cellular Proteome of
Bacillus
subtilis
under Curcumin Treatment
Panga Jaipal Reddy1, Sneha Sinha1, Sandipan Ray1, Gajanan J. Sathe3,4,
Aditi Chatterjee3,4, T. S. Keshava Prasad3, Snigdha Dhali2, Rapole Srikanth2, Dulal Panda1, Sanjeeva Srivastava1*
1Department of Biosciences and Bioengineering, Indian Institute of Technology Bombay, Powai, Mumbai, India,2Proteomics Laboratory, National Centre for Cell Science, Ganeshkhind, Pune, Maharashtra, India, 3Institute of Bioinformatics, International Tech Park, Whitefield, Bangalore, India,4Manipal University, Madhav Nagar,Manipal, India
Abstract
Curcumin is a natural dietary compound with antimicrobial activity against various gram positive and negative bacteria. This study aims to investigate the proteome level alterations inBacillus subtilisdue to curcumin treatment and identification of its molecular/cellular tar-gets to understand the mechanism of action. We have performed a comprehensive proteo-mic analysis ofB.subtilisAH75 strain at different time intervals of curcumin treatment (20, 60 and 120 min after the drug exposure, three replicates) to compare the protein expression profiles using two complementary quantitative proteomic techniques, 2D-DIGE and iTRAQ. To the best of our knowledge, this is the first comprehensive longitudinal investigation de-scribing the effect of curcumin treatment onB.subtilisproteome. The proteomics analysis revealed several interesting targets such UDP-N-acetylglucosamine 1-carboxyvinyltrans-ferase 1, putative septation protein SpoVG and ATP-dependent Clp protease proteolytic subunit. Further,in silicopathway analysis using DAVID and KOBAS has revealed modula-tion of pathways related to the fatty acid metabolism and cell wall synthesis, which are cru-cial for cell viability. Our findings revealed that curcumin treatment lead to inhibition of the cell wall and fatty acid synthesis in addition to differential expression of many crucial pro-teins involved in modulation of bacterial metabolism. Findings obtained from proteomics analysis were further validated using 5-cyano-2,3-ditolyl tetrazolium chloride (CTC) assay for respiratory activity, resazurin assay for metabolic activity and membrane integrity assay by potassium and inorganic phosphate leakage measurement. The gene expression analy-sis of selected cell wall biosyntheanaly-sis enzymes has strengthened the proteomics findings and indicated the major effect of curcumin on cell division.
OPEN ACCESS
Citation:Reddy PJ, Sinha S, Ray S, Sathe GJ, Chatterjee A, Prasad TSK, et al. (2015) Comprehensive Analysis of Temporal Alterations in Cellular Proteome ofBacillus subtilisunder Curcumin Treatment. PLoS ONE 10(4): e0120620. doi:10.1371/ journal.pone.0120620
Academic Editor:Fatah Kashanchi, George Mason University, UNITED STATES
Received:June 9, 2014
Accepted:February 5, 2015
Published:April 14, 2015
Copyright:© 2015 Reddy et al. This is an open access article distributed under the terms of the
Creative Commons Attribution License, which permits unrestricted use, distribution, and reproduction in any medium, provided the original author and source are credited.
Data Availability Statement:All relevant data are within the paper and its Supporting Information files.
Funding:This work was supported by a start-up grant 09IRCC007 from the IIT Bombay to Sanjeeva Srivastava and grant from Department of Science and Technology, Government of India to Dulal Panda. The funders had no role in study design, data collection and analysis, decision to publish, or preparation of the manuscript.
Introduction
In spite of worldwide initiatives for the development of a plethora of synthetic and semi-syn-thetic drugs, emerging drug resistance is still remained as one of the foremost health problems and poses challenges for thriving combat against most of the pathogenic infections [1]. Conse-quently, there is a growing need for the identification and characterization of new potential drugs from natural and synthetic compounds. Natural products have continued to evolve over thousands of years to counter various pathogenic microbes. Even today, most of the existing antibiotics are derived from the backbone of different natural compounds [2].B.subtilisis a widely studied non-pathogenic gram-positive bacterium, which is often used as a model organ-ism for diverse cellular and molecular level studies due to its genetic amenability, availability of complete genome sequence, and easy isolation and culturing procedure.
Curcumin, chemically known as 1,7-bis-(4-hydroxy-3-methoxyphenyl)-1,6-heptadiene-3,5-dione, is a naturally occurring phytochemical obtained from the rhizome ofCurcuma longa. It is the polyphenolic traditional turmeric powder, which is widely used as a dietary component. Curcumin has anti-tumor [3], anti-oxidant [4], anti-inflammatory [5], anti-geno-toxic against the DNA damaging agents [6], phototoxic and photodynamic therapy [7,8], it blocks the cell cycle progression in cancer cells [9] and prevents angiogenesis [10]. Curcumin also possess anti-microbial activity against gram positive and negative bacteria and shows syn-ergetic effects on other drugs in combination therapies [11]. Although, the diverse therapeutic potential of curcumin has been established, its precise mechanism of action and molecular tar-gets in prokaryotic system are mostly obscure. Recently, shikimate pathway, which is essential for aromatic amino acid synthesis has been reported to be a possible targets of curcumin in
Helicobacter pylori[11]. Interestingly, another study indicates that curcumin can effectively perturb the FtsZ assembly dynamics leading to elongation of the bacterial cell length and re-duce the viability [12].
Results
Effect of Curcumin on
B
.
subtilis
Growth and Cell Morphology
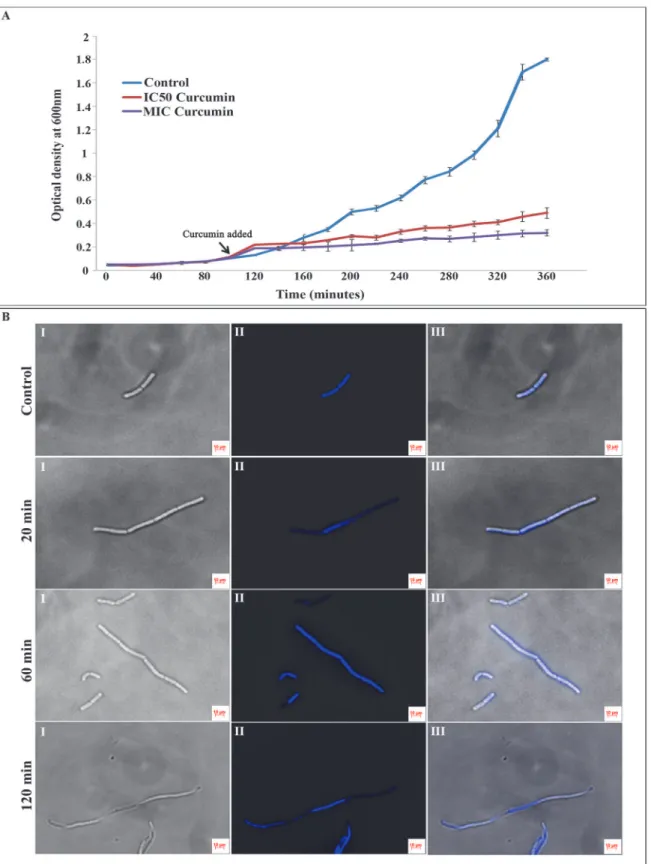
B.subtilisgrowth was measured by calculating the OD600in the presence and absence of the
curcumin in three technical replicates (n = 3). The changes in growth pattern for 4 hrs after the addition of the IC50(20μM) and MIC concentration (100μM) of the drug have been depicted
in theFig 1A. The growth of the cells treated with 20μM of curcumin (IC50) was significantly
declined; whereas cultures treated with 100μM of curcumin (MIC) showed virtually no growth
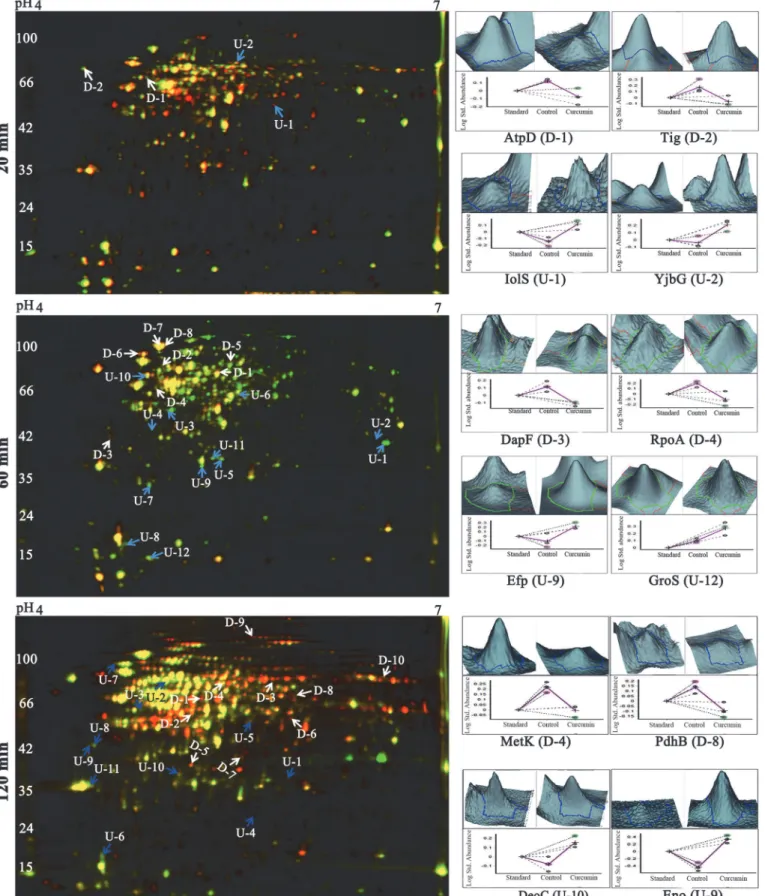
compared to the untreated controls, clearly indicating the antibacterial activity of curcumin againstB.subtilis(Figs 1AandS1A). The comparison of control with and without DMSO indi-cated no significant change in growth patterns (S1A Fig). Further, the morphological changes inB.subtiliscells in response to curcumin treatment were investigated using fluorescent mi-croscopy. UntreatedB.subtiliscells (with and without DMSO) showed typical cell morphology with normal size under fluorescent microscopy with single or two nucleoids per cell. Whereas, curcumin (IC50-20μM) treatedB.subtiliscells (20, 60 and 120 min) exhibited significant
alter-ations in cell morphology; filamentous phenotype with multiple nucleoids per cell and a drastic increase in cell length proportionally with the exposure time of the drug (Figs 1BandS1B).
Effect of Curcumin Treatment on
B
.
subtilis
Proteome Identified in
2D-DIGE and MALDI-TOF/TOF MS Analysis
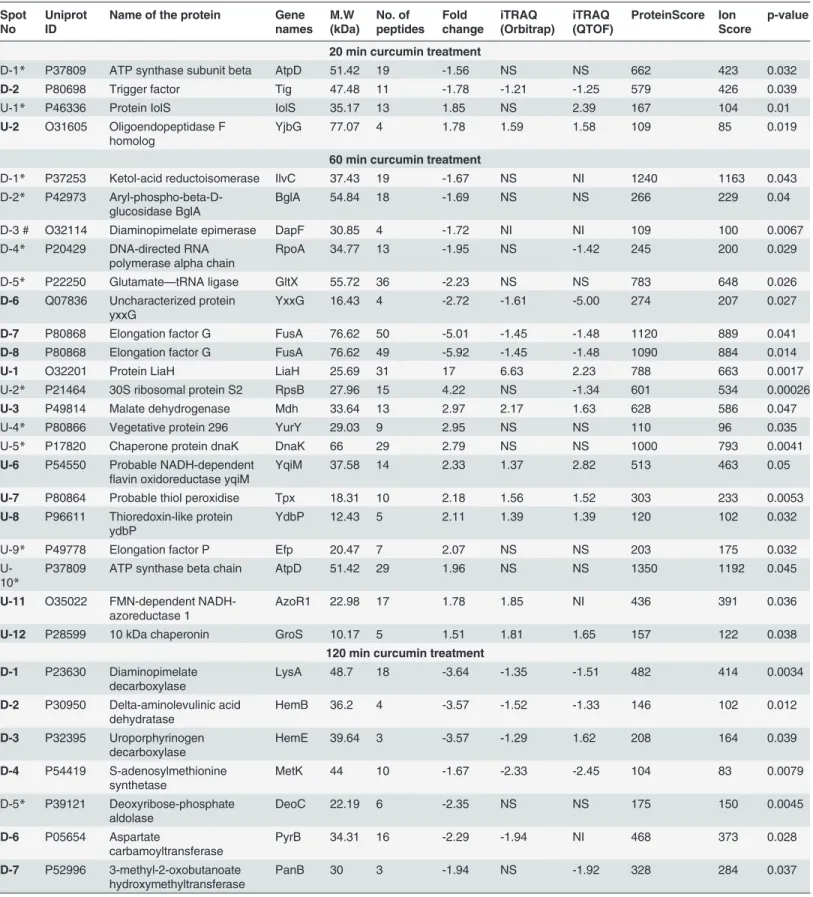
Comparative analysis of control and curcumin treated [after immediate (20 min), intermediate (60 min) and long treatment (120 min)] was performed by using 2D-DIGE, Nearly, 2000 pro-tein spots were identified in DIA module of DeCyder software (GE Healthcare). Three sets of analysis i.e. controlvs. 20 min, controlvs. 60 min and controlvs. 120 min were performed sepa-rately. Analysis of set-1 (controlvs. 20 min treated) revealed differential expression of 4 protein spots with statistical significance (p0.05); among which 2 spots showed up-regulation and 2 spots were down-regulated. Set-II analysis (controlvs. 60 min) exhibited differential expression of 20 protein spots; among which 12 spots were up-regulated and 8 protein spots found to be down-regulated. While the analysis of set-III (controlvs. 120 min treated) revealed differential expression of 21 protein spots, among which 10 spots were down-regulated and 11 spots were up-regulated. Representative combined DIGE image, 3D and BVA graph views of selected dif-ferentially expressed protein spots are displayed in theFig 2andS2 Fig. In 2D-DIGE analysis (DeCyder, GE Heathcare), only the statistically significant (p0.05; t-test and one way ANOVA) differentially expressed (fold-change>1.5) proteins spots were considered for
sub-sequent MALDI-TOF/TOF protein identification. All the protein spots showing differential ex-pression in 2D-DIGE from all the three time points were excised from a preparative gel stained with CBB and subjected to MS identification. MALDI-TOF/TOF MS and MS/MS analysis suc-cessfully established the identity of 4 proteins in 20 min, 20 proteins in 60 min and 21 proteins in 120 min analysis (Table 1&S1 Table). Among these differentially expressed proteins, ATP synthase subunit beta was common between 20 and 60 min and DNA-directed RNA polymer-ase alpha chain protein was common between 60 and 120 min.
Effect of Curcumin Treatment on
B
.
subtilis
Proteome Revealed by
iTRAQ-based Quantitative Proteomics Analysis
Fig 1. Effect of curcumin treatment on theB.subtilisAH75 growth and cell morphology. (A)B.subtilisAH75 strain was grown in LB media having spectinomycin antibiotic (100μg/mL) till the OD600reached to 0.1. Then the cultures were treated with DMSO (control), 20μM (IC50concentration) and
100μM (MIC concentration) curcumin. Growth curve was plotted by measuring the OD600for all the samples at every 20 min interval till 360 min
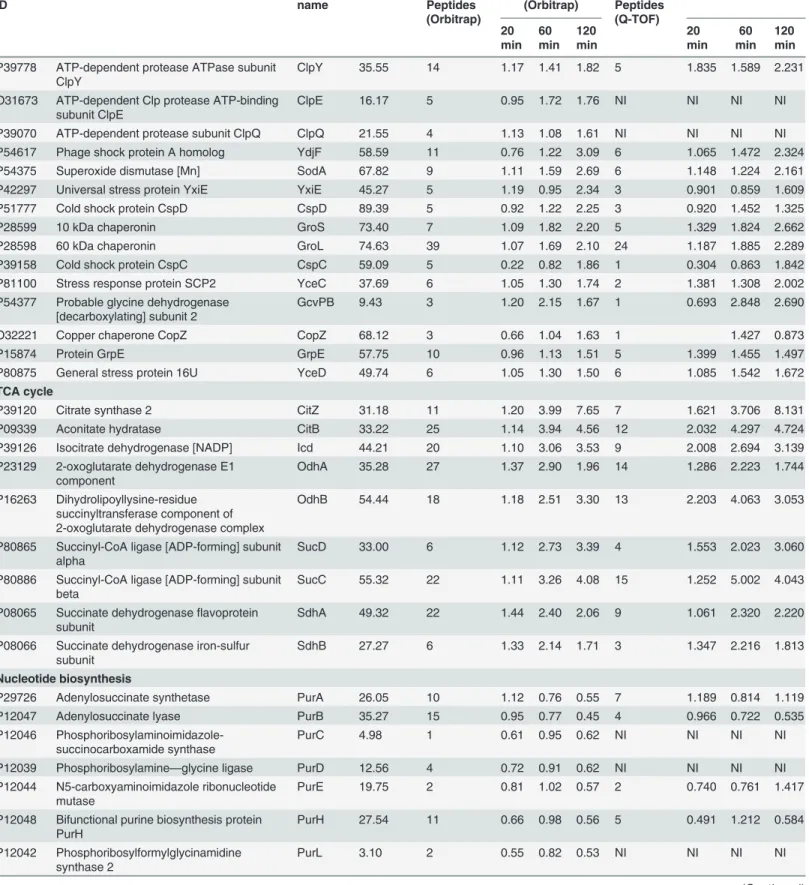
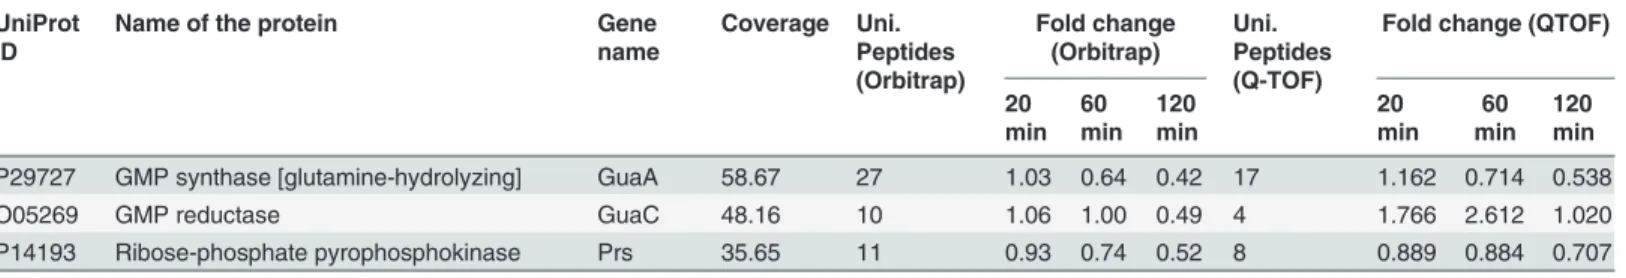
FDR were considered for analysis. Calculation of FDR is important to ensure the validity of re-sults. Proteome Discoverer workbench allows automated calculation of false discovery rate. Percolator (component of Proteome Discoverer 1.3) improves the sensitivity of existing data-base search algorithms at a constant false discovery rate. Target FDR (strict), which specifies a strict target false discovery rate for peptide matches with high confidence, was employed for analysis. Quality of the iTRAQ data was checked by S-curve analysis of QTOF and Orbitrap data. QTOF analysis indicated differential expression of 20%, 26% and 40% the total proteome; while the Orbitrap analysis exhibited 6%, 17% and 40% alterations inB.subtilisproteome in 20 min, 60 min and 120 min curcumin treatment, respectively with 1.5-fold change (Fig 3C and 3DandS3 Fig). The complete list of the identified proteins from LTQ-Orbitrap and Q-TOF along with the peptide sequence, sequence coverage, unique peptides, PSM, modifications, X Corr and iTRAQ ratios information is provided in supplementary information (S2 Table). The comparative quantitative proteomic analysis between QTOF and Orbitrap indicated differen-tial expression (1.5 fold change) of 15 proteins in 20 min (8 up-regulated and 7 down-regulat-ed), 81 proteins in 60 min (69 up-regulated and 12 down-regulated) and 210 proteins in 120 min (154 up- regulated and 56 down-regulated) of curcumin treatment with similar trend in both of the mass-spectrometric analysis (S2 Table). In addition, we have compared the Orbi-trap and QTOF data without any fold-change criteria. In case of OrbiOrbi-trap, we identified 1414 proteins whereas in case of QTOF, we identified 864 proteins. The coverage in QTOF analysis is quite low compared to Orbitrap analysis. In case of 20 min, 273 up-regulated proteins (39% in Orbitrap data and 63% in QTOF data) and 229 down-regulated proteins (33% of Orbitrap data and 60% of QTOF data) exhibited similar trend. In case of 60 min, 288 up-regulated pro-teins (39% of Orbitrap data and 69% of QTOF data) and 246 down-regulated propro-teins (37% of Orbitrap data and 66% of QTOF data) showed similar trend of differential expression. In case of 120 min, 332 up-regulated proteins (43% of Orbitrap data and 80% of QTOF data) and 286 down-regulated proteins (45% in Orbitrap data and 75% in QTOF data) were found to be of similar trends. The low percentage of similarity in Orbitrap data is due to the low coverage in QTOF (S4A Fig). More than 90% proteins identified in QTOF were also identified in Orbitrap analysis (S4B Fig). Few proteins such as 3-oxoacyl-[acyl-carrier-protein] synthase 3 protein 2, ATP-dependent Clp protease proteolytic subunit and 60 kDa chaperonin exhibited similar trend across the time points in both Q-TOF and LTQ-orbitrap analysis (Fig 3BandS2 Table).
In addition, comparative analysis of the findings obtained from the two complementary techniques indicated that most of the differentially expressed protein identified in DIGE were also detected in iTRAQ analysis (Orbitrap data), except diaminopimelate epimerase, differen-tial expression of which was only identified in DIGE (S5A and S5B Fig). Further, the compari-son among the time point analysis revealed that quite a few differential expressed proteins were time point specific (S6 Fig). The MS/MS spectra of a few selected proteins along with the inset showing the iTRAQ reporter ion intensities for representative peptides in control and curcu-min treated (20, 60 and 120 curcu-min) samples are depicted in theFig 3B.
Alteration of Protein Clusters after Curcumin Treatment
The global proteome analysis using both DIGE and iTRAQ characterized the physiological re-sponses ofB.subtilisto curcumin treatment. Expectedly, the differential proteomic analysis was collected after 20, 60 and 120 min of the drug treatment. Cultures treated with only DMSO was used as control. The nuclear materials were stained using
1μg/μL DAPI for 20 min at room temperature in dark for all the samples. The fluorescence microscopic images were captured with both DAPI and DIC filters.
The controlB.subtiliscells showed normal cell length with one or two nucleoids per cell whereas after 20, 60 and 120 min of incubation with 20μM (IC50 concentration) curcumin, most of the cells turned into filamentous structure with multiple nucleoids. I- DIC image, II- DAPI image and III- overlay image.
Fig 2. Temporal proteome changes ofB.subtilisunder curcumin treatment identified using 2D-DIGE.Representative overlapped (Cy3 and Cy5)
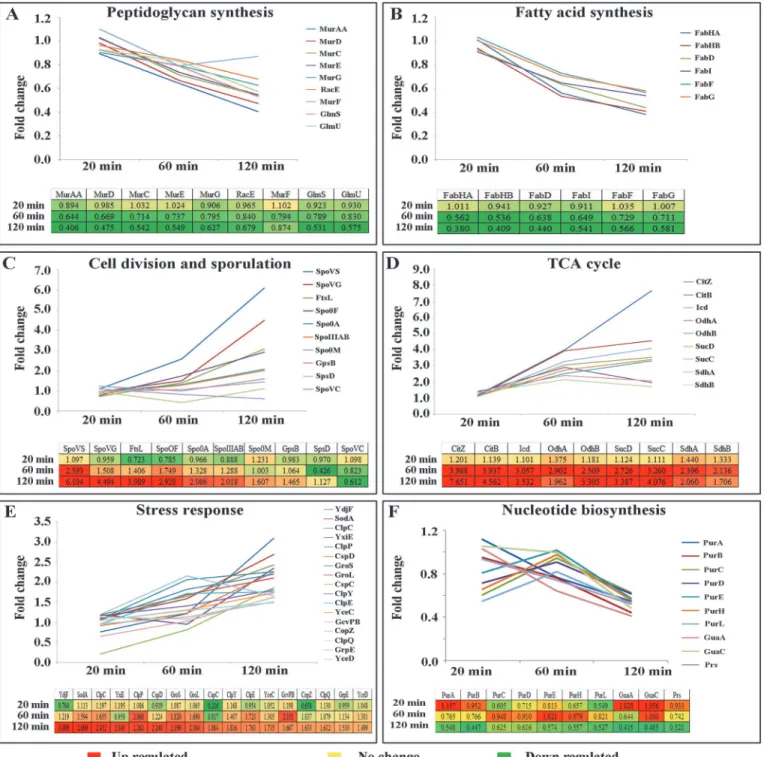
highlighted the induction of a cluster of proteins involved in stress response; additionally al-tered expression levels of proteins associated with cell division, sporulation and central metab-olism. The universal chaperone proteins such as GroEL and GroES showed induction as time of curcumin treatment increased. Chaperone-proteases required for protein folding and degra-dation of aggregated proteins were also induced linearly with exposure time. Similarly, quite a few cell division/sporulation and central metabolism proteins were also induced with negligible change after 20 min but showed linear induction at 60 and 120 min treatment. Proteins associ-ated with nucleotide biosynthesis showed repression with respect to the exposure time. In addi-tion, quite a few proteins involved in peptidoglycan synthesis and fatty acid synthesis exhibited linear repression in expression level with respect to curcumin treatment. The quantitation of proteins involved in fatty acid synthesis, cell wall biogenesis, cell division, sporulation, TCA cycle, nucleotide biosynthesis and stress physiology are summarized in theTable 2,Fig 4and
S7 Fig.
Modulation of Biological Process and Physiological Pathways in
B
.
subtilis
due to Curcumin Treatment
KOBAS and DAVID analysis performed with the differentially expressed proteins (1% FDR and 1.5 fold-change) indicated immediate exposure (20 min treatment) of the drug did not af-fect the physiological pathway significantly. Intermediate exposure (60 min treatment) ofB.
subtilisto curcumin caused the alterations of TCA cycle, glyoxylate metabolism, anaerobic res-piration, gluconeogenesis and glycine cleavage (S3 Table). Prolonged exposure of curcumin (120 min) effectively altered the fatty acid synthesis, peptidoglycan synthesis, anaerobic respi-ration, TCA cycle and propionate metabolism (S3 Table).
Effect of Curcumin on Respiratory Activity, Ion Leakage and Metabolic
Activity
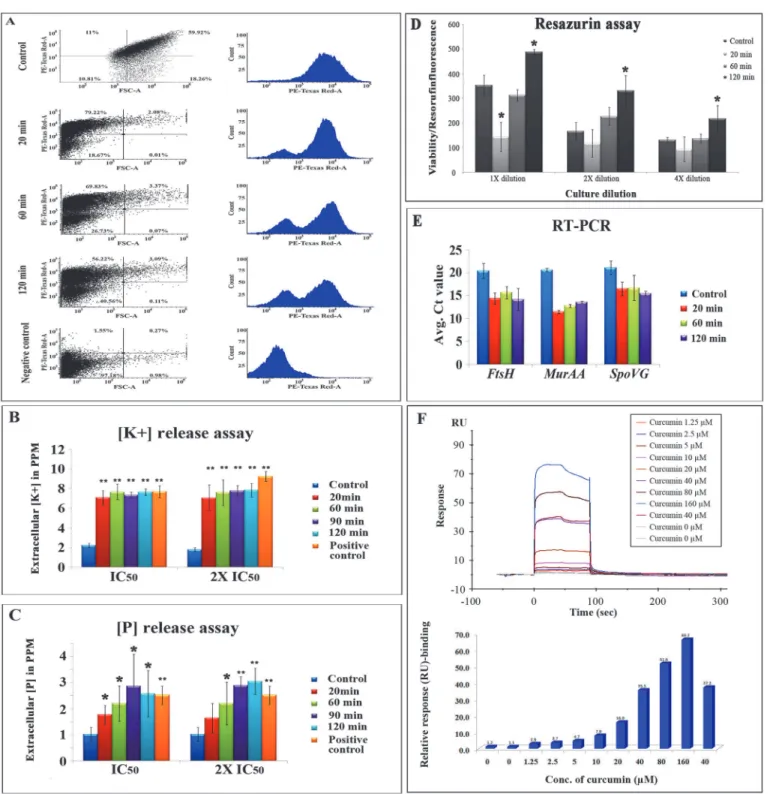
Respiratory activity of the drug treated cells were analyzed by CTC (5-cyano-2, 3-ditolyl tetra-zolium chloride) staining and flow cytometric analysis. CTC is a non-fluorescent dye which is converted into red-colored fluorescent formazan in respiratory active cells. Control and curcu-min treated (20 curcu-min, 60 curcu-min and 120 curcu-min) samples were dual stained with 5 mM CTC for 30 min at 37° C in dark followed by counter staining with DAPI. The total population of viable cells were determined by measuring the DAPI with UV laser (358 nm) and the CTC stained cells were measured by exciting with red florescence laser (630 nm) in FACS. Both forward and side scattering were measured to analyze the size of the cell and to remove the contaminants re-spectively. Curcumin treatment cells showed reduced formazan florescence with respect to the untreated control cells, and the reduction in formazan florescence found to be increased with the time of drug exposure. A negative control was prepared by disturbing the membrane using 2.8% formaldehyde and 0.04% glutaraldehyde for 30 min prior to the CTC staining, for which the CTC intensity was almost zero (Fig 5A).
The extracellular inorganic phosphate and potassium levels were monitored at different time intervals of curcumin exposure using ICP-AES. The extracellular K+and P levels of curcu-min treated cells (both IC50and 2 x IC50) found to be increased with respect to the untreated
control cells. Nearly three times increase in the extracellular K+leakage was observed after 20 and 120 min) and internal standard were labelled with Cy3, Cy5 and Cy2, respectively (Dye swapping was performed). Proteins were separated in first dimension IEF on 24 cm IPG strips of pH 4–7 range followed by second dimension separation on 12.5% SDS-PAGE. 3D view and BVA graphs of selected
differentially expressed proteins (p<0.05) identified from each time point of curcumin treatment in 2D-DIGE are shown. Data is represented as mean±SE (where n = 3).
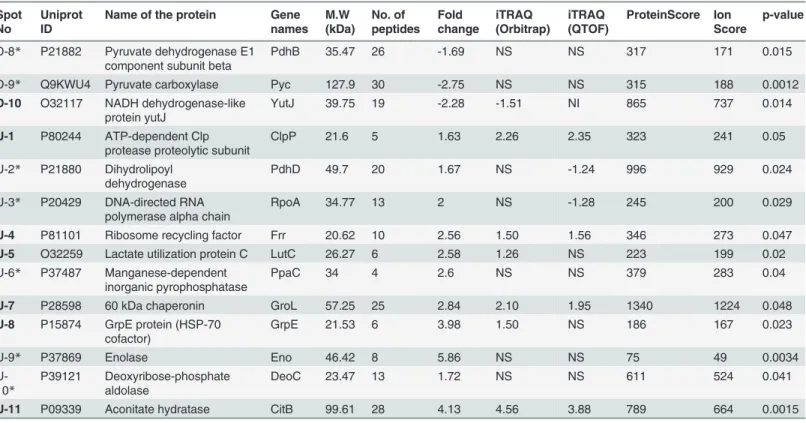
Table 1. List of differentially expressed proteins inB.subtilisdue to curcumin treatment obtained from DIGE analysis and its comparison with
iTRAQ analysis$.
Spot No
Uniprot ID
Name of the protein Gene names M.W (kDa) No. of peptides Fold change iTRAQ (Orbitrap) iTRAQ (QTOF) ProteinScore Ion Score p-value
20 min curcumin treatment
D-1* P37809 ATP synthase subunit beta AtpD 51.42 19 -1.56 NS NS 662 423 0.032
D-2 P80698 Trigger factor Tig 47.48 11 -1.78 -1.21 -1.25 579 426 0.039
U-1* P46336 Protein IolS IolS 35.17 13 1.85 NS 2.39 167 104 0.01
U-2 O31605 Oligoendopeptidase F homolog
YjbG 77.07 4 1.78 1.59 1.58 109 85 0.019
60 min curcumin treatment
D-1* P37253 Ketol-acid reductoisomerase IlvC 37.43 19 -1.67 NS NI 1240 1163 0.043
D-2* P42973 Aryl-phospho-beta-D-glucosidase BglA
BglA 54.84 18 -1.69 NS NS 266 229 0.04
D-3 # O32114 Diaminopimelate epimerase DapF 30.85 4 -1.72 NI NI 109 100 0.0067
D-4* P20429 DNA-directed RNA polymerase alpha chain
RpoA 34.77 13 -1.95 NS -1.42 245 200 0.029
D-5* P22250 Glutamate—tRNA ligase GltX 55.72 36 -2.23 NS NS 783 648 0.026
D-6 Q07836 Uncharacterized protein yxxG
YxxG 16.43 4 -2.72 -1.61 -5.00 274 207 0.027
D-7 P80868 Elongation factor G FusA 76.62 50 -5.01 -1.45 -1.48 1120 889 0.041
D-8 P80868 Elongation factor G FusA 76.62 49 -5.92 -1.45 -1.48 1090 884 0.014
U-1 O32201 Protein LiaH LiaH 25.69 31 17 6.63 2.23 788 663 0.0017
U-2* P21464 30S ribosomal protein S2 RpsB 27.96 15 4.22 NS -1.34 601 534 0.00026
U-3 P49814 Malate dehydrogenase Mdh 33.64 13 2.97 2.17 1.63 628 586 0.047
U-4* P80866 Vegetative protein 296 YurY 29.03 9 2.95 NS NS 110 96 0.035
U-5* P17820 Chaperone protein dnaK DnaK 66 29 2.79 NS NS 1000 793 0.0041
U-6 P54550 Probable NADH-dependent
flavin oxidoreductase yqiM
YqiM 37.58 14 2.33 1.37 2.82 513 463 0.05
U-7 P80864 Probable thiol peroxidise Tpx 18.31 10 2.18 1.56 1.52 303 233 0.0053
U-8 P96611 Thioredoxin-like protein ydbP
YdbP 12.43 5 2.11 1.39 1.39 120 102 0.032
U-9* P49778 Elongation factor P Efp 20.47 7 2.07 NS NS 203 175 0.032
U-10*
P37809 ATP synthase beta chain AtpD 51.42 29 1.96 NS NS 1350 1192 0.045
U-11 O35022 FMN-dependent NADH-azoreductase 1
AzoR1 22.98 17 1.78 1.85 NI 436 391 0.036
U-12 P28599 10 kDa chaperonin GroS 10.17 5 1.51 1.81 1.65 157 122 0.038
120 min curcumin treatment D-1 P23630 Diaminopimelate
decarboxylase
LysA 48.7 18 -3.64 -1.35 -1.51 482 414 0.0034
D-2 P30950 Delta-aminolevulinic acid dehydratase
HemB 36.2 4 -3.57 -1.52 -1.33 146 102 0.012
D-3 P32395 Uroporphyrinogen decarboxylase
HemE 39.64 3 -3.57 -1.29 1.62 208 164 0.039
D-4 P54419 S-adenosylmethionine synthetase
MetK 44 10 -1.67 -2.33 -2.45 104 83 0.0079
D-5* P39121 Deoxyribose-phosphate aldolase
DeoC 22.19 6 -2.35 NS NS 175 150 0.0045
D-6 P05654 Aspartate
carbamoyltransferase
PyrB 34.31 16 -2.29 -1.94 NI 468 373 0.028
D-7 P52996 3-methyl-2-oxobutanoate hydroxymethyltransferase
PanB 30 3 -1.94 NS -1.92 328 284 0.037
min exposure of curcumin and the levels were remained unaltered with respect to the untreated control as time of curcumin exposure increased to 120 min. Moreover, inorganic phosphate levels were found to be increased with the increase in exposure time of curcumin from 20 min to 120 min. In case of positive control (the cells were heated at 70° C for 30 min), the extracellu-lar K+and P levels were found to be higher compared to the untreated control; the similar trend as exhibited by the curcumin treated samples. Two different concentrations of curcumin were used to monitor extracellular K+and P levels, but no significant difference was observed between the IC50and 2 x IC50concentrations of the drug (Fig 5B and 5C).
Non-fluorescent resazurin blue dye is converted into pink resorufin by the active metabolic enzymes from central metabolism in the viable cells.B.sublitiscells treated with curcumin ex-hibited reduced metabolic activity at the immediate exposure (20 min) of curcumin whereas the metabolic activity was found to be increased at the intermediate (60 min) and long expo-sure (120 min) of the drug as compared to untreated control cells (Fig 5D).
Gene Expression Analysis using RT-PCR and SPR Interaction Analysis
The quantitative gene expression analysis of three selected candidates includingmurAA(UDP-N-acetylglucosamine 1-carboxyvinyltransferase 2),spoVG(putative septation protein SpoVG) andftsH(ATP-dependent zinc metalloprotease FtsH) associated with cell division was performed using RT-PCR analysis. Gene expression analysis offtsH and spoVGshowed Table 1. (Continued)
Spot No
Uniprot ID
Name of the protein Gene names M.W (kDa) No. of peptides Fold change iTRAQ (Orbitrap) iTRAQ (QTOF) ProteinScore Ion Score p-value
D-8* P21882 Pyruvate dehydrogenase E1 component subunit beta
PdhB 35.47 26 -1.69 NS NS 317 171 0.015
D-9* Q9KWU4 Pyruvate carboxylase Pyc 127.9 30 -2.75 NS NS 315 188 0.0012
D-10 O32117 NADH dehydrogenase-like protein yutJ
YutJ 39.75 19 -2.28 -1.51 NI 865 737 0.014
U-1 P80244 ATP-dependent Clp protease proteolytic subunit
ClpP 21.6 5 1.63 2.26 2.35 323 241 0.05
U-2* P21880 Dihydrolipoyl dehydrogenase
PdhD 49.7 20 1.67 NS -1.24 996 929 0.024
U-3* P20429 DNA-directed RNA polymerase alpha chain
RpoA 34.77 13 2 NS -1.28 245 200 0.029
U-4 P81101 Ribosome recycling factor Frr 20.62 10 2.56 1.50 1.56 346 273 0.047
U-5 O32259 Lactate utilization protein C LutC 26.27 6 2.58 1.26 NS 223 199 0.02
U-6* P37487 Manganese-dependent inorganic pyrophosphatase
PpaC 34 4 2.6 NS NS 379 283 0.04
U-7 P28598 60 kDa chaperonin GroL 57.25 25 2.84 2.10 1.95 1340 1224 0.048
U-8 P15874 GrpE protein (HSP-70 cofactor)
GrpE 21.53 6 3.98 1.50 NS 186 167 0.023
U-9* P37869 Enolase Eno 46.42 8 5.86 NS NS 75 49 0.0034
U-10*
P39121 Deoxyribose-phosphate aldolase
DeoC 23.47 13 1.72 NS NS 611 524 0.041
U-11 P09339 Aconitate hydratase CitB 99.61 28 4.13 4.56 3.88 789 664 0.0015
$ This is a partial list having selected candidates with>1.5 fold change and complete list is provided inS2 Table
#: Proteins unique in DIGE, Bold: Same trend in both DIGE and iTRAQ (Orbitrap data);
*or NS: No significant change in iTRAQ in Orbitrap data (less than 1.2 fold up and down); NI- Not identified in iTRAQ analysis.
significant elevation in their expression at transcriptome levels, which is consistence with the proteomic data; whereasmurAAexhibited elevated expression at mRNA level after curcumin treatment, but showed reverse trend of differential expression in proteomic analysis (Fig 5E).
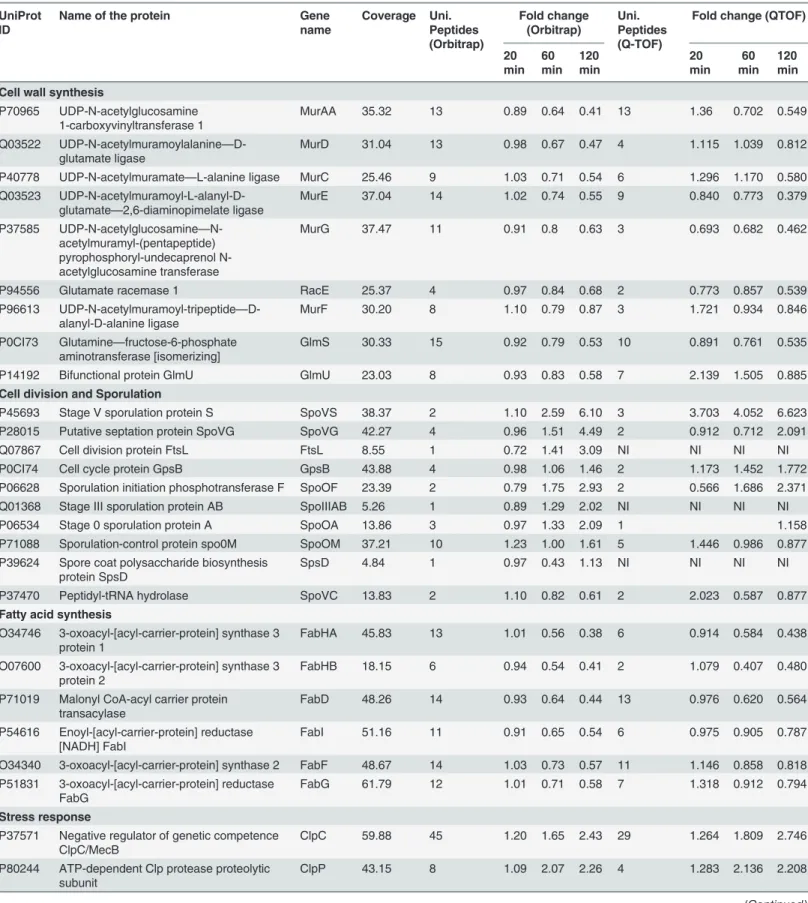
The SPR-biosensor based interaction analysis has showed very good binding of curcumin with FtsZ and the interaction was measured by calculating the response unit (RU). Eight differ-ent concdiffer-entrations of curcumin was used for interaction analysis and all the concdiffer-entrations showed binding of curcumin to the FtsZ in concentration-dependent manner i.e. as the con-centration of curcumin increases, the observed response unit was also increased linearly. The Fig 3. Schematic representation of experimental strategy for temporal proteome analysis ofB.subtilisunder curcumin treatment by iTRAQ-based quantitative proteomics. (A)Samples processed in triplicate were pooled from control, 20, 60 and 120 min curcumin treated cultures and labelled with iTRAQ reagent 114, 115, 116 and 117, respectively. The labelled peptides were fractionated in OFFGEL fractionators using high resolution (24 cm; 3–10 pH)
IPG strips and each fraction was desalted using C18 tips. Desalted fractions were subjected to LTQ-Orbitrap Velos mass spectrometer for protein identification and quantitation.(B)Representative MS/MS spectrum of a few selected differentially expressed proteins identified after curcumin treatment. UDP-N-acetylglucosamine 1-carboxyvinyltransferase 1 (MurAA), ATP-dependent zinc metalloprotease FtsH, Septum site-determining protein (DivIVA), and 3-oxoacyl-[acyl-carrier-protein] synthase 3 protein 1 (FabHB). Inset showing the iTRAQ reporter ion intensities for representative peptides in control and curcumin treated samples.(C)S-curve analysis exhibiting distribution of the differentially expressed proteins inB.subtilisafter 20, 60 and 120 min of curcumin treatment identified using Q-TOF (average of three triplicate runs).(D)S-curve analysis exhibiting distribution of the differentially expressed proteins in 20, 60 and 120 min curcumin treatedB.subtilisidentified using LTQ-orbitrap.
Table 2. Partial list of differentially expressed proteins inB.subtilisdue to curcumin treatment obtained from iTRAQ analysis*.
UniProt ID
Name of the protein Gene name Coverage Uni. Peptides (Orbitrap) Fold change (Orbitrap) Uni. Peptides (Q-TOF)
Fold change (QTOF)
20 min 60 min 120 min 20 min 60 min 120 min
Cell wall synthesis
P70965 UDP-N-acetylglucosamine 1-carboxyvinyltransferase 1
MurAA 35.32 13 0.89 0.64 0.41 13 1.36 0.702 0.549
Q03522 UDP-N-acetylmuramoylalanine—
D-glutamate ligase
MurD 31.04 13 0.98 0.67 0.47 4 1.115 1.039 0.812
P40778 UDP-N-acetylmuramate—L-alanine ligase MurC 25.46 9 1.03 0.71 0.54 6 1.296 1.170 0.580
Q03523 UDP-N-acetylmuramoyl-L-alanyl-D-glutamate—2,6-diaminopimelate ligase
MurE 37.04 14 1.02 0.74 0.55 9 0.840 0.773 0.379
P37585 UDP-N-acetylglucosamine—
N-acetylmuramyl-(pentapeptide) pyrophosphoryl-undecaprenol N-acetylglucosamine transferase
MurG 37.47 11 0.91 0.8 0.63 3 0.693 0.682 0.462
P94556 Glutamate racemase 1 RacE 25.37 4 0.97 0.84 0.68 2 0.773 0.857 0.539
P96613 UDP-N-acetylmuramoyl-tripeptide—
D-alanyl-D-alanine ligase
MurF 30.20 8 1.10 0.79 0.87 3 1.721 0.934 0.846
P0CI73 Glutamine—fructose-6-phosphate
aminotransferase [isomerizing]
GlmS 30.33 15 0.92 0.79 0.53 10 0.891 0.761 0.535
P14192 Bifunctional protein GlmU GlmU 23.03 8 0.93 0.83 0.58 7 2.139 1.505 0.885
Cell division and Sporulation
P45693 Stage V sporulation protein S SpoVS 38.37 2 1.10 2.59 6.10 3 3.703 4.052 6.623
P28015 Putative septation protein SpoVG SpoVG 42.27 4 0.96 1.51 4.49 2 0.912 0.712 2.091
Q07867 Cell division protein FtsL FtsL 8.55 1 0.72 1.41 3.09 NI NI NI NI
P0CI74 Cell cycle protein GpsB GpsB 43.88 4 0.98 1.06 1.46 2 1.173 1.452 1.772
P06628 Sporulation initiation phosphotransferase F SpoOF 23.39 2 0.79 1.75 2.93 2 0.566 1.686 2.371
Q01368 Stage III sporulation protein AB SpoIIIAB 5.26 1 0.89 1.29 2.02 NI NI NI NI
P06534 Stage 0 sporulation protein A SpoOA 13.86 3 0.97 1.33 2.09 1 1.158
P71088 Sporulation-control protein spo0M SpoOM 37.21 10 1.23 1.00 1.61 5 1.446 0.986 0.877 P39624 Spore coat polysaccharide biosynthesis
protein SpsD
SpsD 4.84 1 0.97 0.43 1.13 NI NI NI NI
P37470 Peptidyl-tRNA hydrolase SpoVC 13.83 2 1.10 0.82 0.61 2 2.023 0.587 0.877
Fatty acid synthesis
O34746 3-oxoacyl-[acyl-carrier-protein] synthase 3 protein 1
FabHA 45.83 13 1.01 0.56 0.38 6 0.914 0.584 0.438
O07600 3-oxoacyl-[acyl-carrier-protein] synthase 3 protein 2
FabHB 18.15 6 0.94 0.54 0.41 2 1.079 0.407 0.480
P71019 Malonyl CoA-acyl carrier protein transacylase
FabD 48.26 14 0.93 0.64 0.44 13 0.976 0.620 0.564
P54616 Enoyl-[acyl-carrier-protein] reductase [NADH] FabI
FabI 51.16 11 0.91 0.65 0.54 6 0.975 0.905 0.787
O34340 3-oxoacyl-[acyl-carrier-protein] synthase 2 FabF 48.67 14 1.03 0.73 0.57 11 1.146 0.858 0.818 P51831 3-oxoacyl-[acyl-carrier-protein] reductase
FabG
FabG 61.79 12 1.01 0.71 0.58 7 1.318 0.912 0.794
Stress response
P37571 Negative regulator of genetic competence ClpC/MecB
ClpC 59.88 45 1.20 1.65 2.43 29 1.264 1.809 2.746
P80244 ATP-dependent Clp protease proteolytic subunit
ClpP 43.15 8 1.09 2.07 2.26 4 1.283 2.136 2.208
Table 2. (Continued)
UniProt ID
Name of the protein Gene name Coverage Uni. Peptides (Orbitrap) Fold change (Orbitrap) Uni. Peptides (Q-TOF)
Fold change (QTOF)
20 min 60 min 120 min 20 min 60 min 120 min
P39778 ATP-dependent protease ATPase subunit ClpY
ClpY 35.55 14 1.17 1.41 1.82 5 1.835 1.589 2.231
O31673 ATP-dependent Clp protease ATP-binding subunit ClpE
ClpE 16.17 5 0.95 1.72 1.76 NI NI NI NI
P39070 ATP-dependent protease subunit ClpQ ClpQ 21.55 4 1.13 1.08 1.61 NI NI NI NI
P54617 Phage shock protein A homolog YdjF 58.59 11 0.76 1.22 3.09 6 1.065 1.472 2.324
P54375 Superoxide dismutase [Mn] SodA 67.82 9 1.11 1.59 2.69 6 1.148 1.224 2.161
P42297 Universal stress protein YxiE YxiE 45.27 5 1.19 0.95 2.34 3 0.901 0.859 1.609
P51777 Cold shock protein CspD CspD 89.39 5 0.92 1.22 2.25 3 0.920 1.452 1.325
P28599 10 kDa chaperonin GroS 73.40 7 1.09 1.82 2.20 5 1.329 1.824 2.662
P28598 60 kDa chaperonin GroL 74.63 39 1.07 1.69 2.10 24 1.187 1.885 2.289
P39158 Cold shock protein CspC CspC 59.09 5 0.22 0.82 1.86 1 0.304 0.863 1.842
P81100 Stress response protein SCP2 YceC 37.69 6 1.05 1.30 1.74 2 1.381 1.308 2.002
P54377 Probable glycine dehydrogenase [decarboxylating] subunit 2
GcvPB 9.43 3 1.20 2.15 1.67 1 0.693 2.848 2.690
O32221 Copper chaperone CopZ CopZ 68.12 3 0.66 1.04 1.63 1 1.427 0.873
P15874 Protein GrpE GrpE 57.75 10 0.96 1.13 1.51 5 1.399 1.455 1.497
P80875 General stress protein 16U YceD 49.74 6 1.05 1.30 1.50 6 1.085 1.542 1.672
TCA cycle
P39120 Citrate synthase 2 CitZ 31.18 11 1.20 3.99 7.65 7 1.621 3.706 8.131
P09339 Aconitate hydratase CitB 33.22 25 1.14 3.94 4.56 12 2.032 4.297 4.724
P39126 Isocitrate dehydrogenase [NADP] Icd 44.21 20 1.10 3.06 3.53 9 2.008 2.694 3.139
P23129 2-oxoglutarate dehydrogenase E1 component
OdhA 35.28 27 1.37 2.90 1.96 14 1.286 2.223 1.744
P16263 Dihydrolipoyllysine-residue succinyltransferase component of 2-oxoglutarate dehydrogenase complex
OdhB 54.44 18 1.18 2.51 3.30 13 2.203 4.063 3.053
P80865 Succinyl-CoA ligase [ADP-forming] subunit alpha
SucD 33.00 6 1.12 2.73 3.39 4 1.553 2.023 3.060
P80886 Succinyl-CoA ligase [ADP-forming] subunit beta
SucC 55.32 22 1.11 3.26 4.08 15 1.252 5.002 4.043
P08065 Succinate dehydrogenaseflavoprotein subunit
SdhA 49.32 22 1.44 2.40 2.06 9 1.061 2.320 2.220
P08066 Succinate dehydrogenase iron-sulfur subunit
SdhB 27.27 6 1.33 2.14 1.71 3 1.347 2.216 1.813
Nucleotide biosynthesis
P29726 Adenylosuccinate synthetase PurA 26.05 10 1.12 0.76 0.55 7 1.189 0.814 1.119
P12047 Adenylosuccinate lyase PurB 35.27 15 0.95 0.77 0.45 4 0.966 0.722 0.535
P12046 Phosphoribosylaminoimidazole-succinocarboxamide synthase
PurC 4.98 1 0.61 0.95 0.62 NI NI NI NI
P12039 Phosphoribosylamine—glycine ligase PurD 12.56 4 0.72 0.91 0.62 NI NI NI NI
P12044 N5-carboxyaminoimidazole ribonucleotide mutase
PurE 19.75 2 0.81 1.02 0.57 2 0.740 0.761 1.417
P12048 Bifunctional purine biosynthesis protein PurH
PurH 27.54 11 0.66 0.98 0.56 5 0.491 1.212 0.584
P12042 Phosphoribosylformylglycinamidine synthase 2
PurL 3.10 2 0.55 0.82 0.53 NI NI NI NI
duplicates (40μM) have showed similar response with FtsZ, which indicates the good quality
of the data (Fig 5F).
Discussion
Differential proteomic analysis is found to be very effective for comprehensive analysis of mi-crobial responses to different environmental stress conditions and drug treatments. Previous studies have demonstrated anti-tumergenic, anti-inflammatory, anti-mutagenic and anti-oxi-dant activities of curcumin [3,5]. Although, quite a few earlier studies have investigated the ef-fect of curcumin onB.subtilis, the mechanism of action of the drug and its role in
filamentation as well as exact molecular targets are still unclear and proteome level analysis has not been performed hitherto. To the best of our knowledge, we report here the first compre-hensive proteomic analysis describing the effect of curcumin onB.subtilisproteome to under-stand the mode of action of curcumin and its primary cellular targets. The first and foremost comprehensive proteome mapping ofB.subtiliswas reported by Eymann et al. using classical 2-DE and obtained coverage was 745 proteins [17]. Later Wolff et al. have improved the cover-age to 1218 proteins using a combination of 2-DE and iTRAQ [18]. In the present study, we were able to cover 1466 proteins using both DIGE and iTRAQ-based quantitative proteomics, which covered almost 60% of the entire vegetative proteome ofB.subtilis. The present study demonstrates the application of temporal quantitative proteome analysis to understand the mechanism of action and possible targets of curcumin inB.subtilis. The altered proteins were found to be majorly involved in bacterial cell division, cell wall biosynthesis, fatty acid synthesis and central metabolism. In addition, the universal chaperone system (GroEL) required for FtsZ folding and the major protease (Clp family) system target FtsZ for degradation has been altered. We would also like to mention that this is the foremost global study contributing to un-derstand the mechanism of action and putative targets of curcumin inB.subtilis.
Our proteomic analysis revealed modulation of quite a few members of cell wall biosynthe-sis and cell division machinery proteins. Peptidoglycan cross-linking is the major scaffold in cell wall to provide the strength and maintain the cell shape along with shape determining pro-teins [19]. Cell wall and cell division proteins express together to correlate the division with cell wall synthesis which reside in the division cell wall (DCW) cluster. Quite a few cell wall synthe-sizing proteins of DCW cluster were found to be repressed at the intermediate and long expo-sure of curcumin, whereas cell division proteins were slightly induced indicating that
individual promoters up-stream to the each gene are affected, but the common promoter of DCW cluster probably remained unaffected [20]. MurAA, which catalyzes the first step in pep-tidoglycan synthesis and is linked to the rest of the Mur proteins involved in successive steps Table 2. (Continued)
UniProt ID
Name of the protein Gene name
Coverage Uni. Peptides (Orbitrap)
Fold change (Orbitrap)
Uni. Peptides (Q-TOF)
Fold change (QTOF)
20 min
60 min
120 min
20 min
60 min
120 min
P29727 GMP synthase [glutamine-hydrolyzing] GuaA 58.67 27 1.03 0.64 0.42 17 1.162 0.714 0.538
O05269 GMP reductase GuaC 48.16 10 1.06 1.00 0.49 4 1.766 2.612 1.020
P14193 Ribose-phosphate pyrophosphokinase Prs 35.65 11 0.93 0.74 0.52 8 0.889 0.884 0.707
*This is a partial list having selected candidates; complete list is provided inS2 Table NI- Not identified in Q-TOF
and also coordinate in cell division, was found to be repressed after curcumin treatment (Fig 6). Even though, MurAA protein level was repressed under curcumin treatment, its mRNA level expression was found to be elevated (Fig 5E). In order to find out the rationale behind this observation, expression levels of different proteins which have direct or indirect influence on Fig 4. Quantitative profiles of the differentially expressed proteins involved in diverse biological processes identified in iTRAQ-based quantitative proteomics analysis using LTQ-Orbitrap. (A)Peptidoglycan biosynthesis,(B)Fatty acid synthesis,(C)Cell division and sporulation,(D)TCA cycle,(E) Stress response and(F)Nucleotide biosynthesis. Data from QTOF is provided in theS2 Fig.
Fig 5. (A) CTC staining and flow cytometric analysis for respiratory activity.Graphical representation of CTC mean intensity (PE-Texas Red-A)vs. FSC-A obtained in the FACS analysis of control, 20, 60 and 120 min curcumin treated samples and negative control. Both dot plot and histogram
representations are displayed for each sample.(B) & (C)Potassium and phosphorus leakage assay; curcumin (20 and 40μM) was added to theB.subtilisin HEPES-glucose medium and K+and P levels were measured at 20, 60, 90 and 120 min time intervals, and also in the untreated control and positive control (heated at 70° C for 30 min) samples using ICP-AES and data was normalized with baseline HEPES-glucose medium.(D)Metabolic activity assay using resazurin. 20 min curcumin treatment has showed lower metabolic activity whereas the metabolic activity increased as time of exposure increased to 60 min and 120 min as compared to control.*indicatesp<0.05.(E)Gene expression analysis using RT-PCR formurAA,spoVGandftsHgenes and the relative expression was calculated by taking mean Ctvalues from triplicate runs.*indicatesp<0.05 and**indicatesp<0.001.(F)Physical interaction analysis of curumin withB.subtilisFtsZ immobilized on CM-5 sensor chip. The interaction was monitored by measuring the response unit and the response unit was increased as the concentration of curcumin increased. Both sensorgram and the bar diagram showing the binding to FtsZ was displayed.
MurAA expression at the protein level were analyzed carefully. Interestingly, we identified ele-vated level of ClpCP, which is a proteolytic enzyme causing degradation of MurAA during the 60 and 120 min of curcumin exposure [20]. In addition, GlmS and GlmU, two crucial enzymes required for cell wall synthesis have been found to be repressed; GlmS is also a target of ClpC [14] and its down-regulation may be a consequence of elevated cellular level of ClpCP. Addi-tionally, cell wall stress specific marker protein like protein LiaH was also found to be induced under curcumin treatment; probably to protect the survival of the bacteria despite hampered cell wall biosynthesis under the stress condition. Induction of YdjF and YtrB proteins, which are marker proteins of cell wall damage and help in stabilizing the cell envelop, was also ob-served [21]. Interestingly, MreBH, MreB and Mbi, the major proteins involved in cell morpho-genesis, were also found to be repressed at the late stages of curcumin treatment. Earlier studies have demonstrated that MreB knockouts strains and reduced expression of MreHB and Mbi lead to the filamentous cell morphology [22,23]. Further, FtsL-DivIB and MinJ proteins, which play an important role in the late stage vegetative septum and asymmetric septum formation during sporulation [24–27] were slightly induced due to the curcumin treatment. Further, Fig 6. Modulation of essential physiological pathways inB.subtilisdue to curcumin treatment.The pathway was built based on DAVID, KEGG and KOBAS analysis and the combined pathway was built manually. Red bar or name indicates down-regulation and blue bar and name indicates up-regulation. The three bars indicate the protein expression at 20, 60 and 120 min of curcumin treatment (expression levels obtained from LTQ-Orbitrap analysis). PRPP-5-Phospho-alpha-D-ribose 1-diphosphate; GAR-5'-Phosphoribosylglycinamide; FGAM-5'-Phosphoribosyl-N-formylglycinamidine; CAIR-5'-Phosphoribosyl-5-amino-4-imidazolecarboxylate; SAICAR-5'-Phosphoribosyl-4-(N-succinocarboxamide)-5-aminoimidazole; AICAR-5-Phosphoribosyl-4-carbamoyl-5-aminoimidazole; FAICAR-5'-Phosphoribosyl-5-formamido-4-imidazolecarboxamide; IMP-Inosine monophosphate.
ATP-dependent zinc metal protease (FtsH) that degrades the peptidoglycan layer and main-tains lipid homeostasis during vegetative and sporulation was slightly induced at intermediate and late exposure. Gene expression analysis of FtsH also showed similar trend of induction at the transcription level probably to enhance the asymmetric division [28]. Interestingly, the SpoVG, asymmetric division regulator proteins were induced both at protein and transcrip-tome levels [29]. The induced late cell division proteins and sporulation proteins indicate the asymmetric division as an alternative of vegetative septum. Besides, Rai et al. showed that cur-cumin treatment severally perturbs the FtsZ polymerization dynamics required for the cell di-vision and leads to filamentation. The biosensor-based interaction analysis has also showed binding of curcumin with FtsZ at the molecular level and may halt the function of polymeriza-tion (Fig 5F). Therefore, we anticipate that apart from disturbing the FtsZ polymerization, cur-cumin also affects the expression of cell division accessory proteins [12].
Since diverse classes of proteins associated with cell division and cell wall synthesis process were found to be deregulated due to the curcumin treatment, we were interested to verify the expression levels of molecular chaperones, which support the folding of the proteins. Clp pro-teins are highly conserved protease system in eubacteria and constitute ClpC, ClpX, ClpE, ClpY, ClpQ and ClpP inB.subtilis[30]. These proteins are generally induced under stress con-ditions and recognize the unfolded proteins, while ClpP is the proteolytic core, which degrades the unfolded proteins [31]. The increased expression levels of the multiple members of Clp family under curcumin treatment indicate aggregations or unfolding of the proteins in the cell. Additionally, Clp family has important role in cell division because FtsZ is one of the prime tar-gets for ClpP, sporulation, motility and other physiological processes [32]. Similar results were reported previously indicating an increased expression of ClpP causes the degradation of FtsZ through its proteolytic activity and consequently promotes cell elongation [31]. We anticipate that the elevated levels of Clp family can target the cell division proteins and promote the elon-gation. However, GroEL and GroES, one of the major chaperon and co-chaperon systems inB.
subtiliswere found to be elevated due to curcumin treatment. GroL is a 60 kDa chaperonin sys-tem and GroS is a 10 kDa protein, which plays a fundamental role in protein folding and is considered to be highly conserved among eubacteria. A previous study by Kerner et al., demon-strated that GroEL system has more than 85 substrates involved in various physiological path-ways inE.coli[33]. GroEL system is also involved in folding of cell division proteins such as FtsZ, FtsA, FtsI and FtsE proteins [34]. Increased level of GroEL might be due to the mis-fold-ing of the essential cell division proteins under curcumin treatment leadmis-fold-ing to an urgent need for the excess of chaperone to repair the system. Moreover, GroEL is localized at the centre of the cell and its localization strictly depends on FtsZ. Possibly, GroEL system plays a role in sta-bilizing the FtsZ for polymerization or in the recruitment of accessory proteins to the division site necessary for septa formation [35]. Apart from GroEL, GrpE, which also plays an impor-tant role in preventing aggregation of unfolded proteins [35], was found to be elevated after curcumin treatment along with the other stress proteins probably to stabilize the growth under stress condition.
multiple vital cellular processes, was found to be reduced. InE.coli, it has been reported that SAM plays a vital role in methylating the late cell division proteins for recruitment to division site and deletion of the S-adenosyl methionine synthase causes elongation of the cells [36,37]. The reduced levels of SAM synthase suggest a similar effect on the late cell division proteins which may induce the elongation process. Additionally, cell membrane plays a crucial role in maintaining the membrane potential and PMF to generate energy. Fatty acid synthesis is essen-tial for phospholipids and lipid bilayer synthesis, which is in-tern linked to the cell membrane permeability (Fig 6). Curcumin treatment significantly affected the expression of fatty acid syn-thesizing enzymes in correlation to the time of exposure, which indicates that reduced synthe-sis of fatty acids/phospholipid is required for the cell membrane [38,39] (Fig 4). Moreover, the functional assays clearly indicated the alteration of membrane permeability and lower respira-tory activity under curcumin treatment (Fig 5A–5D). Recent studies also highlighted that membrane potential or PMF (proton motive force) is essential for the localization of cell divi-sion proteins towards the dividivi-sion site [40–42]. Additionally, membrane damage or membrane stress marker proteins such as phage shock protein A homolog (YdjF) and NH(3)-dependent NAD(+) synthetase (NadE) were found to be induced under curcumin treatment. Interestingly, similar responses were reported earlier with cell membrane targeting lantibiotics [21] indicat-ing there might be some level of similarities in the mode of action of these antimicrobials.
Quite a few bio-physical and global proteome analyses of eukaryotic systems have been re-ported earlier to elucidate the mechanism of action of curcumin [43–46]. Even though the in-hibitory concentration of curcumin required for bacteria and tumor cell lines are almost similar, curcumin is still considered as a potent antimicrobial compound due to two important reasons: firstly, curcumin is a very safe compound and human body can take up to 12g of cur-cumin/day and secondly, the poor bioavailability of curcumin in humans under physiological conditions [47,48]. Therefore, the inhibitory concentration of curcumin required for restrain-ing the microorganismsin vivocannot adversely affect the host system.
In summary, this is the first comprehensive proteomic study indicating the modulation of cell wall synthesis, cell division, chaperones and central metabolism inB.subtilisdue to curcu-min treatment. Our findings indicate that inhibition of the cell division machinery is one of the prime targets of this drug; since, multiple proteins involved in cell division process such as FtsH, FtsL, MinJ, GpsB and DivIB were found to be differentially expressed as a consequence of the curcumin treatment. In addition, cell membrane permeability/potential has been affected drastically due to repression of fatty acid synthesizing enzymes which is further supported by reduced respiratory activity and leakage of ions. Quite a few earlier studies have highlighted that the membrane permeability or potential is essential for cell division by supporting the divi-sion proteins at the septum site. To this end, a detailed investigation of the functional proper-ties of these differentially expressed proteins in the context of cell division will be useful to enhance our understanding regarding the mechanism of action of this potential
antibacterial agent.
Materials and Methods
Growth Curve Analysis of
B
.
subtilis
under Curcumin Treatment
The present study was carried out withB.subtilisAH75 strain having a spectinomycin antibi-otic marker [49]. Cultures were grown overnight at 370C in LB medium containing 100μg/mL
spectinomycin. The overnight culture was re-inoculated in fresh media with a final OD of 0.05 (at 600 nm) to adjust the cell population at 106/mL. Growth ofB.subtiliscultures were contin-ued at 37° C in the absence and presence of IC50(20μM) and MIC (100μM) concentrations of
nm of an aliquot after every 20 min interval and continued up to 360 min (mid-exponential phase). This experiment was carried out in triplicates and the growth curve was plotted with mean values and standard deviation.
Culture Conditions and Microscopic Analysis
Overnight cultures were sub-cultured into fresh LB media with sufficient amount of inoculums to get the final OD600at 0.1 and further incubated again at 37°C till the OD600reached to 0.2.
Curcumin stock solution 500 mM (Sigma, St. Louis, MO, USA) was prepared in DMSO. Cur-cumin (IC50- 20μM) was added to the bacterial cultures having 0.2 OD600and subsequently
in-cubated at 37°C. Control cultures were grown under the identical condition i.e. in the presence of the solvent (DMSO), but without the curcumin. Curcumin treated samples (10 mL each) were harvested at 20, 60 and 120 min of the drug treatment by centrifuging at 7000 rpm for 10 min at 4°C. The cells were fixed with 2.8% formaldehyde and 0.04% glutaraldehyde at 37°C for 30 min after washing with PBS buffer for 3 times. DAPI staining was performed by adding 1μg/μL concentration to the fixed cells for 20 min in dark. Morphological changes were
ob-served under a fluorescence microscope (Axio observer Z1 microscope using Axiovision soft-ware, Zeiss) using 100 X objective.
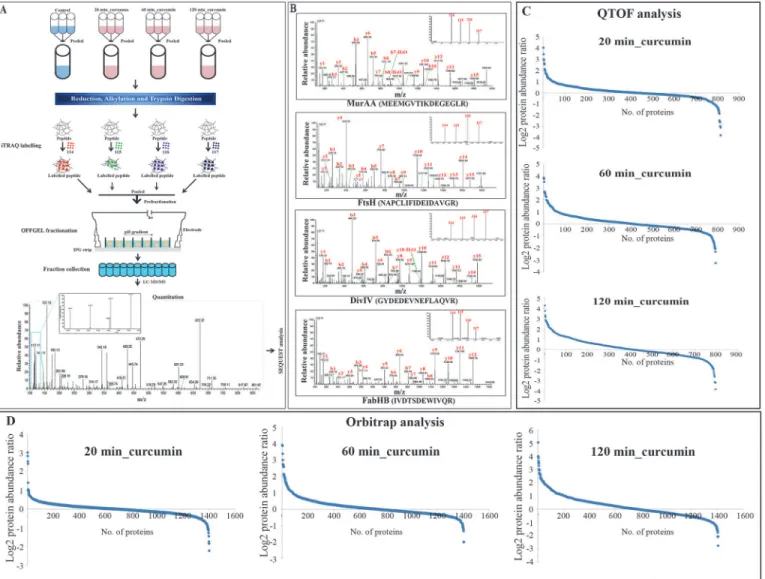
Sample Preparation from Whole Cell Extract
Protein extraction was performed from control and curcumin (20, 60 and 120 min treatment) treatedB.subtilisAH75 strains using TRIzol extraction protocol [50]. Briefly, the bacteria were harvested at different time points of curcumin exposure (20, 60 and 120 min) and untreated control samples and washed with PBS buffer (pH 7.4) for 4 times to remove the media compo-nents. Cell lysis was performed with lysozyme (1 mg/mL) and sonication in presence of prote-ase inhibitor cocktail (GE Healthcare). To the cell lysates, TRIzol and chloroform were added to remove RNA, and ethanol was added to remove DNA and chilled acetone was added to pre-cipitate protein. Protein pellet was washed with guanidine-HCl and acetone to remove the phe-nol and salts. Protein pellets were air dried and finally dissolved in rehydration buffer
containing 7 M urea, 2 M thiourea, 2% CHAPS (w/v) and traces of bromophenol blue. The protein concentration in each sample was measured using 2-D quant kit (GE healthcare) fol-lowing the manufacturer’s instructions.
Cy Dye Labelling and 2D-DIGE
Control and all three time points (20, 60 and 120 min) of curcumin treated samples were sub-jected to quantitative 2D-DIGE analysis. Prior to labelling, pH of the protein samples were ad-justed to 8.5 with 100 mM NaOH. 60μg of each protein sample (control and all three time
points of curcumin treated and internal standard) were individually labelled with 400 pmol of CyDyes (GE Healthcare). Subsequent to addition of CyDyes, samples were incubated on ice for 1 hr in the dark. Labelling reaction was stopped by addition of 10 mM lysine followed by addi-tional 10 min incubation on ice. Dye-swapping was carried out while labelling the test and con-trol samples to get rid of dye selection biasness. The details of labelling strategy are provided in
Image Acquisition and DeCyder Analysis
Image acquisition and data analysis of 2D-DIGE gels were performed as described previously [51]. In brief, the 2D-DIGE gels were scanned at a 100μm resolution using a Typhoon FLA
9500 biomolecular imager (GE healthcare) using suitable excitation/emission wavelengths for each of the CyDye (Cy3 (523/580nm), Cy5 (633/670nm) and Cy2 (488/520 nm). Comparative analysis and relative protein quantification between the curcumin treated and control samples (control vs 20 min, controlvs. 60 min and controlvs. 120 min curcumin treatment) was per-formed using DeCyder 2D software, version 7.0 (GE Healthcare). Two different modules, dif-ferential in-gel analysis (DIA) and biological variation analysis (BVA), of the DeCyder software were used for 2D-DIGE analysis. DIA module was used for spot detection and pair-wise comparisons of normal and curcumin treated samples to the mixed internal standard present in each gel. Further analysis was performed using BVA module to get the variation in protein expression between the two experimental groups (control and curcumin treated: 20/ 60/ 120 min). The differentially expressed and statistically significant (p0.05) protein spots present in all the gels were excised and used for MS analysis.
In-gel Digestion and Protein Identification using MALDI-TOF/TOF MS
In-gel digestion of the differentially expressed protein spots (p0.05) was performed follow-ing the same protocol as mentioned by Shevchenko et al. and Reddy et al. with minor modifica-tions [52,50]. The extracted trypsin digested peptides were further processed using Zip-Tip C18 pipette tips (Millipore, USA) following the manufacturer’s protocol for enrichment of the peptides and removal of salts. The protein identification was performed with MALDI-TOF/ TOF mass spectrometer (AB Sciex, Framingham, MA) linked to a 4000 series explorer software (v.3.5.3) as described previously [50]. data analysis was performed by using MASCOT version 2.1 (http://www.martixscience.com) search engine with following parameters were specified; database- SwissProt,B.subtilistaxonomy, trypsin digestion with single missed cleavage, oxida-tion of methionine as a variable modificaoxida-tion and carbamidomethylaoxida-tion of cysteine residue as a fixed modification, mass tolerance 75 ppm for MS and 0.4 Da for MS/MS.In-solution Digestion, iTRAQ labelling and Peptide OFFGEL
Fractionation
Protein samples extracted from biological triplicates of control and curcumin treated (all the three time points)B.subtiliscultures, used for DIGE analysis, were analyzed further using iTRAQ-based quantitative proteomics. Protein in rehydration solution was exchanged to TEAB buffer using Amicon Ultra 0.5 mL centrifugal 3 kDa filters (Millipore, Watford, UK). After buffer exchange, biological triplicate samples (control, 20 min, 60 min and 120 min pooled samples were pooled and quantified using QuickStart Bradford reagent (BioRad, USA). Prior to the iTRAQ labelling, in-solution digestion was performed (100μg proteins from each
sample) following the manufacturer’s instructions. The protein samples were reconstituted in dissolution buffer followed by reduction with (tris (2-carboxyethyl) phosphine (TCEP)) at 60°C for 1 h and subsequently alkylated using methyl methanethiosulfonate (MMTS) for 20 min at room temperature. Trypsin (Trypsin Gold, mass spectrometry grade, Promega, Madison, WI, USA) was added at a 1:20 trypsin: protein ratio and samples were incubated at 37° C for 16 hrs for digestion.
Labelling was quenched using 100μL of milliQ water and incubated at RT for 30 min. Peptide
OFFGEL fractionation was performed using 3100 OFFGEL fractionator (Agilent Technologies, Santa Clara, CA) with high resolution (pH 3–10, 24 cm) IPG strip following manufacturer’s in-struction for peptide fractionation. First, IPG strip was rehydrated for 30 min with 40μL of
re-hydration buffer (water and pH 3–10 IPG buffer) in each well followed by adding 150μL of
sample to each well and focusing was performed for a total of 50 kV with maximum voltage of 4000 V and 50μA current. Each fraction was collected separately and processed using C18
STAGE tips for removal of salts and other impurities prior to the MS/MS analysis.
Q-TOF and LTQ-Orbitrap Analysis
ITRAQ-labelled samples were analyzed using two mass spectrometry platforms; Agilent 6550 QTOF and Thermo Scientific LTQ Orbitrap Velos. Quantitative proteome analysis was per-formed using 6550 ESI Q-TOF iFunnel technology (Agilent technology, USA) coupled with 1260 Infinity HPLC-nano-chip cube controlled by MassHunter Acquisition software. The nano chip contains analytical column (75μm x 46 mm with 5μm pore size) made of ZORBAX
300SB C18 with CII Filter followed by an enrichment column. Peptide sample from each frac-tion was analyzed by loading 5μL of sample with the flow rate of 2μL/min of capillary pump
and 200 nL/min of nano pump. Peptide separation was performed using a gradient of 27 min; 5% sol-B at 0 min, 12% sol-B at 2 min; 30% sol-B at 20 min; 60% sol-B at 22 min, 95% sol-B at 24 min and 5% sol-B till 27 min. The acquisition parameters of mass spectrometry analysis were as follows: positive ion mode, MS mode: m/z range from 100–3200 with MS scan rate 2 spectra/sec, MS/MS mode: scan rate 5 spectra/sec, max precursor selection is 15 with charge state of>2 with collision energy maintained with slope-3.9 and offset-2.9.
LTQ-Orbitrap Velos mass spectrometer (Thermo Fischer Scientific, Bermen, Germany) in-terfaced with Proxeon Easy nLC system (Thermo Scientific, Bremen, Germany) was used for analysis of the iTRAQ-labelled OFFGEL fractionated samples. Peptides were enriched on a trap column (75μm x 2cm) packed in-house using C18 material (Magic C18AQ, 5um, 100A,
Michrom Biosciences Inc.) with a flow rate of 3μL/min and resolved on an analytical column
(75μm x 10 cm, Magic C18AQ, 3um, 100A, Michrom Biosciences Inc.) at a flow rate of 350
nL/min using a linear gradient of 7–30% acetonitrile over 60 min. Precursor MS scan (from m/ z 350–1,800) and MS/MS was acquired with a mass resolution of 60,000 and 15,000 at 400 m/z in orbitrap mass analyzer. In each duty cycle twenty most intense peaks were selected for MS/ MS fragmentation using higher-energy collision dissociation (HCD) mode at 41% normalized collision energy and isolation width was set to 1.9 m/z. Singly charged and unassigned charge precursor were rejected. Dynamic exclusion settings were enabled and acquired ions were ex-cluded for 45 sec. The automatic gain control for full MS and MS/MS was set to 1 × 10⁶and 5 × 10⁴ions, respectively. The maximum ion accumulation time was set to 200 msec for MS and 300 msec for MS/MS scans. The lock mass option was enabled using polysiloxane ion (m/ z, 445.120025) from ambient air for internal calibration.
Protein Identification, Quantitation and Data Availability
variable modification, respectively. High peptide confidence and top peptide rank filters were used to extract the peptide and protein data. The false discovery rate (FDR) was calculated based on decoy database search and a cut-off of 1% was used to report identifications. Protein data was normalized with“normalize on protein median”with minimum protein count as 20 proteins. LTQ-orbitrap mass spectrometry proteomics data have been deposited at the Proteo-meXchange Consortium [53] via the PRIDE partner repository with the dataset identifier PXD000644.
Functional Pathway Analysis
The differentially expressedB.subtilisproteins identified in both quantitative iTRAQ analysis with similar trend (1% FDR, fold change- 1.5) were further subjected toin silicoanalysis using DAVID version 6.7 (Database for Annotation, Visualization and Integrated Discovery;http:// david.abcc.ncifcrf.gov/home.jsp) and KOBAS 2.0 (KEGG Orthology Based Annotation System;
http://kobas.cbi.pku.edu.cn/home.do) [54,55]. The pathway analysis of DAVID module was used to build the pathways associated with the differentially expressed proteins indentified in
B.subtilisafter curcumin treatment. In addition, pathways were built through KOBASv2.0 using the UniProt accession IDs of the differentially expressed candidates identified from all three different time points (fold change -1.5 and 1% FDR) [56].
Resazurin Microtiter Assay for Metabolic Activity
Resazurin assay was performed as described by Mariscal et al., to check the cell viability and metabolic activity ofB.subtilisafter curcumin treatment [57]. Triplicates of control and IC50
(20μM) curcumin treatedB.subtiliscultures at 20 min, 60 min and 120 min were harvested.
Optical density of the culture was measured for determining the cell population. Cultures were diluted with PBS buffer and four different dilutions having cell population from 106to 108 cells/ mL were used for the assay. Resazurin stock was added to the each sample and the fluo-rescence intensity of resorufin was monitored at 590 nm for every 15 sec for next 30 min in a real-time PCR machine (MyiQ2 system, BioRad, USA). Mean values of curcumin treated and control groups were compared by using Student's t-test test and ap-value<0.05 was
consid-ered as statistically significant.
Respiratory Activity Assay using CTC
Respiratory activity assay using 5-Cyano-2,3-di-(p-tolyl)tetrazolium chloride (CTC) was per-formed as described by Rodriguez et al.,[58]. 50 mM stock of CTC (5-cyano-2,3-ditolyl tetrazo-lium chloride) was prepared in ultrapure water and the final concentration of 5 mM was used for the assay. Control and curcumin treated (20 min, 60 min and 120 min) cultures were used for the assay after washing the pellets with PBS buffer. CTC stock (100μL) was added to
900μL of the cultures dispersed in PBS buffer and incubated at 37°C for 30 min in dark
condi-tion with mild agitacondi-tion. Then, the cultures were fixed with 2.8% formaldehyde and 0.04% glu-taraldehyde, and counter stained with DPAI (1μg/mL) and incubated on ice for 20 min.
Negative control was prepared by disrupting the membrane with 2.8% formaldehyde and 0.04% glutaraldehyde for 30 min prior to the addition of CTC and subsequently counter stained with DAPI (1μg/mL). StainedB.subtiliscultures (curcumin treated and untreated, and
Cyflogic flow cytometry data analysis software, version 1.2.1 (http://www.cyflogic.com/) after measuring total 20,000 events.
Measurement of Potassium and Phosphate Release after Drug
Treatment
Potassium (K+) and inorganic phosphate (P) leakage measurement was performed using In-ductively Coupled Plasma—Atomic Emission Spectrometer (ICP-AES).B.subtiliscultures were grown till mid-exponential phase. The cells were harvested by centrifugation and the pel-let was washed four times with Na-HEPES buffer (pH 7.0) and then resuspended in same buff-er. Bacterial cultures were inoculated into Na-HEPES buffer having 10 mM glucose with a final OD600of 1.0. Curcumin (IC50and 2X IC50) treated and untreated culture having only DMSO
(as a control) were analyzed by K+and P leakage assay. Samples were collected at 20 min, 60 min, 90 min and 120 min time intervals from both IC50and 2 x IC50treated samples after the
addition of curcumin. Positive control was prepared by heating the control samples for 30 min at 70°C [59]. The cells were pelleted down by centrifugation at 10,000 x g for 10 min and the supernatant was collected for measuring the extracellular potassium and phosphate levels using ICP-AES. The standard curve was prepared for both K+and P and used it for measuring unknown concentrations.
Quantitative RT-PCR for Expression Analysis
B.subtilisAH75 cultures treated with IC50curcumin at 20, 60 and 120 min and untreated
con-trol cultures (20 mL culture each) were used for total RNA extraction using TRIzol reagent (Invitrogen, USA). Quality of the extracted RNA was evaluated on denatured 1% agarose gel and by measuring the spectrometric 260/280 ratio in a Nanodrop (Implen, Germany). cDNA synthesis was performed with 4μg of total RNA by using RevertAid first strand kit (Fermentas,
Europe) following the manufacturer’s protocol. Prior to real-time expression analysis, quality of cDNA synthesis was checked with PCR using designed primers (Table 3). The real-time ex-pression analysis for selected genes (MurAA,FtsH and SpoVG) was performed using Eco real-time PCR system (Eco real Time PCR, Illumina). Following setting was used for RT-PCR: denaturing step at 95°C for 5 min and 40 cycles of 95°C for 30 sec, annealing at 46°C for 30 sec and extension at 72°C for 30 sec followed by melting curve for 15 sec at 95°C, 15 sec at 46°C and finally 95°C for 15 sec. Analysis of expression levels of the genes was carried as a relative quantification by taking 16S rRNA as an internal control to normalize the data among the different triplicates.
Biosensor-based Interaction Analysis
BIAcore T200 system (GE healthcare) was used to study the interaction between FtsZ and cur-cumin. The purified FtsZ was immobilized on a CM5 sensor chip using amino coupling chem-istry (5000 RU). Eight different concentrations of curcumin (1.25, 2.5, 5, 10, 20, 40, 80 and
Table 3. List of the primers used for quantitative RT-PCR analysis for selected genes.
Gene Forward primer (5'-3') Reverse primer (5'-3') Annealing temperature (°C) Amplicon size (bp)
MurAA 5'TACAGGTCATGCAAGAGT-3' 5'TTCTCTGTAGCTCCTACACT-3' 46 196 bp
FtsH 5'CACCGTTATCGGTCTCGTTT-3' 5'CCAAGAGGCCGACAATTTTA-3' 46 158 bp
SpoVG 5'TTCGTGTGATTGATGGAAACA-3' 5'TGCTTCAGTGTCACCCAGAC -3' 46 164 bp
16S r RNA 5'GATCTTAGTTGCCAGCATTC-3' 5'TTACTAGCGATTCCAGCTTC-3' 46 233 bp
160μM and 40μM used in duplicate) were injected with 1.05X HBS-EP+in 5% DMSO buffer
(10 mM HEPES, 150 mM NaCl, 3 mM EDTA, 0.005% surfactant P40, pH 7.4) with flow rate of 30μl/min, contact time 120 sec and dissociation time 300 sec. The interactions were monitored
in a real-time manner by measuring the response unit (RU). A mock surface was also used to see the binding of curcumin to the matrix (CM-5 sensor chip surface) and the analyzed results were subtracted from the blank surface. In addition, we have made solvent correction curve with DMSO (4.5% and 5.8% DMSO) to normalize the results (curcumin was dissolved in 5% DMSO).
Supporting Information
S1 Fig. (A) Growth curve analysis of B. subtilis AH75 in the presence and absence of DMSO.(B) I, II, III are the DIA, DAPI and overlay images in the B. subtilis in the absence of DMSO and IV, V and VI are the DIA, DAPI and overlay images in the B. subtilis in the pres-ence of DMSO
(TIF)
S2 Fig. Differentially expressed proteins identified in DIGE and their 3D and BVA graph views. (A)Differential expression of proteins at 60 min and(B)Differential expression of pro-teins at 120 min.
(TIF)
S3 Fig. S-curve analysis for differential expression protein comparison among technical triplicate runs (Q-TOF data).
(TIF)
S4 Fig. (A) Venn diagram showing the unique and overlapping differentially (both up and down regulated proteins separately) expressed proteins identified by LTQ-Orbitrap and QTOF instruments. (B)Venn diagrams showing the unique and common differentially ex-pressed proteins (total identified proteins) identified in LTQ-Orbitrap and Q-TOF data. (TIF)
S5 Fig. (A) Venn diagram showing the unique and overlapping differential expressed pro-teins among LTQ-Orbitrap, Q-TOF and 2D-DIGE data.(B) Comparison of data between LTQ-Orbitrap and 2D-DIGE (all the identified proteins). In case of 60 min treatment, diami-nopimelate epimerase was identified only in DIGE but not in iTRAQ analysis.
(TIF)
S6 Fig. Venn diagram showing the unique and overlapping proteins among the time point analysis in both LTQ-Orbitrap and Q-TOF data.
(TIF)
S7 Fig. Quantitative profiles of the differentially expressed proteins (identified in iTRAQ-based quantitative proteomics analysis using Q-TOF) involved in diverse biological pro-cesses.
(TIF)
S1 Table. MADLI-TOF/TOF identification of the proteins from the differentially expressed spots identified in 2D-DIGE and their sequences information.
(DOCX)
S2 Table. Complete peptide and protein identification and quantitative iTRAQ data ob-tained from LTQ-Orbitrap and Q-TOF and their comparison.
S3 Table. Different biological pathways modulated due to curcumin treatment identified in KOBAS and DAVID analysis.
(XLSX)
S4 Table. Cy dye labelling strategy for curcumin treated and controlB.subtiliscultures for differential proteomics analysis using 2D-DIGE.
(DOCX)
Acknowledgments
We thank the Center for Research in Nanotechnology and Science (CRNTS), Indian Institute of Technology Bombay, for providing the fluorescence activated cell sorting (FACS) facility and LC-MS/MS (Q-TOF) facility. We thank Department of Biosciences and Bioengineering, Indian Institute of Technology Bombay, for providing MALDI and SPR facility. We sincerely thank Dr. Richard Losick (Harvard University, Cambridge, MA) for providing us theB.subtilis
AH75 strain.
Author Contributions
Conceived and designed the experiments: PJR DP S. Srivastava. Performed the experiments: PJR S. Sinha. Analyzed the data: PJR S. Sinha S. Srivastava DP SR. Contributed reagents/mate-rials/analysis tools: S. Srivastava DP RS SD GJS AC TSKP. Wrote the paper: PJR SR DP S. Srivastava.
References
1. Christian KA, Ijaz K, Dowell SF, Chow CC, Chitale RA, et al. What we are watching—five top global
in-fectious disease threats, 2012: a perspective from CDC's Global Disease Detection Operations Center. Emerg Health Threats J. 2013; 6: 20632. doi:10.3402/ehtj.v6i0.20632PMID:23827387
2. Butler MS. Natural products to drugs: natural product derived compounds in clinical trials. NatProdRep. 2005; 22: 162–195.
3. Aggarwal BB, Kumar A, Bharti AC. Anticancer potential of curcumin: preclinical and clinical studies. An-ticancer Res. 2003; 23: 363–398. PMID:12680238
4. Sharma OP. Antioxidant activity of curcumin and related compounds. BiochemPharmacol. 1976; 25: 1811–1812. PMID:942483
5. Sun D, Zhuang X, Xiang X, Liu Y, Zhang S, et al. A novel nanoparticle drug delivery system: the anti-in-flammatory activity of curcumin is enhanced when encapsulated in exosomes. MolTher. 2010; 18: 1606–1614. doi:10.1038/mt.2010.105PMID:20571541
6. Ragunathan I, Panneerselvam N. Antimutagenic potential of curcumin on chromosomal aberrations in Allium cepa. JZhejiangUniv SciB. 2007; 8: 470–475.
7. Ribeiro AP, Pavarina AC, Dovigo LN, Brunetti IL, Bagnato VS, et al. Phototoxic effect of curcumin on methicillin-resistant Staphylococcus aureus and L929 fibroblasts. Lasers MedSci. 2013; 28: 391–398.
doi:10.1007/s10103-012-1064-9PMID:22358772
8. Hegge AB, Nielsen TT, Larsen KL, Bruzell E, Tonnesen HH. Impact of curcumin supersaturation in anti-bacterial photodynamic therapy—effect of cyclodextrin type and amount: studies on curcumin and
cur-cuminoides XLV. JPharmSci. 2012; 101: 1524–1537.
9. Sa G, Das T. Anti cancer effects of curcumin: cycle of life and death. Cell Div. 2008; 3: 14. doi:10.1186/ 1747-1028-3-14PMID:18834508
10. Perry MC, Demeule M, Régina A, Moumdjian R, Béliveau R. Curcumin inhibits tumor growth and angio-genesis in glioblastoma xenografts, Mol Nutr Food Res. 2010; 54: 1192–1201. doi:10.1002/mnfr.
200900277PMID:20087857
11. De R, Kundu P, Swarnakar S, Ramamurthy T, Chowdhury A, et al. Antimicrobial activity of curcumin against Helicobacter pylori isolates from India and during infections in mice. AntimicrobAgents Che-mother. 2009; 53: 1592–1597. doi:10.1128/AAC.01242-08PMID:19204190