Overseas fi sh is either directly treated on boats before being frozen or directly frozen, then treated in the factory after being unloaded. At the factory, the
thawing of that fi sh is an essential step in its
trans-formation and treatment; the quality of the texture is directly related to the quality of thawing. During this
ULTRASONIC MONITORING OF FISH THAWING PROCESS OPTIMAL
TIME OF THAWING AND EFFECT OF FREEZING/THAWING
Youssef Ait El Kadi
1, Ali Moudden
1, Bouazza Faiz
1, Gerard Maze
2,
Dominique Decultot
21Laboratory of Metrology and Data Processing, Ibn Zohr University
B.P. 8106 Agadir, Morocco
2Ultrasonic Laboratory of Acoustics and Electronics, University of Le Havre
76610 Le Havre, France
ABSTRACT
Introduction. Fish quality is traditionally controlled by chemical and microbiological analysis. The non-de-structive control presents an enormous professional interest thanks to the technical contribution and precision of the analysis to which it leads. This paper presents the results obtained from a characterisation of fi sh thaw-ing process by the ultrasonic technique, with monitorthaw-ing thermal processthaw-ing from frozen to defrosted states.
Material and methods. The study was carried out on fi sh type red drum and salmon cut into fi llets of 15 mm thickness. After being frozen at –20°C, the sample is enclosed in a plexiglas vessel with parallel walls at the ambient temperature 30°C and excited in perpendicular incidence at 0.5 MHz by an ultrasonic pulser-receiver Sofranel 5052PR. the technique of measurement consists to study the signals refl ected by fi sh during its thaw-ing, the specifi c techniques of signal processing are implemented to deduce informations characterizing the state of fi sh and its thawing process by examining the evolution of the position echoes refl ected by the sample and the viscoelastic parameters of fi sh during its thawing.
Results. The obtained results show a relationship between the thermal state of fi sh and its acoustic proper-ties, which allowed to deduce the optimal time of the fi rst thawing in order to restrict the growth of microbial
fl ora. For salmon, the results show a decrease of 36% of the time of the second thawing and an increase of
10.88% of the phase velocity, with a decrease of 65.5% of the peak-to-peak voltage of the signal refl ected, thus a decrease of the acoustic impedance.
Conclusions. This study shows an optimal time and an evolution rate of thawing specifi c to each type of fi sh and a correlation between the acoustic behavior of fi sh and its thermal state which approves that this tech-nique of ultrasonic monitoring can substitute the control using the destructive chemical analysis in order to
monitor the thawing process and to know whether a fi sh has suffered an accidental thawing.
Key words: ultrasound, non-destructive control, acoustic behavior, thermal state, optimal time of thawing, phase velocity, wave attenuation
process there is a risk of the growth of microbial fl ora and loss of liquid containing proteins, soluble vitamins and mineral; thawing must be carefully made to
guar-antee the quality of fi sh texture. For several
industri-alists, and given the results obtained from the exist-ing processes of control, this operation remained still too delicate. Indeed, if the slow thawing in the open air (3°C) appears extremely respectful to the product quality, its excessive duration (between 24 and 72 hours) cannot satisfy the productivity requirements. Although the creation of the cabinet for thawing has become imposed in order to reduce the time of this cy-cle, the corresponding process, too fast (between 1 to 6 hours), also has inconveniences; Thawing through circulation of cold water (10°C) leads to an over con-sumption of water and an important crossed risks of contamination [Brent et al. 2004]. The fast thawing in warm pulsed air (between 25 and 35°C) fails to pre-vent the degradation of tissue component of the treated
fi sh. Hence the industrialists have to fi nd a technical
solution, allowing to control and to well master the thawing process; that is, to determine the conditions and the optimal thawing time. Ultrasonic method is perfect to assure such control over many traditional analytical techniques [Awad et al. 2012]. The meas-urements are non-destructive, precise, fast and fully automated and can be made on-line. In addition, it is possible to analyse optically opaque samples without the need of extensive sample preparation [Bamberger and Greenwood 2004, Norlida et al. 2011, Dolatow-ski et al. 2007]. Low intensity ultrasound was used to provide information about the physicochemical
prop-erties of fi sh [Coupland 2004, Keshava and Ramana
2003]. Phase velocity and wave attenuation were used to characterise the structure and salmon composition [Shannon et al. 2004]. This study proposes the use of the ultrasonic analysis to characterise the evolution of thawing in order to deduce the optimal time and to monitor the effect of an accidental refreezing.
CONTROL METHODOLOGY
Experimental device
The experimental device (Fig. 1) consists of: An ul-trasonic pulser-receiver Sofranel 5052PR. A broad-band ultrasonic transducer (with a center frequency of
0.5 MHz and a diameter of 20 mm). A digital storage scope model HP54600B. A computer equipped with a card type Keithley GPIB IEEE-488 for acquisition of
signals refl ected by the fi sh during its thawing.
An electronic thermometer connected to the com-puter allows to record the temperature at the center of the sample. A samples holder immersed in a water tank realizing the coupling between the transducer and
the sample, without contact between fi sh and water.
Description of the measurement technique
The measurement technique used is based on a system-mode ultrasonic pulse echo at perpendicu-lar incidence of a low intensity with a pulse width of
2 μs, repeated at 5 kHz, at an intensity of 30 mW·cm-2.
The transducer alternately acts as a transmitter and a receiver i.e. the monostatic method. The electri-cal signal of piezoelectric transducer is constituted of pulses generated with a repetition period adjust-able by the pulse generator. This period is chosen to avoid overlap between the end of the response and the beginning of the next pulse on the one hand, and to not introduce spurious echoes on the other hand.
The refl ected pressure is sensed by the transducer.
The received signal passes through the same cable as the transmission signal and enters the connector T/R of generator from which the broadcast signal has been sent. Through a delay system integrated in the pulse generator, the signal is displayed on the digi-tal scope. The latter is being connected to a computer by the IEEE through a capture card for the treatment
of the signal refl ected by fi sh. The recording of the
temperature at the center of the sample fi sh during thawing is ensured by an electronic thermometer con-nected to the computer.
The principle of the technique control is to study
the signals refl ected by fi sh initially frozen at a
tem-perature of –20°C. The specifi c techniques of signal
processing are implemented to deduce information
characterising the state of fi sh and its thawing process
by examining the evolution of the position echoes
re-fl ected by the sample and the viscoelastic parameters
of the fi sh during its thawing.
Preparation of fi sh sample: Frozen fi sh
All given the extreme diversity of fi sh types
(dif-ferent qualities and constitutions), the effi ciency of
experiments, and the generalization of the results, require manipulation of several types. The experi-ments were performed on two types: the red drum and
salmon. Fresh fi sh, is cut into fi llet form of 15 mm
thick, and is identifi ed according to its type and
num-ber of cycles of freezing/thawing and then stored in a freezer at –20°C. After being frozen, the sample to be analysed is enclosed in a plexiglas vessel with parallel walls at the ambient temperature 30°C, and whose wall thickness is 20 mm. This thickness is
cho-sen in order to allow the separation of the refl ected
echoes.
Treatment response
As previously mentioned, the refl ection control
technique was used to monitor the acoustic response during the thawing process with monitoring the evo-lution of temperature at the center of the sample. The data acquired by the computer were processed and presented in lines graph that shows:
• evolution of the temperature in the center of the sample
• acoustic response and evolution of the echoes position
• evolution of the amplitude and spectrum of the echoes
• the evolution of the phase velocity of the wave. Analysis of this lines graph shows the evolution
rate and the optimum time of thawing for each fi sh
type studied, and according to the number of cycles of thawing.
RESULTS AND DISCUSSION
Ultrasound response
The implemented method allows to track the
evo-lution signals refl ected by the target constituted by the
fi sh during its thawing. This is to draw an ultrasonic
echo graph showing the evolution of the position and
spectrum of refl ected echoes, to deduce the evolution
rate and the time just needed for thawing. These values will be compared to values provided by the thermal approach of the problem which consists of monitoring
the temperature at the center of the fi sh. The sample is
excited perpendicularly to its plane by a transducer of frequency 0.5 MHz. The incident signal path is shown in Figure 2.
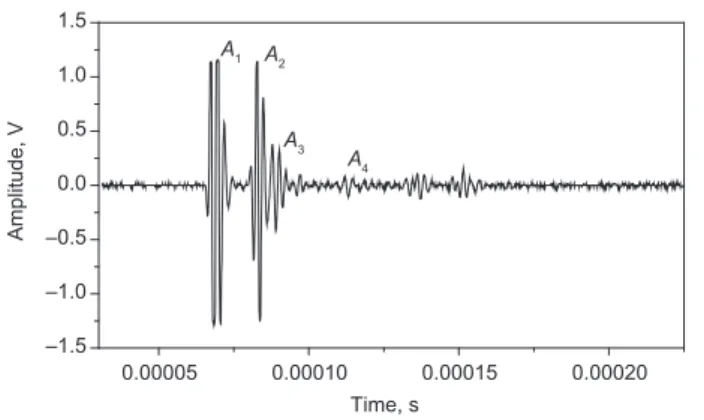
The refl ected signal includes two parts. The fi rst
part is composed of three echoes:
• A1, echo related to the specular refl ection of the
in-cident beam at the interface between water and the
fi rst face plate of the vessel walls.
• The second echo A2 corresponding to the refl ection
on the interface between the second face plate and
fi sh.
• The third echo A3 corresponding to the refl ection
on the interface between the thawed and the still-frozen fi sh part.
The second part is composed of two echoes, having all
crossed the fi sh in back and forth:
• The echo A4 corresponds to the refl ection at the
inter-face between the defrosted and the still frozen fi sh.
• A5 corresponds to the refl ection at the interface
be-tween fi sh and the second plate of plexiglas.
Figures 3 and 4 present a typical waveform of
the ultrasonic signal refl ected by a sample of the red
drum 15 mm thick at the beginning and at the end of thawing.
The superposition of these refl ected signals allows
to follow the evolution of the position of the bottom
echoes (A3 and A5), this allows to control the cycle of
thawing. Figures 5 and 6 present, in the form of echo
graphs, the evolution of the signal refl ected by the red
drum during its fi rst and second thawing. The position
of the interface plexiglas/fi sh echo A2 does not evolve
except at the beginning; this is due to thermal shock received by the plate of plexiglas at the moment of
contact with the frozen fi sh.
At the beginning, there is an overlapping of echoes A2 and A3. The beginning of the fi rst and second thawing
is marked by evolution of the position of the echo A3;
this is after 10 minutes (5 min for the second thawing).
The bottom echo A5 appears after 50 minutes (40 min
for the second thawing) which marks the end of the
thawing. A5 echo stabilizes at 80 minute (about 70 min
for the second thawing); the evolution rates of the fi rst
and the second thawing are quite different.
Control of the phase velocity
The principle of the control method is to plot the
refl ected frequency spectrum by calculating the Fast
Fourier Transform of the refl ected signal portion
0.00005 0.00010 0.00015 0.00020
–1.5 –1.0 –0.5 0.0 0.5 1.0 1.5
A4
A3
A2
A1
Amplitude, V
Time, s
Fig. 3. At the beginning of the thawing, there is an overlap-ping of echoes A2 and A3
0.00005 0.00010 0.00015 0.00020
–1.5 –1.0 –0.5 0.0 0.5 1.0 1.5
Amplitude, V
Time, s
A5
A2
A1
Fig. 4. At the end of the thawing, there is a disappearance of A3 and appearance of A5
0 5 10 15 20 25 30 35 40
0
20
40
60
80
100
120
Time, μs
Time of thawing, min
A3
A2 A5
Fig. 5. Evolution of the echoes position of the signal
re-fl ected by the red drum during its fi rst thawing
0 5 10 15 20 25 30 35 40
0
20
40
60
80
100
120
Time, μs
Time of thawing, min
A3
A2 A5
Fig. 6. Evolution of the echoes position of the signal
located in the measurement window between echo A2
and A5. The longitudinal phase velocity cL is expressed
according to Shannon et al. [2004] by:
cL = 2lω
φA5 – φA2
Where ω = 2πf is the pulsation of the wave and l is the
thickness of the sample.
» ¼ º « ¬ ª
R2(Ȧ) I2(Ȧ)
ijA2 = Arc tan »¼
º « ¬ ª
R5(Ȧ) I5(Ȧ) ijA5 = Arc tan
Here, R2, R5 are the real and I2, I5 are the imaginary
parts of the echoes A2 and A5. Figure 7 presents the
frequency spectrum of the isolated bottom echo A5
re-fl ected by the red drum at the end of its fi rst thawing.
This spectrum presents the minimums values that are regularly spaced; these troughs are due to excita-tion of longitudinal vibraexcita-tion in the sample. The
fre-quencies fL where these minimums are correspond to
an integer number of half-wavelength of the longitudi-nal wave in the sample. We infer:
l cL fL = p
2
(2)
Where p is the order of appearance of a trough, cL is
the phase velocity, and l is the thickness of the sample.
Hence the phase velocity is:
cL = 2lΔfL (3)
The superposition of the refl ected signals spectra
during thawing allows to monitor the position of its minima, hence we can follow the evolution of the
phase velocity of the wave in fi sh. Figure 8 shows an
echo graph of the evolution of the signal spectrum
re-fl ected by a sample of red drum, 15 mm thick, excited
by a transducer with a center frequency of 500 KHz
during its fi rst thawing.
Thermal behaviour
The ultrasonic control of thawing process is done simultaneously with monitoring the temporal and
spa-tial evolution of temperature in fi sh; the objective is to
approve a relationship between the acoustic behaviour
of fi sh and its thermal state. The sample of fi sh fi llet
that is a large and is 80 mm long and 15 mm thick,
ini-tially frozen at a temperature T = 20°C assumed to be
uniform, is enclosed in a rectangular vessel. The set is immersed in a tank containing the water at a constant
ambient temperature Ta = 30°C.
The recording of the temperature of the sample studied is assured by a digital thermometer connected to the computer. Figure 9 shows the evolution of the temperature at the center of a sample of red drum dur-ing its fi rst thawing.
This evolution stabilizes for a while around 0°C. This is due to a decrease in the thermal conductivity of
the fi sh when the parts of ice become transformed to
water; furthermore the thermal conductivity l depends on the temperature [Archer et al. 2008, Hobani 2005, Tamene 2009].
0.00 0.13 0.25 0.38 0.50 0.63 0.75 0.88 1.00 0.00
0.01 0.02 0.04 0.05 0.06 0.07 0.09 0.10 0.11
Frequency, MHz
Amplitude, V²
Fig. 7. Typical frequency spectrum refl ected by red drum during its fi rst thawing
0.3 0.4 0.5 0.6
0
20
40
60
80
100
120
Frequency, MHz
Time of thawing, min
¨I
L
Case of salmon in the fi rst thawing
The superposition of the signals refl ected by a
sam-ple of salmon allows to control its thawing. Figure 10
presents the evolution of ultrasonic signal refl ected by
salmon during its fi rst thawing.
Echo A3, one of the interesting echoes, appears after
10 minutes. Its position evolves gradually during the thawing; as we can intuitively imagine, the thawing oc-curs from the outside to the center of the sample. This
echo A3 disappears at 40 minutes. This marks the end
of thawing. This echo is related to the bottom of the sample, its position and its magnitude change before stabilizing at 80 minutes. The evolution of the position
of this echo refl ects the variation of the phase velocity
of the wave in fi sh; this is due certainly to the thawing
process of fi sh. The bottom echo is stabilized when the
temperature of the fi sh is near the ambient temperature.
The measure of the amplitude of echo A2, echo
re-fl ected in the interface plate/fi sh, and that of the
bot-tom echo A5, evaluates the attenuation and therefore
the acoustic impedance of the sample of fi sh during
thawing. The attenuation is expressed by:
» ¼ º «
¬ ª
í A ȟref
2(Ȧ) A5(Ȧ) ln
2L 1
Į(Ȧ) = (4)
With
4ZpgZfish
(Zpg + Zfish)2
= ȟref
Zpg: acoustic impedance of plexiglas. Zfi sh: acoustic
im-pedance of fi sh. Figure 11 shows the evolution of the
peak-to-peak voltage of the bottom echo A5 and the
temperature at the center of the salmon during its fi rst
thawing.
This evolution is characterised by three distinct
re-gimes: During the fi rst minutes, the amplitude of the
echo is very low; giving strong acoustic impedance, this is at low temperatures. Between 30 minutes and 60 minutes, there is an abrupt increase in the amplitude of the signal with a stagnant form of temperature around 0°C: This is the moment of transformation of the ice to water beyond 60 minutes there is a gradual decrease in amplitude of the echo and a rise of temperature of
0 25 50 75 100 125 150
–20 –10 0 10 20 30
Time, min
Temperature, °C
Fig. 9. Evolution of the temperature of the red drum during its fi rst thawing
0 5 10 15 20 25 30 35 40
0
20
40
60
80
100
120
Time, μs
Time of thawing, min
A3
A2 A5
Fig. 10. Evolution of the signal refl ected by salmon during the fi rst thawing
0 25 50 75 100 125 150
0.0 0.1 0.2 0.3 0.4
Amplitude
Time, min
Amplitude, V
–20 –10 0 10 20 30
Temperature
Temperature, °C
the sample before reaching the steady state when the temperature is near to 30°C. This proves that there is a correlation between the acoustic behaviour and
ther-mal state of the fi sh during its thawing.
Salmon in the second thawing
The second thawing of salmon (Fig. 12) is charac-terised by a more important evolution rate than that of
the fi rst thawing (Fig. 10).
The second thawing of salmon already starts at the beginning of the experiment (after 10 min for the
fi rst thawing), and already ends at 25 minutes (40 min
for the fi rst thawing); the fi rst and second thawings of
salmon are completely different. This is due to the loss
of fl uids (particularly the water, proteins and mineral
salts) during the fi rst thawing. The evolution of the
peak-to-peak voltage of the bottom echo A5 is shown
in Figure 13.
Compared with the fi rst thawing, we observed
a faster evolution rate of the second thawing, and an
increase of the amplitude of the refl ected signal,
there-fore a decrease of the attenuation thus that of acoustic
impedance; that refl ects the changing of the fi sh
com-position. This is due to the loss of liquid containing proteins and mineral salts.
The simultaneous monitoring of the temperature of the sample, the peak-to-peak voltage of the bottom echo, and the phase velocity of the wave in the sample gives the waveforms of Figures 14 and 15.
0 5 10 15 20 25 30 35 40
0
20
40
60
80
100
120
Time, μs
Time of thawing, min
A3
A2 A5
Fig. 12. Evolutio n of the signal refl ected by salmon during his second thawing
0 25 50 75 100 125 150
0,0 0,1 0,2 0,3 0,4 0,5 0,6 0,7
First thawing Second thawing
Amplitude, V
Time, min
Fig. 13. Evolution of the peak-to-peak voltage of the sig-nal refl ected by a sample of salmon
0 25 50 75 100 125 150
1340 1360 1380 1400 1420
Amplitude
Time, min
Phase velocity, m·s
-1
–20 –10 0 10 20 30
Phase velocity
Temperature, °C
Fig. 14. Temperature and phase velocity of wave refl ected by salmon during the fi rst thawing
0 25 50 75 100 125 150
0.0 0.1 0.2 0.3 0.4
Amplitude
Time, min
Amplitude, V
1340 1360 1380 1400 1420
Phase velocity
Phase velocity, m·s
-1
The maximum of magnitude corresponds to a phase
velocity of 1342 m·s-1 which corresponds to that of fi sh
before freezing (fresh fi sh): At this point, the thawed
fi sh behaves like fresh fi sh. The increase in phase
ve-locity from this point is due to the increase of tempera-ture of fi sh.
The Figure 16 presents the phase velocity of
salm-on during the fi rst and second thawings.
There is a relative increase in phase velocity during the second thawing; this variation appears to be a good
indicator of the deterioration of the fi sh quality which
due to the loss of liquid containing proteins. The fol-lowing Tables 1 and 2 summarize the phase velocity,
amplitude, and time of the fi rst and second thawings.
Table 1. Time of the fi rst and of second thawing
Start of thawing min (evolution of A3)
End of thawing min (appear of A5)
Red drum in the 1st thawing
10 50
Red drum in the 2nd thawing
05 40
Salmon in the 1st thawing
10 40
Salmon
in the 2nd thawing
06 25
0 25 50 75 100 125 150
1340 1360 1380 1400 1420 1440 1460
1340 1360 1380 1400 1420 1440 1460 First thawing
Second thawing
Time, min
Phase velocity, m·s
-1
Fig. 16. Phase velocity of the ultrasonic wave in salmon during the fi rst and the second thawing
Table 2. Amplitude of echo and phase velocity
Amplitude of the echoes A5
at the end of thawing, V
Phase velocity at the end of thawing
m·s-1
Red drum in the 1st thawing
0.33 1 442.3
Red drum in the 2nd thawing
0.58 1 538.5
Salmon in the 1st thawing
0.25 1 401.9
Salmon in the 2nd thawing
0.62 1 554.4
CONCLUSION
The ultrasonic technique for control thawing
pro-cess of fi sh is based on the temporal and frequency
analysis of the signal refl ected by the fi sh during its
thawing. The monitoring evolution of the position,
amplitude and frequency spectrum of refl ected echoes,
allows to follow the evolution rate of thawing and to show the effect of an accidental thawing.
The results of this study show a decrease of time of the second thawing (36%) and an optimal time and
evolution rate of thawing specifi c to each type of fi sh
thus avoiding the risk of microbial growth. The
mag-nitude of the bottom refl ected echo is a good indicator
to see if fi sh has suffered an accidental thawing; the
increase of this magnitude refl ect the adverse effect
of freezing/thawing on the quality of the fi sh texture.
The monitoring of the viscoelastic parameters of the
sample of fi sh studied is done simultaneously with
tracking of variation of temperature; this shows a
cor-relation between the acoustic behaviour of fi sh and its
thermal state, whence the possibility to substitute the thermal control of thawing by the ultrasonic technique to insure a direct, precise and online control of
qual-ity of all fi sh treated, instead being limited to
chemi-cal and microbiologichemi-cal analysis of a single sample of line production. It would be interesting, following this study, to use the ultrasonic technique to analysis of
freshness of different types of fi sh in order to establish
a database for each type to check whether fi sh has
ACKNOWLEDGEMENTS
This work is realised under the partnership between the Laboratory of Metrology and Information Process-ing, LMIP, Ibn Zohr University Agadir-Morocco, and the Laboratory of Acoustics and Ultrasonic Electron-ics, LAUE UMR CNRS 6068, University of Le Havre France. The authors wishes to thank all the members of these laboratories.
REFERENCES
Archer M., Edmonds M., George M., 2008. Seafood thaw-ing. Campden and Chorleywood Food Research Asso-ciation, Research and Development Department SR598 February 2008.
Awad T.S., Moharram H.A., Shaltout O.E., Asker D., Youssef M.M., 2012. Applications of ultrasound in anal-ysis, processing and quality control of food: A review. Food Res. Int. 48, 2, 410-427.
Bamberger J.A., Greenwood M.S., 2004. Non-invasive characterization of fl uid foodstuffs based on ultrasonic measurements. Food Res. Int. 37, 621-625.
Brent A., Spring S., Ferruh E., Singh R.P., 2004. Thawing and freezing of selected meat products in household re-frigerators. Int. J. Refrig. 27, 63-72.
Coupland J.N., 2004. Low intensity ultrasound. Food Res. Int. 37, 537-543a.
Dolatowski Z.J., Stadnik J., Stasiak D., 2007. Applications of ultrasound in food technology. Acta Sci. Pol., Tech-nol. Aliment. 6 (3), 89-99.
Hobani A., 2005. Determination of thermal conductivities of some fi sh types. J. Saudi Soc. Agric. Sci. 4 (2), 83-94. Keshava Prakash M.N., Ramana K.V.R., 2003. Ultrasound
and its application in the food industry. Food Sci. Tech-nol. 40, 563-570.
Norlida B., Ringgau D., Zainuddin M., Zunairah H.M., 2011. Non-destructive fi sh fat detection using infrared Sensor. In: International Conference on Food Engineering and Biotechnology. IPCBEE vol. 9, IACSIT, Singapoore. Shannon R.A., Prabert-Smith P.J., Lines J., Mayia F., 2004.
Ultrasound velocity measurement to determine lipid content in salmon muscle; the effect of myosepta. Food Res. Int. 37, 611-620.
Sigfusson H., Ziegler G.R., Coupland J.N., 2004. Ultrasonic monitoring of food freezing. J. Food Eng. 62, 263-269. Tamene Y., 2009. Simulation of transient heat transfer. J.
Renew. Ener. 12, 1, 117-124.
Received – Przyjęto: 13.02.2013 Accepted for print – Zaakceptowano do druku: 4.04.2013
For citation – Do cytowania