Março, 2019
Ana Maria Fazeres Ferreira
[Nome completo do autor]
[Nome completo do autor]
[Nome completo do autor]
[Nome completo do autor]
[Nome completo do autor]
[Nome completo do autor]
[Nome completo do autor]
Licenciada em Ciências da Engenharia Eletrotécnica e de Computadores [Habilitações Académicas] [Habilitações Académicas] [Habilitações Académicas] [Habilitações Académicas] [Habilitações Académicas] [Habilitações Académicas] [Habilitações Académicas]
Provision of Personalized Services in
Collaborative Environment
[Título da Tese] Dissertação para obtenção do Grau de Mestre em Engenharia Eletrotécnica e de Computadores
Dissertação para obtenção do Grau de Mestre em [Engenharia Informática]
Orientador: Professora Doutora Ana Inês da Silva Oliveira, Professora Auxiliar
Convidada da Faculdade de Ciências e Tecnologia da Universidade
Nova de Lisboa
Júri:
Presidente: Prof. Doutor André Teixeira Bento Damas Mora – FCT/UNL Arguente: Prof. Doutora Filipa Alexandra Moreira Ferrada – FCT/UNL Vogal: Prof. Doutora Ana Inês da Silva Oliveira – FCT/UNL
iii Provision of Personalized Services in Collaborative Environment
Copyright © Ana Maria Fazeres Ferreira, Faculdade de Ciências e Tecnologia, Universi-dade Nova de Lisboa.
A Faculdade de Ciências e Tecnologia e a Universidade Nova de Lisboa têm o direito, perpétuo e sem limites geográficos, de arquivar e publicar esta dissertação através de exemplares impressos reproduzidos em papel ou de forma digital, ou por qualquer ou-tro meio conhecido ou que venha a ser inventado, e de a divulgar através de repositórios científicos e de admitir a sua cópia e distribuição com objetivos educacionais ou de in-vestigação, não comerciais, desde que seja dado crédito ao autor e editor.
v
vii
Acknowledgements
I finally see the finish line. But I have never been alone. And because you helped me to get here, I want to recognize your importance.
- To Professor Ana Inês da Silva Oliveira for accepting to be my supervisor and for giving me a boost of strength to carry on. Without her, this work wouldn’t have been possible, and who knows if I would be here
- To Engineer Thais Andrea Baldissera, for the enthusiastic way she introduced me and got me into the world of “collaborative business ecosystem for elderly care”
- To Rute Xavier, for the always quick answers, helping in and solving questions that seemed to have no possible answer
- To Pedro, who spent so many hours with me, thinking out loud, arguing, writing and erasing. Together we built and we celebrated all the little victories. Until we got here - To Edna, Sara, and Vasco, but also to my other faculty colleagues who, through-out these years made a difference in my life
- To the group that have watched me grow up and that has been so supportive in this entire journey – David, Francisca, Gonçalo, Inês, Joana, Mariana, Paulinha, Rita, Rosário, Sara, Tiago
- To the Bounce gang, who welcomed me so well and who have been fundamental for my mental health
- To Rita, for all the times we talked, shared, for the understanding and for your availability
- To Sara, who never once doubted me and, even at a distance, always told me I would be able to overcome everything
- To my father, for teaching me to love sciences - To my brother Pedro, for teaching me to love Math - To my mother, for teaching me to love people
- To my brother João, for helping me to think “out of the box”
- To Sónia, who knows me almost since ever, who, for me, has given up of so many moments that could have been only hers, and who is always there, in constant support
- To Rita, for the confidence she had in me since day 1
- To Tiago, who has been walking this path with me, on and off the college. To-gether we have been growing and building. ToTo-gether we have been fighting. And dis-covering that together we are, indeed, much stronger
- To the seven of you, because you are my rocks. Without you, nothing of these would have been possible.
ix
Abstract
We have been witnessing in the past few years a change in the social paradigm, moving, in just a few dozen years, from a population that used to live less years into one that has increased greatly its life expectancy. This change will imply that the reality of the existing services is also changing, with a much deeper attention being drawn into elderly and their needs.
Because each person is unique and has specific needs and desires, it is very difficult that a single service or service provider can provide this solution in a satisfying manner. So, concepts like cooperation and collaboration, as well as service ecosystems become very important in the answer to the new social needs, becoming possible to provide ad-equate services to every elderly.
The present work is integrated in a PhD research work, in which an ecosystem was conceptualized. That ecosystem has as inputs information regarding elderly people, their care needs, services they require, and the service providers. This ecosystem is man-aged by an ecosystem manager whose responsibility is to gather the information from the different sources and later, upon request, to run the algorithm to find the most ap-propriate solution for an elderly. This work’s goal is to develop an algorithm – named Service Composition and Personalization Environment (SCoPE) - which will evaluate the elderly request and the information that exists regarding the different services and service providers and try to provide several options to that elderly, according to pre-defined criteria. This algorithm is the ecosystem final part.
The answers provided by the ecosystem’s algorithm depend, at each moment, on the information that the ecosystem has. This means that, in case the elderly changes its needs, or in case of the appearance of new services or service providers, the algorithm’s answer may be different. Not only that but also the solutions provided by the algorithm are not meant to be taken as definitive answers for the elderly but as suggestions, so that the elderly may make an informed decision.
In conclusion, the developed work demonstrates that the proposed algorithm can provide consistent results to the ecosystem.
xi
Resumo
Nos últimos anos, tem-se vindo a assistir a uma mudança no paradigma social, já que se passou, no espaço de algumas dezenas de anos, de uma população que vivia me-nos ame-nos para uma população que aumentou em muito a sua esperança média de vida. Esta mudança implica que a realidade dos serviços existentes está também a mudar, com a consequente redobrada atenção para com os idosos e as suas necessidades.
Porque cada pessoa é única e tem necessidades e desejos específicos, será muito difícil que com um único serviço ou fornecedor de serviços se consiga dar uma resposta de forma satisfatória. Assim, conceitos como cooperação e colaboração, bem como ecos-sistema de serviços, tornam-se fundamentais na resposta às novas necessidades sociais, permitindo o fornecimento de serviços adequados a cada pessoa idosa.
Este trabalho está integrado num trabalho de investigação no âmbito de uma dis-sertação de doutoramento em que foi conceptualizado um ecossistema. Esse ecossistema é alimentado por informação relativa a pessoas idosos e suas necessidades, serviços que necessitam e fornecedores de serviços. Este ecossistema é gerido por um administrador do ecossistema cuja responsabilidade é reunir a informação das diferentes fontes e pos-teriormente, após solicitação, correr o algoritmo para obter as soluções mais apropriadas para um idoso. O objetivo deste trabalho é desenvolver um algoritmo, denominado SCoPE (Service Composition and Personalization Environment) – e que irá avaliar o pe-dido do idoso bem como a informação existente relativa aos diferentes serviços e forne-cedores para tentar fornecer hipóteses que satisfaçam o idoso, de acordo com critérios pré-definidos. Este algoritmo é a etapa final do ecossistema.
As respostas que o algoritmo do ecossistema vai gerar dependem, em cada mo-mento, da informação de que o mesmo dispõe. Isto significa que, caso o utilizador mude as suas necessidades, ou caso surjam novos serviços ou fornecedores de serviço, a res-posta que o ecossistema dá pode ser diferente. Para além disso, as soluções dadas pelo ecossistema após correr o algoritmo não pretendem ser encaradas como respostas defi-nitivas, mas sim como sugestões para o utilizador, para que este possa tomar uma deci-são o mais informada possível.
Concluindo, o trabalho desenvolvido demonstra que o algoritmo proposto conse-gue obter resultados consistentes para utilização pelo ecossistema.
xiii
Table of contents
INTRODUCTION ... 1 1.1 MOTIVATION ... 1 1.2RESEARCH CONTEXT ... 2 1.3THESIS’ GOAL ... 8 1.4OUTLINE /STRUCTURE ... 11BACKGROUND AND LITERATURE REVIEW ... 13
2.1CONCEPTUAL BASIS ... 13
2.2NETWORKING, COOPERATION AND COLLABORATION ... 13
2.3COLLABORATIVE NETWORKS ... 16
LOGICAL ARCHITECTURE... 19
3.1FUNCTIONAL MODEL ... 19
3.2FUNCTIONALITIES OF THE ECE... 31
IMPLEMENTATION STRUCTURE ... 33 4.1IMPLEMENTATION TECHNOLOGIES ... 33 4.2MVCMODEL ... 34 4.3PLATFORM IMPLEMENTATION ... 35 4.4ALGORITHM IMPLEMENTATION ... 44 4.4.1 CL Calculation...45 4.4.2 Adherence Calculation ...47 4.4.3 Final Results ...48 VALIDATION ... 49 5.1SCENARIOS ... 50 5.2FUNCTIONALITIES DEMONSTRATION... 63
CONCLUSIONS AND FUTURE WORK ... 81
xv
L
IST OF
F
IGURES
FIGURE 1.1-DEMOGRAPHIC PYRAMID OF THE WORLD IN 1950 ... 3
FIGURE 1.2-DEMOGRAPHIC PYRAMID OF THE WORLD IN 2015 ... 3
FIGURE 1.3-DEMOGRAPHIC PYRAMID OF THE WORLD IN 2050- PREDICTION ... 4
FIGURE 1.4-THE WORLD POPULATION IN 1950,2017 AND 2100 ... 4
FIGURE 1.5-WORLD POPULATION GROWTH 1750-2100 ... 5
FIGURE 1.6-ANNUAL WORLD POPULATION GROWTH RATE (1950-2100) ... 6
FIGURE 1.7-NUMBER OF PERSONS WITH AGE EQUAL OR ABOVE 60 YEARS BY DEVELOPMENT GROUP FROM 1980 TO 2050 ... 6
FIGURE 1.8-NETWORKING BASIC CONCEPTS ... 9
FIGURE 1.9-EXAMPLES OF JOINT ENDEAVOUR ... 10
FIGURE 2.1-CLASSICAL SUPPLY CHAIN ... 14
FIGURE 2.2-CLASSES OF COLLABORATIVE NETWORKS - EXAMPLES ... 16
FIGURE 3.1-ELDERLY CARE ECOSYSTEM BASE MODEL ... 19
FIGURE 3.2-ECE'S SCHEMATIC TREE ... 20
FIGURE 3.3-ECE'S UML USE CASE ... 20
FIGURE 3.4-ECE'S FUNCTIONALITY DIAGRAM ... 21
FIGURE 3.5-CARE NEEDS’ CHARACTERIZATION DIAGRAM ... 23
FIGURE 3.6 -CARE NEED TAXONOMY (CAT) ... 24
FIGURE 3.7-PROVIDER CHARACTERIZATION DIAGRAM ... 26
FIGURE 3.8-SERVICE COMPOSITION AND PERSONALIZATION ENVIRONMENT (SCOPE) ... 26
FIGURE 3.9-ECE'S ALGORITHM SCHEMATIC TREE ... 27
FIGURE 3.10-ALGORITHM'S PROCESS... 28
FIGURE 3.11-ECE'S UML SEQUENCE DIAGRAM ... 29
FIGURE 3.12-ECE'S ENTITY RELATIONSHIP DIAGRAM ... 30
FIGURE 3.13-ECE FUNCTIONALITIES ... 31
FIGURE 4.1–ECE’S HOMEPAGE ... 36
FIGURE 4.2-ADD CUSTOMER ... 36
FIGURE 4.3-NEW CUSTOMER FORM ... 38
FIGURE 4.4-NEW SERVICE ... 39
FIGURE 4.5-NEW SERVICE FORM ... 40
FIGURE 4.6-NEW SERVICE PROVIDER ... 41
FIGURE 4.7-NEW SERVICE PROVIDER FORM ... 41
FIGURE 4.8-PDF CREATED BY THE PLATFORM ... 43
FIGURE 4.9–FRAGMENT OF ALGORITHM'S ENTITY RELATIONSHIP DIAGRAM ... 44
FIGURE 5.1-GENERAL INFORMATION REGARDING JOSÉ MARQUES ... 63
FIGURE 5.2-CARE NEEDS REGARDING JOSÉ MARQUES ... 65
FIGURE 5.3-JOSÉ MARQUES' REQUIREMENTS ... 66
xvi
FIGURE 5.5-NEW SERVICE PROVIDER ADDITION ... 68
FIGURE 5.6-CUSTOMER PERSONALIZATION ... 69
FIGURE 5.7-RUN THE ALGORITHM ... 69
FIGURE 5.8-CUSTOMER'S PROFILE PRESENTATION... 70
FIGURE 5.9-GENERAL SOLUTION ... 71
FIGURE 5.10-ADHERENCE MAXIMIZATION CRITERIA SOLUTION -PDF ... 72
FIGURE 5.11-COST-BENEFIT MAXIMIZATION CRITERIA SOLUTION ... 72
FIGURE 5.12-SERVICE MAXIMIZATION CRITERIA SOLUTION... 73
FIGURE 5.13-CUSTOMER TERESA COSTA'S PROFILE ... 75
FIGURE 5.14-CUSTOMER TERESA COSTA'S GENERAL SOLUTION ... 76
FIGURE 5.15-TERESA COSTA'S GENERAL SOLUTION AFTER THE ADDITION OF A SERVICE PROVIDER ... 77
xvii
List of Tables
TABLE 1.1–EXAMPLES OF SOCIAL NETWORKS FOR SENIORS ... 8
TABLE 3.1–CUSTOMER PROFILE’S ELEMENTS ... 22
TABLE 3.2–SERVICE DESCRIPTION ... 24
TABLE 4.1-COMPARISON BETWEEN DIFFERENT SUPPORT COLLABORATIVE PLATFORMS ... 33
TABLE 4.2-FUZZY LINGUISTIC TERMS FOR CL... 46
TABLE 4.3-PARAMETERS CHARACTERIZING THE FLEXIBILITY LEVEL ... 47
TABLE 5.1-MR.MARQUES' LIFESTYLE TABLE ... 50
TABLE 5.2-MR.MARQUES' REQUIREMENTS TABLE ... 51
TABLE 5.3-MRS.COSTA'S LIFESTYLE TABLE ... 51
TABLE 5.4-MRS.COSTA'S REQUIREMENTS TABLE ... 52
TABLE 5.5-MRS.FORTUNATO'S LIFESTYLE TABLE... 53
TABLE 5.6-MRS.FORTUNATO'S REQUIREMENTS TABLE ... 53
TABLE 5.7-SERVICE AGING WITH SPORT ... 54
TABLE 5.8-SERVICE ONWHEELS... 54
TABLE 5.9-SERVICE WHAT'S ON THE AGENDA? ... 54
TABLE 5.10-SERVICE MENS SANA CORPORE SANO ... 55
TABLE 5.11-SERVICE EATWITHYOU ... 55
TABLE 5.12-SERVICE WALKING AROUND ... 55
TABLE 5.13-SERVICE WE MAKE IT CLOSER ... 56
TABLE 5.14–SERVICE YOUNGBRAINS ... 56
TABLE 5.15–SERVICE WHAT ARE YOU LOOKING FOR ... 56
TABLE 5.16-SERVICE NEVEREATALONE ... 57
TABLE 5.17–SERVICE FOREVER ... 57
TABLE 5.18-SERVICE LET'S GO OUT ... 57
TABLE 5.19-SERVICE PROVIDER FUNHEALTH&LEARN ... 58
TABLE 5.20-SERVICE PROVIDER HERE4U ... 58
TABLE 5.21-SERVICE PROVIDER ASK FOR US ... 58
TABLE 5.22-SERVICE PROVIDER AGING NICELY ... 59
TABLE 5.23-SERVICE PROVIDER FOREVERYOUNG ... 59
TABLE 5.24-SERVICE PROVIDERS REQUIREMENT VALUES ... 59
xix
List of Acronyms
AD – AdherenceCAT – Care Need Taxonomy CL – Closeness
CN – Collaborative Networks CO – Service Coverage Level ECE – Elderly Care Ecosystem MVC – Model View Controller PA – Partial Adherence
PVC – Professional Virtual Community RL – Customer Care Needs Relevance
SCoPE – Service Composition and Personalization Process in Collaborative Environment SP – Service Provider
VBE – Virtual Organization Breeding Environment VO – Virtual Organization
1
Introduction
1.1 Motivation
The world in which we live in has been changing over the past years and certainly this will continue to happen. Nowadays, the world population has reached several bil-lion and what we have been witnessing is a growth in the number of elderly population and a decrease in young people. This means that the reality we knew from years ago in which everything was created with a purpose of being used by the youth, is now shifting into a new reality where elderly population play a centre role in social life.
Regarding that, several concepts need to be addressed such as the differences be-tween cooperation and collaboration, and the definition of the concept of collaborative networks that aim to minimize the difficulties that collaboration between different enti-ties entail. Moreover, the new focus for services that address this new social reality will force them to provide ways for elderly to be thought about as more than just an old person but as someone who wants to remain active for longer. Finally, because every person has its own specific needs and desires, a way for gathering information regarding different companies, in order to allow elderly to make a choice of services that are cus-tomized to their needs, must be found.
This thesis’ goal is to support in providing an answer to the question “How to
pro-vide personalized collaborative care services for elderly in an effective and reliable way?” as
posed by Baldissera et al. (2017), developing an approach to support an algorithm that will be integrated it into an ecosystem, which will gather the information from elderly
2
citizens and different service providers in order to give the most appropriate answer to the elderly requests.
This ecosystem will be managed by an Ecosystem Manager, who will be responsi-ble for gathering the information from different inputs, running the algorithm and using it to provide an answer to an elderly request.
1.2 Research Context
Two hundred years ago there were less than one billion human beings in the world. Today, the UN calculations show that we are already more than 7 billion (Roser & Ortiz-Ospina, 2017). This is the reality the world is facing, and its evolution has been, throughout time, studied so that we know that the results are both concerning and, at the same time, revealing.
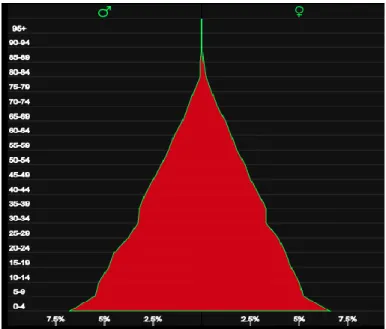
Many animal species’ population has been studied, so it is no surprise that the same has been happening for the human world population with data records that go back, at least, until the 1950’s. The results of those studies are presented in a chart called the demographic pyramid, which intends to demonstrate the distribution of the popu-lation by gender and age gap (Weeks, 2015).
Due to numerous aspects, like wars, famine or prosper times, the demographic pyramid of the world usually varies in every year. However, when we analyse these charts, as far as recent years are concerned, it can be pointed out a clear tendency for the younger population to decrease and the elder population to grow. That new reality needs to be addressed, since it seems obvious that the needs children have are different than the needs of the elderly. More recently, that can be explained as a result of access to more and better food and water, and also because of the increase in knowledge in every area that is relevant to the human life, from medicine to technical aspects.
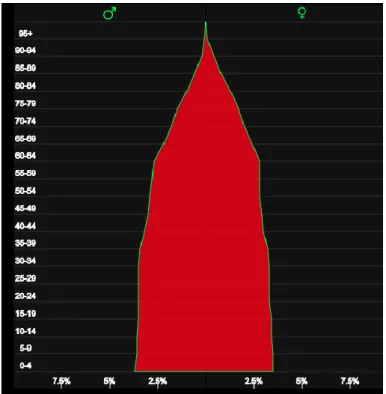
As it can be seen in Figures 1.1, 1.2 and 1.3, the demographic pyramid of the world has been revealing a tendency on one hand of the younger population to decrease and, on the other hand, for the elder population to increase.
3
Figure 1. 1 - Demographic pyramid of the world in 1950 (“World Population Pyramid,”
2019)
Figure 1. 2 - Demographic pyramid of the world in 2015 (“World Population Pyramid,”
4
Moreover, since a graphic using percentages is only able to reveal tendency’s, ra-ther than producing real, measurable results, it is also shown a different pyramid that gathers the result of the population total’s, and also its prediction for 2100, as illustrated in Figure 1.4.
Figure 1. 3 - Demographic pyramid of the world in 2050 - prediction (“World Population
Pyramid,” 2019)
5 This results in different characteristics of the general population in the overall and in having to address different needs that will become more focused on the elderly and less on the young people, as it was a reality about sixty years ago.
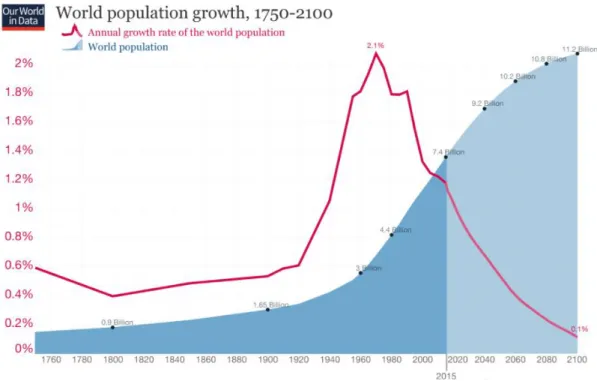
It must also be noted that this increase in population of elderly groups and de-crease in the younger groups does not translate in a dede-crease of world population, as demonstrated in Figure 1.5, because the truth is that the numbers keep growing, even though the rate of growth has been decreasing, it is likely that the population will even-tually start to decrease (Figure 1.6).
6
This means that there will be each time more elderly people, and their specificities must be studied so that they can be better taken care of.
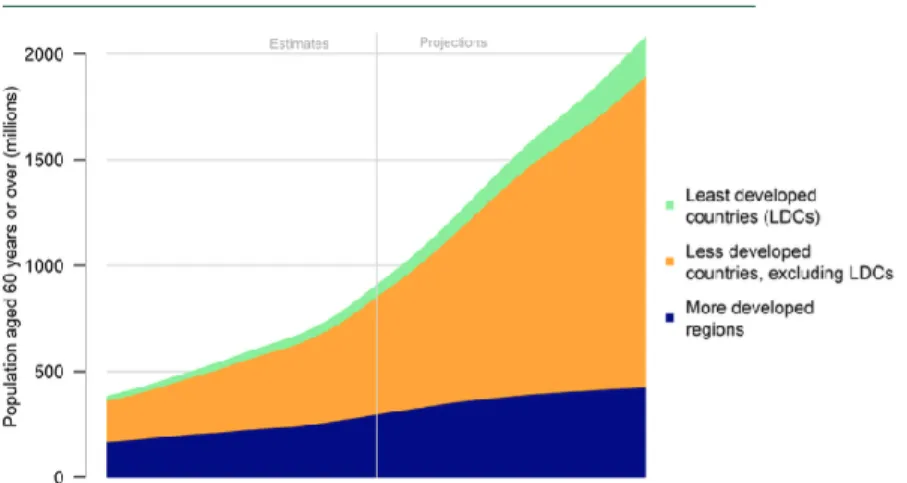
The increasing demographic shift associated to elderly population represents a re-markable fact in the recent history of humanity (Baldissera & Camarinha-Matos, 2018b). From 1980 until 2050, the number of people above 60 years old in the entire world are expected to grow by roughly 300% (Figure 1.7), reaching around 2000 million by 2050.
Figure 1. 6 - Annual world population growth rate (1950-2100) (Roser & Ortiz-Ospina,
2017)
Figure 1. 7 - Number of persons with age equal or above 60 years by development group from 1980 to 2050 (United Nations & Department of Economic and Social Affairs Population
7 With aging, additional care needs are required to preserve seniors healthy and within the standards they expect, in order to maintain their high life quality. One of two things may happen when dealing with the aging process. On the one hand, the most common way to deal with the demands and challenges of the aging process results in the elderly having to move from their home to a close relative’s home (typically a son or a daughter). This results in a severe burden on relatives, not only economically but also because it normally means they will have to change their daily routines. Alternatively, on the other hand those who live by themselves often require caregivers to support them in even simple daily needs. A different person may require different particular care ser-vices according to his/her life situation. Furthermore, elderly people usually show more than one care need, as the aging process typically carries several limitations (Baldissera, Camarinha-Matos & De Faveri, 2017).
In this way, characterizing a person as elderly goes beyond the utilization of age as a determinant factor (Baldissera & Camarinha-Matos, 2018b) because, in fact, singular aging process elements such as living settings, individual capacities and abilities, con-tribute to describing an elderly person. Every elderly individual may require particular services (e.g. care and assistance) to his/her life context. As a result, a specific care ser-vice might be consummately sufficient for an individual and very futile for another.
Therefore, typically, no single service can fully cover the care needs of an individ-ual and this situation suggests the need for service composition (sometimes involving several service providers). Nevertheless, the problem of selecting services and their ser-vice providers, composing a collaborative network for serser-vice delivery, is not a simple task.
There are already some social networks for seniors that try to help them in their specific needs, like the ones in Table 1.1.
8
Table 1. 1 –Examples of Social Networks for Seniors (Baldissera & Camarinha-Matos,
2018b. Adapted)
Name Website
Too Young to Retire www.2young2retire.com
American Association of Retired Persons www.aarp.org
Silver Surfers www.silversurfers.com
60Plus www.60plus.org
Despite being helpful, those social networks are still incomplete since, for example, they lack the possibility to connect with service providers that the elderly would need.
Moreover, there are several elderly’s services companies. The problem is that, in general, it works like this: something happens – an elderly fell, for instance – and he and his family need help right away. By chance, an acquaintance of one member of the family knows or has heard something about a company that provides elderly’s services. The family contacts the company and the collaborator informs that they have a fixed service, with fixed schedules and fixed prices. The elderly and his family have to accept, alt-hough the service is not exactly what the elderly needs, because they don’t have any other option and having a little help is better than having no help at all. In other words, it’s necessary to find a way of join the different services and service providers available, integrate them, when necessary and to facilitate the search of the services that a specific elderly may need. And it’s here where the SCoPE will make the difference, allowing exactly this.
With that in mind, this work will extend the work developed by Baldissera et al. (2017), and try to find an answer to the question “How to provide personalized collaborative
care services for elderly in an effective and reliable way?”
1.3 Thesis’ goal
The goal of this thesis is to provide an answer to the mentioned question by devel-oping a support system to an ecosystem that will have as input information from differ-ent elderly people who have specific needs and requests, and from differdiffer-ent service
9 providers who will try to provide the most appropriate answers to those demands. Af-terwards the ecosystem will have an algorithm that will, according to different criteria, provide possible solutions to the elderly who will, in turn, choose.
Since it has long been proven that a combined effort is likely to produce better results than an individual one, the main question that is in the origin of the present work will be approached based on the schematic of Figure 1.8.
To tackle the problem of being possible to provide the elderly the most appropriate solution that may cover its entire needs, which are different from one person to another, it will be used a Collaborative Network (CN). “A CN is an alliance constituted by a va-riety of entities (e.g. organizations and people) that are largely autonomous, geograph-ically distributed and heterogeneous in terms of their operating environment, culture, social capital and goals but that collaborate to better achieve common or compatible goals, and whose interactions are supported by computer network” (Camarinha-Matos & Afsarmanesh, 2008a).
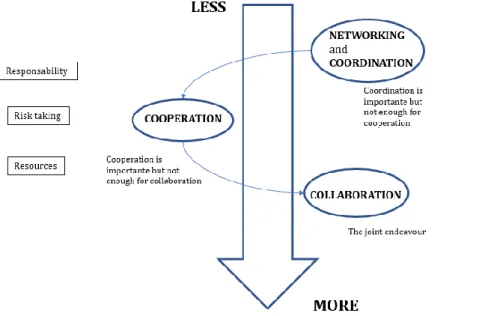
To better understand in depth a CN, there are several concepts that must be known and understood. Camarinha-Matos & Afsarmanesh (2006), define some of the most im-portant concepts in the area of Collaborative Networks, such as Networking (and
10
Coordinated networking), cooperation and collaboration. Networking is what happens when two entities communicate towards a joint goal, cooperation takes place when two entities are working for a common goal, but they only know their part of the responsi-bilities. Finally, collaboration happens when there is full disclosure between two entities working for a similar objective.
The growth in complexity and depth of these different concepts can be seen in Figure 1.9.
An ECE shall include a number of elements, namely the seniors (customers) and their care needs, services and service provider entities, among others (Baldissera et al., 2017). An ECE characterization can thus be performed according to the following focus areas: (a) customer, (b) customer’s care needs, (c) care services and (d) service providers, considering the specificity of each case, because one person may have one or multiple needs or one company may perform several services to a customer.
Regarding the focus on the customer side, one has to take into account that the personalization of a particular service will accomplish its goals better if the user’s profile has more information. To build a customer profile, information such as its geographical area, life style, independent living situation and special conditions will be required to be aware of (Baldissera et al., 2017).
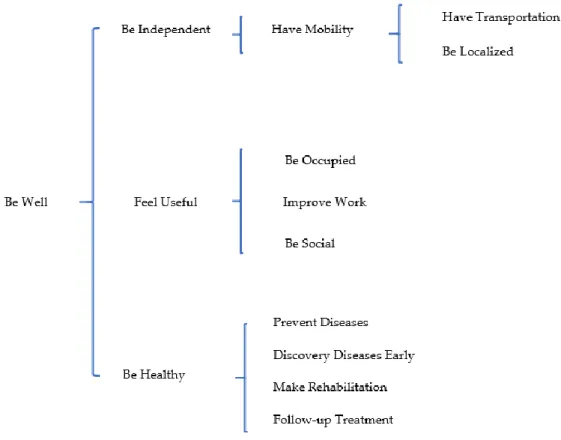
11 Considering the customer’s care needs, they can be divided according to their Tax-onomy (CAT). This means they can be sorted in different areas, since they can be social ones, like needing a ride to go meet friends, they can have health needs like needing someone to remind them to take pills or simply the need may be feeling useful, contrib-uting to the society in general.
The care services and service providers are connected since one of them depends upon the other. With that in mind, the service will need a full description (similarly to the customer) and the service provider will need to have defined some characteristics to help the users understand their scope.
The ECE will be implemented using Laravel. Laravel is a framework intended for web app development.
1.4 Outline / Structure
From this point on, the present thesis will follow the following structure:
Chapter 2 – Background / Literature Review: a review on all the important con-cepts to approach these subjects, such as the difference between cooperation and collab-oration, the definition of collaborative networks and ecosystem.
Chapter 3 – Logical Architecture: a theoretical explanation of the ecosystem will be provided, pointing out the its possibilities.
Chapter 4 – Implementation Structure: all the options from the ecosystem will be explored in detail, providing images of the different possibilities that the ecosystem manager will have.
Chapter 5 – Validation: in this chapter the scenarios used to test the Ecosystem will be thoroughly explained and some images from the Ecosystem usage will be showed.
Chapter 6 – Conclusion and future developments: in the thesis’ final chapter, the conclusions regarding the possibilities of the Ecosystem will be drawn and some sug-gestions regarding future work lines will be made.
13
Background and Literature Review
2.1 Conceptual Basis
Nature has taught us for a long time that most of the things can present better results if they are done in a group. Weather we are talking about small animals who rely on being on a group to have a better chance for survival or talking about big predators who will take advantage of the numbers game in order to hunt their preys, the im-portance of being in a group has seen many different applications throughout time. The idea behind it is the fact that as a group they can take advantage of each other’s best features, in order to achieve the best possible results.
Much like it happens in nature, the same can be seen in any business area since usually each company focus on its own area of expertise and together they produce the best possible product. Regardless of the context, there are several concepts that appear in every area of study’s when we talk about group behaviour such as networking, coor-dinated networking, cooperation and collaboration (den Hartigh & Tol, 2008). For that reason, it is fundamental to be able to fully understand these terms so that they will not be confused.
2.2 Networking, cooperation and collaboration
Networking is a process that involves communication and information exchange for mutual profit (Camarinha-Matos, 2016b). A good example of networking would be found in a blog regarding a product, for example, since everyone will share information
2
2
2
2
14
about the experience (and eventually benefit from one another) but at the same time it is not mandatory that there is a common goal for it. Coordinated networking is different from only networking since besides exchanging information, it involves aligning/alter-ing activities so that more efficient results are achieved. Coordination which may be un-derstood as the act of working well together, is fundamental in collaboration (Camarinha-Matos, 2016b). An example of coordinated networking can be found in gas-oline and diesel selling companies when they adjust the timing of price exchanges so that its impact is not felt by them, like it would happen if only a few of them exchanged the price.
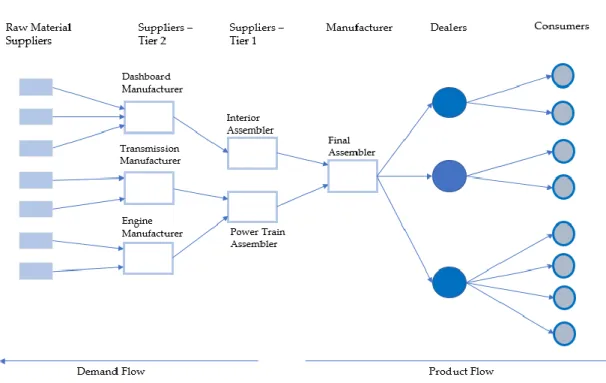
For achieving compatible goals, cooperation presupposes information exchange and adjustments of activities, and also sharing resources. Cooperation is achieved by division of some tasks among participants (Camarinha-Matos, 2016b). A traditional sup-ply chain, based on client-supplier relationships and predefined roles in the value chain, is an example of a cooperative process among its constituents, like it is shown in Figure 2.1.
15 Collaboration is a process in which, by working together, entities share infor-mation, resources and responsibilities, but also risks and rewards, expanding their ca-pabilities. Collaboration implies time and effort and involves mutual engagement of par-ticipants. If desired, it may give the image of a joint identity (Camarinha-Matos & Af-sarmanesh, 2008b). A collaboration process happens, for instance, in concurrent engi-neering, when a team of experts jointly develops a new product (den Hartigh & Tol, 2008). Because of its specificity, collaboration demands some criteria to be met, namely, to talk about collaboration there should exist: a purpose; parts mutually agree to collab-orate; parts keep a model of each other’s capabilities; share a goal and keep some com-mon vision during the process (den Hartigh & Tol, 2008).
Also, as a process, collaboration requires setting a number of generic steps (Giesen, 2002, Camarinha-Matos et al., 2007, Oliveira, Camarinha-Matos & Pouly, 2008):
• Identify parts and bring them together;
• Define the scope of the collaboration and define desired outcomes;
• Define the structure of the collaboration in terms of leadership, roles, re-sponsibilities, ownership, communication means and process, decision making, access to resources, scheduling and milestones;
• Define the policies, for example, handling disagreements/conflicts, ac-countability, rewards and recognition and ownership of generated assets; • Define the evaluation/assessment measures, mechanisms and process; • Identify risks and plan contingency measures;
• Establish commitment to collaborate.
It is also frequent in this field of study to contrast the term collaboration with com-petition. History tells us that competition is a very capable basic scheme for fighting for survival, for instance, when there is sparse of resources. With that in mind, the formation of cooperation and collaboration alliances has emerged to allow more efficient competi-tion against other entities or groups (den Hartigh & Tol, 2008).
Despite these definitions, the distinction between collaboration and cooperation is not always obvious; in fact, in a collaborative network, there are some periods of time with intense collaboration, intercalated with others of partners’ independent work (Camarinha-Matos & Afsarmanesh, 2008b).
16
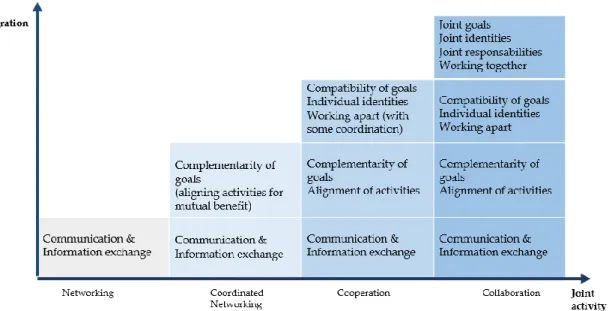
As we walk the path starting in networking and going all the way through to col-laboration, we increase the amounts of common goal-oriented risk taking, commitment and resources that participants must invest into the joint endeavour. So, in this work, we will focus on collaborative networks.
2.3 Collaborative networks
In Collaborative Networks there is a shared belief that together the network mem-bers can accomplish goals that would not be possible or would have a higher cost if attempted by them individually (Camarinha-Matos & Afsarmanesh, 2005). Thus, an agreement between various entities, such as organizations and people, that are broadly autonomous, geographically dispersed and heterogeneous in many aspects, but that col-laborate to accomplish equal or congruent goals and whose communications are sus-tained by computer network constitute a collaborative network (Camarinha-Matos & Afsarmanesh, 2006; Oliveira, Camarinha-Matos & Pouly, 2010).
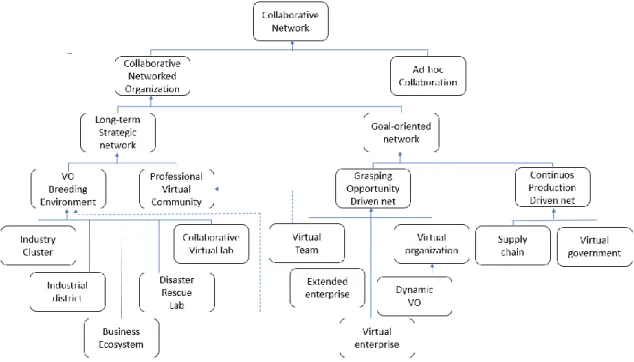
In broad terms, there can be many differences in collaborative networks, like it is demonstrated in Figure 2.2.
Figure 2. 2 - Classes of collaborative networks - examples (Camarinha-Matos &
17 Collaborative Networks can be divided in Ad-hoc Collaboration (more specific) or Collaborative Network Organization (Camarinha-Matos & Afsarmanesh, 2008a). The latter ones can be built as goal-oriented networks, where intense collaboration takes place or as Long-term strategic networks, where cooperation is practiced among their members. Goal-oriented networks may be faced as activities of continuous production provision or as grasping an opportunity (Camarinha-Matos & Afsarmanesh, 2008b). Its examples include, among others, supply chains, virtual enterprise and virtual team.
Networks conducted by continuous manufacturing activities, as supply chains, are a durable network of enterprises, where all partners have defined roles in the manufac-turing value chain, going from the product design and the acquirement of raw materials up until the final product (Camarinha-Matos & Afsarmanesh, 2008b). Networks driven by the goal of taking advantage of a specific opportunity, as virtual enterprises, repre-sent a brief alliance of companies that come together to share abilities or core expertise and resources with the purpose of better respond to business opportunities and whose cooperation is supported by computer networks (Camarinha-Matos & Afsarmanesh, 2008b).Virtual teams are similar to virtual enterprises but formed by humans, instead of organizations.
Examples of Collaborative Network Organizations that come from a long-term strategic network are Virtual Organization (VO) Breeding Environment (VBE) and a Pro-fessional Virtual Community (PVC). A set of enterprises and their related supporting institutions, respecting a base long-term cooperation agreement and accepting of com-mon operating principles and infrastructures with the major aim of rising their readiness towards accelerated composition of brief alliances for collaboration in potential virtual organizations, constitutes a VBE (Camarinha-Matos & Afsarmanesh, 2006).
There are also several different types of VBE, such as Industry Cluster, Industrial district and Business Ecosystem. Industrial Clusters are one of the primordial types of VO breeding environments, consisting of a association of different enterprises, com-monly based in the same geographic region and operating in a common business sector, that keeps some connections with each other so that they can increase their general qual-ity in the larger area (Paytas, Gradeck & Andrews, 2004). Industrial district is similar to the concept of Industry cluster with the difference that it can be focused on a single sector or cover a number of sectors in a given region.
18
A business ecosystem is based on the characteristic mechanisms of biological eco-systems, as these networks try to conserve the specificities, tradition and culture of the local and frequently benefit from government incentives (Camarinha-Matos & Af-sarmanesh, 2008b). A business ecosystem is similar to the Industry cluster and the in-dustrial district, but it is not bounded by one sector.
Companies that act in social domains as health and personal services, must be able to interact in an efficient way with multiple organizations to achieve personalized offers without losing competitiveness and quality in their services (Baldissera et al., 2017).
Considering the reality of the world in which we live, services that attend the needs and desire of the elderly are of growing demand. However, since everyone is dif-ferent, it is rare that one service can fulfil every elderly need. In fact, many health-care providers only have companion services, others have consulting services for helping to manage the elderly finances and others promise to help creating a healthier lifestyle (Too Young To Retire, 2003; AARP, n.d; Silversurfers, 2019; AASC – 60Plus, 2018), but none of them is capable of adequate themselves to all the customer’s care needs, requirements and priorities, so it is appropriate to consider the need for service composition and a Collaborative Network may be the answer that is sought. The aim of this work, following the work of Baldissera et al. (2017), is to develop an algorithm named SCoPE that will be used in a Business Ecosystem, namely an Elderly Care Ecosystem (ECE), to facilitate the search for the elderly people for the services they need to preserve their quality of life. It will organize the information gathered regarding customers, care needs, services and service providers and will afterwards try to provide the closest match possible between customers and their needs and the service providers and the services they provide.
19
Logical Architecture
3.1 Functional model
In order to achieve the most adequate answer to a customer need, focus will have to be put upon customer, care need, service and service provider. For that, the imple-mentation of the ecosystem was grounded in the ecosystem base model proposer by Baldissera et al. (2017), presented at Figure 3.1.
3
3
3
20
The ECE will have a designated manager who will be responsible for gathering the information from the customers and service providers. The manager will also be re-sponsible to fulfil the information regarding the available services and the care needs that will be possible to be addressed. Finally, it will also be the manager’s responsibility to execute the ECE’s algorithm, based on the customer’s request, in order to provide different answers to fulfil the needs. This information is on the ECE’s schematic tree on Figure 3.2 and on the UML use case on Figure 3.3.
Figure 3. 2 - ECE's schematic tree
21 The ECE manager oversees gathering all the different information as it is shown at the ECE’s functionality diagram on Figure 3.4.
It will be possible for the manager to add, remove and to show the data of a specific customer and related care needs. Regarding the care needs, they will be sorted according to their respective taxonomy (CAT), whether they represent a health need or a need to stay active for instance. The manager will be able to add a new care need as they are deemed necessary, remove them, show them and also to show what care needs are as-sociated to specific customers. Regarding the service providers, the ECE manager will be able to add them, show their information, remove them and to reveal what services are attended by a specific service provider. Finally, as far as the services are concerned, the ECE manager will be able to add new ones, show them, remove them, and to find what service providers have a particular service.
The gathering of information only stands for half of the work that the ECE man-ager is responsible for. Not only that, but in a further step, the manman-ager will also be responsible for executing the algorithm when the customer asks for it and to provide him/her with the solution for its characteristics.
22
The ECE working properly will depend in a first glimpse at the proper definition of the senior in need of using the services. In order to achieve that, the customer profile’s elements were defined (Baldissera et al., 2017). Ideally, the more information can be gathered as exemplified in Table 3.1, the better are the chances of providing an appro-priate answer for the need of the senior citizen (Baldissera et al., 2017). It is also very important that the information related to every customer is updated since if, for exam-ple, a customer has a new disease or a new requirement, then that information must be reflected on the ECE in order to assure that, when executing the algorithm, the solution proposed is the ideal one.
Table 3. 1 – Customer profile’s elements (Baldissera et al., 2017. Adapted)
Class Description
Customer Describing the profile of the senior. This element includes typical identification features (e.g. name, birth date, gender, etc.) and elements of general
infor-mation about customer’s daily life. A historical record can enrich the profile.
Geographical Area Representing the customer localization information (e.g. home address, chil-dren´s address, everyday local address, etc.).
Life Style Indicating customer´s individual life style (e.g., how are diary routines, cus-tomer´s likes, and dislikes, cultural aspects, spiritual aspects, etc.). The life style identification contributes to enriching the profile and assist in the search-ing for best services dursearch-ing the personalization and evolution processes.
Independent Living Indicating customer´s independence level (e.g. whether the elderly lives alone, depends on someone, lives on a nurse house, is able to drive or not, goes out alone, etc.).
Recreation Describing customer´s leisure activities frequency (e.g. sports, travels, walks, etc.).
Culture Describing customer´s cultural activities frequency (e.g. favorite movies, thea-tre, kind of museums, preferred games, etc.).
Technology Representing how the elderly deals with technology in his/her daily life (e.g. if she/he is willing to use more technology, enjoys innovations, has a computer, has internet access, has a smartphone, and other technological devices).
Social Indicating customer´s social aspects that capture how the elderly relates with other people (e.g. social networking activity, groups belonging, etc.).
Religion Involving Information about customer´s religious and faith issues that might affect care services (e.g. customer´s belief restrictions, prohibited procedures, etc.).
Personal Data Identification of relevant information about the customer´s environment (e.g. educational and
professional activities, family structure, etc.).
Education Involving education level (e.g. education degree, specialization area, place, etc.).
Profession Describing acquired professional experience (e.g. jobs and positions, if the el-derly is retired or still working, etc.).
Health Dimension related to personal health (e.g. the need of regular medicines, spe-cial equipment, insurance plans, etc.).
Personality Representing customer’s personality profile, behavioral issues which can influ-ence future choices and directions (e.g., status humor, striking characteristics, individual peculiarities, if customer is sociable, moody, rigid, pessimistic, etc.).
23 Family Indicating family structure (e.g. the customer has children, brothers, sisters,
caregivers, best friends, etc.).
Special Conditions Referring to limitations that an elderly might have, namely: human and envi-ronment constraints.
Human Conditions Indicating human limitations covering:
(a) cognitive limitations (e.g. memory and attention loss, personal vulnerabil-ity or deficit of language comprehension, etc.);
(b) physical limitations (e.g. loss of sensitivity on the hands and sensory and motor deficits, etc.);
(c) diseases limitations (e.g. depression, heart issues, diabetes, Alzheimer, etc.).
Environment
Condi-tions Indicating environment limitations comprising: (a) financial limitations (e.g. salary, pension, debts, etc.);
(b) accessibility limitations provided by the physical environment (e.g. high walkability and access to parks and green place, etc.);
(c) security limitations (e.g. no safe transportation, home security loss, etc.).
Guardian Referring to the person responsible as alternative contact for the customer or the one that is responsible for more relevant decisions (e.g. a tutor, a relative, a friend, a caregiver, or combination of them).
Care needs can be measurable or simply desires from the elderly. For instance, a care need can be the need of a senior to go to the hospital to have a treatment and cannot go by himself. On the other hand, a care need can be the desire of going to the coffee and meet his/her friends. Even though that is not a life-threatening condition, it can be a care need desired by a senior citizen. This means that a person can have one or more care needs, and that those should be evaluated according to their relative importance, like presented in the schematic on Figure 3.5.
24
Besides, it is considered that the list of available care needs is pre-defined, and the ones considered for this work are presented in Figure 3.6
Each service that exists in the ECE shall attend one or more care needs and for that, the service on itself must follow a characterization scheme similar to the one on Table 3.2.
Table 3. 2 – Service Description (Baldissera et al., 2017, Adapted) Class Description
Service Representing an atomic or integrated service provided by service provid-ers. A service has a rating provided by the customer and by the ECE
man-agement system. A service can be dependent on another service (e.g. a Health Monitoring service depends on Transportation service that takes the customer to a medical clinic).
Geographic Area Representing localization of service coverage. A service might have one or more geographical coverage area (e.g. Latitude: 38.7071, Longitude: -9.13549, 38 ° 42'26 "North, 9° 8'8" West, about Lisbon).
Business Process Indicating a collection of linked, structured events and tasks that produce a specific service (e.g. to transport the senior to a medical appointment, it is necessary to know the appointment schedule as well as the place of
25
collection and delivery of customer). A service is associated with one or more business processes.
Task Indicating activities executed by business process, corresponding to human or software services (e.g. a nurse applies an injection, device sends a re-minder, etc.).
Trigger Event The action that triggers a service request (e.g. identify current location of senior, verify suitable professionals for the task, etc.).
Service Catalogue Representing a repository of services available on ECE. Services are kept in a catalogue based on four life settings (described earlier) available for consultation when required.
Atomic Service Indicating a service that has a single business process.
Integrated Service Indicating a kind of business service which consists of a combination of several other services that turns into a new service.
Service Integrator Describing an entity that performs service integration. One service may de-pend on another service, or complement it, stimulating services integra-tion.
Application Constraints Indicating a situation in which the service cannot be executed, indicating restrictions (e.g. a service that is not suitable for those with visual impair-ment, for seniors over 90 years old, etc.).
Application Suggestion Indicating a suggestion of service that can strengthen preferences of cus-tomer (e.g. suggestion friendship indicating that the service is appropriated for strengthen friendship ties and its relations, suggestion culture represent-ing that the service strengthens cultural activities, etc.).
Resource Representing capabilities that are required (input) by a service or provided by a service (output). A service can provide a resource (e.g. a Localization service provides a bracelet that can interact with other resources, for in-stance sending alerts to current social network friends nearby). On the other hand, a service can be dependent on a resource (e.g. a Localization ser-vice depends on a smartphone, or a Health Monitoring serser-vice depends on a nurse to measure blood pressure.
ICT Resource Describing information and communication technological resources (e.g. Wi-Fi internet, data analysis tool, etc.).
Domain-Specific Device Describing devices used on a specific domain (e.g. a bracelet, a sensor, etc.). Human Resource Describing human resources (e.g. a nurse, a friend, a driver, etc.).
Report Resource Describing specific data necessary on time (e.g. localization where the ser-vice will be delivered, information about senior ´s humor to suggest activi-ties, etc.).
Service providers are also a very important part of the ECE, since they provide care and assistance services to answer to care needs (Baldissera et al., 2017). In a collab-orative environment, service providers can join with others to provide integrated ser-vices and improved delivery of personalized serser-vices.
The service providers characterization diagram used, was the one proposed by Baldissera et al. (2017) and is shown in Figure 3.7.
26
The service composition and personalization, named SCoPE, will be accomplished in a four-step method that is illustrated in Figure 3.8.
Figure 3. 7 - Provider Characterization Diagram (Baldissera et al., 2017)
Figure 3. 8 - Service Composition and Personalization Environment (SCoPE) (Baldissera & Camarinha-Matos, 2016. Adapted)
27 In the first step, the profile identification is essentially a preliminary step where the identification and demands of the elderly are gathered. In the service pre-selection and filtering, from all the services that are available, will be selected those that cover the identified needs. The appropriate restrictions must be applied so that, for example, a service provider that is 300 km away from the customer will not be selected, even though it is capable of performing the desired service.
The third step will be the service adherence calculation which represents a com-patibility index between the service, customer’s profile and customer’s care needs (Baldissera & Camarinha-Matos, 2016). A larger score in the service adherence will rep-resent a better service personalization for the customer. The final step is the service rat-ing where are included not only the service adherence, as the main contributor, but also financial constraints and management strategies.
When all the information has been gathered in the ECE, the manager will be able to, after a customer’s request, run the ECE’s algorithm in order to provide multiple so-lutions to address the customer needs. For that, the manager will have to identify which customer he wants to work on. Then, he will have to choose one of two options – New Request or the Algorithm itself. The first option will be chosen in one of two scenarios – either the customer is new in the ecosystem and doesn’t have a request yet, or he already has one, but he wants to change it. The second one will run the SCoPE. This schematic tree is show on Figure 3.9. Afterwards it will be up to the customer to choose the pre-ferred solution.
28
The ECE’s algorithm will start by making an initial selection in all the possible service providers, keeping only the ones that answer the customer’s care needs and re-quirements. Afterwards, for each case, the algorithm will calculate the closeness of each possible solution when compared to the customer’s information. Then in the algorithm the G coefficient, which is essentially the average of the obtained values of closeness’s, will be calculated. Almost in the end, the partial adherences will be calculated, by com-bining the value of each G coefficient with the relevance of a requirement for the cus-tomer and the associated coverage level from the service. Finally, it will be calculated the average value for the partial adherences, which will result in the Global adherence (Figure 3.10).
So, to summarize, the usage of the ECE can be seen in the sequence diagram at Figure 3.11.
29 Here it can be seen how the ECE manager is responsible for providing the infor-mation for the ECE, regarding the Customers and Service Providers (which are given by them) and Services and Care Needs. Afterwards, when the customer requests it, the Manager will run the algorithm to find the most suitable answers for his needs. In a first step, the search criteria will be validated, which means that if no service answers the customer’s care needs, or if the customer’s hard constraints are not met by any of the services that cover the customer’s care needs, or if the services’ limitations make the them unavailable for the customer, then no results will be found. If the search criteria are validated, then the algorithm will be executed selecting the different services and service providers pairs that will meet the customer’s needs.
Even though the explanation of the ECE can be done in a quite simplistic way, the truth is that behind it are some more complex relations, as illustrated in Figure 3.12.
30
31
3.2 Functionalities of the ECE
As mentioned before, considering the data gathered from the elderly and the ser-vice providers, the ECE will, per customer request, provide the different answers that meet the customers’ needs.
The first answer will consider the Adherence Maximization meaning that from all the possible answers to meet the elderly needs, they will be ranked respecting to how close are the services to the elderly demands. The second answer favours the cost-benefit ratio, which means that it will rank the possible answers based on their price.
The final solution provided to the customer will take into consideration the num-ber of services maximization which means it will evaluate how many service providers are necessary to answer the customer’s request.
None of the provided answers is intended to be a definitive answer to a customer’s request. The goal of the ECE is to provide different possibilities so that the elderly can make an educated choice regarding its needs.
The ECE functionalities are presented in Figure 3.13.
As it was mentioned, the ecosystem is compound by customers, which are the el-derly, their specific care needs and requests, and by service providers who will afford services in order to try to give the most adequate response to the elderly’s demands and it’s handled by a manager. The customers and service providers will provide
32
information regardless their profile, as detailed as possible. The manager, in turn, will pass all this information to the ecosystem.
At the request of a customer, the manager will run the algorithm and he has two options. The first one is to create a New Request, the second one is to run the algorithm itself. If the chosen option is the New Request one, the customer will be asked to inform which care needs he has and what are his requirements (the maximum price he’s willing to pay, how much time he can wait for the delivery, how good his technological skills are, etc.). If the chosen option is the other one, the algorithm will be run and it’ll give the possible answers according three criteria: Adherence maximization, Cost Benefit ratio maximization and Service Providers minimization.
33
Implementation Structure
4.1 Implementation Technologies
There are several collaborative platforms available on the market, so it was neces-sary to spend some time using and comparing each one. The work started with some theoretical research, in order to understand which one would better meet the require-ments, but it was find inconclusive, because all of them had several similar characteris-tics, and if one was better in a specific feature, the other one was better in another. So a more practical comparison was needed, and that took a long a time. Platforms like Dru-pal, WordPress or Grails were tested, but did not produce the expected results. Eventu-ally, Liferay was the chosen one, due to its solid technology foundation, fully featured, fully customizable, easy to use, with a solid record of success, and a forward-looking, bright vision which support the site’s future (Liferay homepage, 2017).
Liferay is a collaborative platform that allows building a website quickly and in an open source (“Liferay - Home page,” 2017). Other platforms were considered as it is demonstrated in Table 4.1.
Table 4. 1 - Comparison between different support collaborative platforms
Summary Document Management User Management Tasks and Project Management Compatibility and Adaptability Security Grails * * * * * * * * * * * * Liferay * * * * * * * * * * * * * Drupal * * * * * * * * * * * * * OutSystems * * * * * * * * * * * *
4
4
4
34
Since in average Liferay got the better results, it was the chosen platform to work with.
However, several problems were found because Liferay works with plugins that are created by different developers, which would make it a very complicated task to make them communicate with each other. Not only that, but also almost all those plugins worked with its own database. Also, because Liferay is essentially a Web Content Man-agement (WCM) and what was needed was, in fact, something that would enable the development of web applications. With that in mind, Laravel was the chosen tool for the development of the ECE.
Laravel is a web application framework with expressive, elegant syntax. Laravel endeavours to take the pain out of development by expedite routine tasks used in the majority of web projects, such as authentication, routing, sessions, and caching. Laravel aims to make the development process a pleasant one for the developer without sacri-ficing application functionality. Laravel is accessible, yet powerful, granting powerful tools essential for large, robust applications. A superb inversion of control container, expressive migration system, and tightly integrated unit testing support give the devel-oper the tools he needs to build any application (Laravel, 2013).
Furthermore, the chosen local development environment was Laragon and the da-tabase server was MariaDB.
4.2 MVC Model
MVC stands for Model, View and Controller and applications that use this archi-tecture are detached into these three components.
Originally, MVC’s purpose was to give the impression of a direct link from the end user brain to the computer (Reenskaug & Coplien, 2009). However, its definition evolved into nowadays where a Model-View-Controller (or MVC) is a specific methodology for coding that is commonly used for developing user interfaces, organizing the code and dividing an application into three interconnected parts (codeacademy.com). This is per-formed to create different internal representations of information from the ways infor-mation is presented to the user. The MVC design pattern divides these major
35 components allowing for efficient code reuse and parallel development. Traditionally used for Graphical User Interfaces, this architecture has become popular for designing web applications. Popular programming languages like Java, C# and PHP have MVC frameworks that are used in web application development straight out of the box.
The three components of an MVC model are so, Model, View and Controller. Model is the central component of the pattern and typically represents the physical world (codeacademy.com). It is the application’s dynamic data structure, independent of the interface and it directly manages the data, logic and rules of the application. View is everything that is responsible for interacting with the user (codeacademy.com). It stands for any representation of the information such as a chart, diagram or table. The Controller, in the end, accepts inputs and converts it into commands for the model or view, which means that it is the bridge that connects model and the view (codeacad-emy.com).
MVC intends to be used in situations for simultaneous development of the appli-cations and code reuse and it is available for using in different platforms such as Java, Phyton and PHP.
Laravel as a free, open-source PHP web framework is intended for web app devel-opment that follows the model-view-controller (MVC) architectural pattern. Some of the features of Laravel are a modular packaging system with a dedicated dependency man-ager, different ways for accessing relational databases, utilities that aid in application deployment and maintenance, and its orientation toward syntactic sugar (Edutech expo, 2019).
4.3 Platform Implementation
As it was previously mentioned, the fundamentals of an ECE are the customers that will use it and their care needs, the services that are available that will try to fulfil the customer’s care needs and the service providers who provides the services. So, in this ECE all the four possibilities are accounted for.
36
The ECE system will be managed by an administrator that, for instance to add a customer to the ECE, in the home page (Figure 4.1), the administrator will have a field to select to add a new customer (Figure 4.2).
Figure 4. 2 - Add Customer Figure 4. 1 – ECE’s homepage
37 Afterwards, the manager will follow for a new window in which he will provide all the customer’s relevant personal information that has previously been discussed, like name, address, its contact person and its needs (Figure 4.3).
38
39 In Figure 4.4 it is illustrated how a new service can be created and added to the ECE. In the home page of the ECE, it is possible for the ECE administrator to select a field to add a new service.
Similarly, to the customer, some information will have to be provided (Figure 4.5).
40
41 Finally, through Figure 4.6, it is demonstrated how a service provider is added to the ECE. Like before, there is the possibility to select a field to add a new service pro-vider.
And again, similar to what happened when adding a new customer, the new ser-vice provider will have to provide numerous information, namely the serser-vices it pro-vides (considering that the services are already registered), and some of its characteris-tics (Figure 4.7).
Figure 4. 6 - New service provider
42
Even though the ECE is managed and the information filled by the administrator, in each of the four different perspectives, the reality is that it is meant to provide answers for its customers.
Finally, the platform will have the option to create a PDF with all the information related to the algorithm’s suggestions, that can be exported. An image of the PDF is pre-sented in Figure 4.8.
43
44
4.4 Algorithm Implementation
The first step of the algorithm is intended to make a first approach, selecting only the pairs service-service provider that provide a valid answer to the customer’s needs and requirements.
The second step of the algorithm is the Adherence calculation. This step is meant to determine a compatibility index relating the customer profile, requirements and pri-orities to the provider’s characteristics and care services features (Baldissera & Cama-rinha-Matos, 2018a). The concept of adherence intends to provide a combined view of how good the match between the service and the need is. The larger the adherence is, the more appropriate the service is for a given customer’s profile (and thus the smaller is the probability to obtain a mismatch).
The adherence is calculated for each pair of service and service provider that will be a possible solution for the customer’s care need and it is calculated by estimating the three coefficients that are shown in Figure 4.9: Closeness (CL), Partial Adherence (PA) and Adherence (AD).
45 This diagram is a fragment of the one presented in Figure 3.12, and represents the part of the algorithm per se.
Since it is aimed to the best possible service personalization and adaptability for each customer, particular consideration is put on comparing solutions with the cus-tomer’s profile and requests. To find the solution that has the best adherence, the assess-ment is based on each customer’s requireassess-ment. CL considers how far apart are cus-tomer’s requirements and the related features of the pair {service, service provider}. The larger the distance is, the smaller the CL is. As each customer has different needs/re-quirements, the same service and provider fragment can have a different closeness to each customer.
4.4.1 CL Calculation
In what concerns to this work, CL calculation considers three different possible situations:
1) when the customer’s requirements and the features of the pair service, service provider are quantitatively expressed (crisp), for example, the maximum price he is willing to pay
2) when the customer’s requirement and the features of the pair {service, ser-vice provider} are qualitatively expressed (fuzzy), like the customer’s level of technological knowledge
3) when the customer’s requirement relates to service adaptability, for in-stance, if the customer requests a car with a specific colour for delivering a service, the request has a very high demand level and therefore requires a great flexibility from the service provider
𝐶𝐿 = {
𝑐𝑙𝑐𝑟𝑖𝑠𝑝 , 𝑖𝑓 𝑟𝑒𝑞𝑢𝑖𝑟𝑒𝑚𝑒𝑛𝑡𝑠 𝑎𝑟𝑒 𝑒𝑥𝑝𝑟𝑒𝑠𝑠𝑒𝑑 𝑖𝑛 𝑐𝑟𝑖𝑠𝑝 𝑣𝑎𝑙𝑢𝑒
𝑐𝑙𝑓𝑢𝑧𝑧𝑦 , 𝑖𝑓 𝑟𝑒𝑞𝑢𝑖𝑟𝑒𝑚𝑒𝑛𝑡𝑠 𝑎𝑟𝑒 𝑒𝑥𝑝𝑟𝑒𝑠𝑠𝑒𝑑 𝑖𝑛 𝑓𝑢𝑧𝑧𝑦 𝑠𝑐𝑎𝑙𝑒
𝑐𝑙𝑓𝑙𝑒𝑥 , 𝑖𝑓 𝑟𝑒𝑞𝑢𝑖𝑟𝑒𝑚𝑒𝑛𝑡𝑠 𝑎𝑟𝑒 𝑝𝑟𝑒𝑠𝑢𝑝𝑝𝑜𝑠𝑒 𝑓𝑙𝑒𝑥𝑖𝑏𝑖𝑙𝑖𝑡𝑦
The initial classification of the {service, service provider} pair features can be given by the ECE stakeholders, like service provider members or by professionals in elderly care. Some values might not be available yet (if the service has not been rated yet) or not