Separation and identification of neutral cereal lipids by normal phase
high-performance liquid chromatography, using evaporative
light-scattering and electrospray mass spectrometry for detection
João M. Rocha
a,b, Paavo J. Kalo
b, Velimatti Ollilainen
b, F. Xavier Malcata
c,d,∗aCBQF/Escola Superior de Biotecnologia, Universidade Católica Portuguesa, Rua Dr. António Bernardino de Almeida, P-4200-072 Porto, Portugal bDepartment of Food and Environmental Sciences, P. O. Box 27 (Latokartanonkaari 11), FIN-00014 University of Helsinki, Finland
cISMAI – Instituto Superior da Maia, Avenida Carlos Oliveira Campos, P-4475-690 Avioso S. Pedro, Portugal
dITQP – Instituto de Tecnologia Química e Biológica, Universidade Nova de Lisboa, Apartado 127, P-2781-901 Oeiras, Portugal
Keywords: Simple lipids Acylglycerols Free sterols Fatty acids
Normal phase liquid chromatography Evaporative light-scattering detection Positive electrospray ionization tandem mass spectrometry
a b s t r a c t
A novel method was developed for the analysis of molecular species in neutral lipid classes, using sepa-ration by normal phase high-performance liquid chromatography, followed by detection by evaporative light-scattering and electrospray ionization tandem mass spectrometry. Monoacid standards, i.e. sterol esters, triacylglycerols, fatty acids, diacylglycerols, free sterols and monoacylglycerols, were separated to baseline on microbore 3m-silica gel columns. Complete or partial separation of molecular species in each lipid class permitted identification by automatic tandem mass spectrometry of ammonium adducts, produced via positive electrospray ionization. After optimization of the method, separation and identi-fication of molecular species of various lipid classes was comprehensively tested by analysis of neutral lipids from the free lipid extract of maize flour.
Despite being minor constituents of flours, lipids play important roles in baking. Several authors have indeed reported on the specific effects of cereal lipids upon the final bread quality: previous defat-ting of flours impairs loaf volume and crumb grain of bread obtained therefrom, owing to favourable interactions of lipids with proteins and starch granules in flour. Furthermore, changes in protein–lipid interactions caused by wetting and mechanical work during dough mixing are important aspects for a full understanding of the func-tional role of lipids upon baking features, and in achieving baked products with appropriate final textures[1–10].
A large array of chromatographic methods has been used for identification and quantification of molecular species in simple (neutral) lipid classes. Reversed-phase (RP) HPLC separation of molecular species of neutral lipids is based mainly on partition between the non-polar bonded stationary and the polar mobile phases. Separation of molecular species of triacylglycerols (TAG), diacylglycerols (DAG) and monoacylglycerols (MAG) in
reversed-∗ Corresponding author. Tel.: +351 225 580 004; fax: +351 225 090 351. E-mail address:fmalcata@ismai.pt(F.X. Malcata).
phase columns has been successfully achieved[11,12]. However, TAG with identical equivalent carbon number (ECN) (=CN− 2n, where CN is the number of acyl group carbons and n the number of double bonds) tend to co-elute, and are thus called critical pairs [13]. In silver ion HPLC, separation is based on the weak interaction between the silver ions and the-electrons of double bonds; cation exchange silver ion HPLC is considered the most efficient [14]. Unlike RP-HPLC, silver ion HPLC separates TAG species according to their number of double bonds[15], and holds a potential to separate geometrical isomers of TAG and regioisomers of unsaturated TAG as well. Furthermore, regioisomers of MAG and DAG acetates have been successfully separated by silver ion HPLC[16]. Separation in normal phase (NP) HPLC is based on the adsorption of analytes on a polar stationary phase. Plattner and Payne-Wahl[17], as well as Rhodes and Netting[18]showed that, in NP-HPLC, TAG elute in the order of descending number of acyl group carbons, and ascending number of double bonds. Christie[19,20]introduced separation of lipid classes by NP-HPLC with evaporative light-scattering detec-tion (ELSD); this technique has been claimed to separate molecular species of simple lipids in low erucic acid rapeseed oil[21].
In order to identify molecular species of TAG, DAG and MAG, Duffin et al. [22] performed fundamental studies on collision-induced decay (CID) of their ammonium adducts produced by
electrospray ionization (ESI). In addition to ESI-mass spectrometry spectra (MS), DAG and TAG have been characterized by positive ESI Fourier transform (FT) ion cyclotron resonance (ICR) MS[23]and by atmospheric pressure chemical ionization (APCI) MS[11,12]; and sterols (S), besides DAG[24], by matrix-assisted laser desorp-tion ionizadesorp-tion (MALDI) MS[25]. Precursor ion tandem MS has been used for identification and quantification of ESI-ionized cholesterol esters (CE)[26]and sterol esters (SE)[27]: positive ion ESI-MS and tandem mass spectra (MS2) for analysis of dilithiated adducts of long-chain unsaturated esterified fatty acids (FA)[28], and positive ESI-MS2and MS3for analysis of ammonium adducts of saturated and unsaturated esterified FA[21].
The ultimate goal of this research effort was to separate molec-ular species of simple lipid classes—SE, TAG, FA, DAG, S and MAG, on silica gel microbore columns. Besides separating all these lipid classes in a single run—using a binary eluant gradient and ELSD detection, our specific aim was to resolve monoacid acylglycerols, FA, SE and S commercial standards, as well as maize flour free lipid extract, and other cereal lipid extracts and edible oils. Finally, we were interested in separating and identifying the molecular species, in each lipid class, via tandem ESI-MS.
Regional cultivars of cereals (maize and rye flours) were a gift by a farmer from Cabeceiras de Basto (Portugal); grinding was done in a water-mill. Flour samples were freeze-dried, thoroughly mixed, and kept packaged at−20◦C under N
2 in air-tight bags. Samples were warmed-up at room temperature just prior to open-ing the bags, and then boiled in a water-bath for 10–12 min to inactivate hydrolytic enzymes. Samples of rapeseed, peanut and sunflower oil—used during LC–MS and HPLC-ELSD method devel-opment, were purchased from a local store (Helsinki, Finland).
Lipid standards—with purity greater than 99%, were purchased from Nu-Chek Prep (Elysian MN, USA), Sigma (St. Louis MO, USA), Fluka (Buchs, Switzerland) and Larodan Fine Chemicals (Malmö, Sweden); the plant sterol mixture provided by the latter supplier had the following composition: 53%-sitosterol, 7% stigmasterol, 26% campesterol and 13% brassicasterol. Standards were stored at −18◦C, and were gradually warmed-up before use. Solvents used were purchased from Merck (Darmstadt, Germany) and Rath-burn (WalkerRath-burn, UK), and were analytical-reagent, HPLC or pro-analysis grade.
Several mixtures of standards were prepared for method devel-opment. Mixtures of triacylglycerol (TAG) standards: (a) TAG 51:0, 0.5075 mg/mL and TAG 57:0, 0.5170 mg/mL; (b) TAG 12:0, 0.3440 mg/mL, TAG 18:0, 0.3560 mg/mL, TAG 30:0, 0.1860 mg/mL, TAG 48:0, 0.2060 mg/mL and TAG 54:0, 0.1880 mg/mL; (c) TAG 54:3, 0.5175 mg/mL and TAG 54:6, 0.2640 mg/mL; (d) TAG 18:0, 0.2920 mg/mL, TAG 24:0, 0.2540 mg/mL, TAG 30:0, 0.1900 mg/mL and TAG 42:0, 0.2020 mg/mL; (e) TAG 36:0, 1.035 mg/mL, TAG 42:0, 1.061 mg/mL, TAG 48:0, 1.032 mg/mL, TAG 48:3, 0.7640 mg/mL, TAG 51:0, 1.032 mg/mL, TAG 54:0, 1.024 mg/mL, TAG 54:3, 1.122 mg/mL and TAG 54:6, 0.3260 mg/mL; and (f) TAG 27:0, 0.3102 mg/mL and TAG 54:3, 0.3981 mg/mL. Mixtures of fatty acid (FA) standards: (a) FA 17:0, 0.5055 mg/mL and FA 19:0, 0.5250 mg/mL; (b) FA 18:2, 1.050 mg/mL; (c) FA 6:0, 0.9980 mg/mL, FA 10:0, 1.029 mg/mL, FA 14:0, 1.022 mg/mL and FA 18:0, 1.010 mg/mL; (d) FA 4:0, 1.043 mg/mL, FA 8:0, 0.9020 mg/mL, FA 12:0, 1.027 mg/mL and FA 16:0, 1.111 mg/mL; and (e) TAG 27:0, 0.3102 mg/mL and TAG 54:3, 0.3981 mg/mL. Mixtures of dia-cylglycerol (DAG) standards: (a) DAG 18:0, 0.3330 mg/mL, DAG 24:0, 0.4578 mg/mL and DAG 38:2, 0.3357 mg/mL; (b) DAG 24:2,
1.120 mg/mL, DAG 32:2, 1.056 mg/mL, DAG 36:0, 1.028 mg/mL, DAG 36:2, 1.092 mg/mL and DAG 38:2, 1.014 mg/mL; and (c) non-standard solution of DAG 16:0, DAG 24:0, DAG 24:2, DAG 32:0, DAG 32:2, DAG 36:0, DAG 36:2, DAG 36:4 and DAG 38:2, dis-solved in CHCl3:MeOH (2:1, v/v) instead of CHCl3. Plant sterol (S) mixture (25 mg/mL), diluted in 10 mL CHCl3. Mixtures of monoacylglycerol (MAG) standards: (a) MAG 17:0, 0.7027 mg/mL, MAG 18:2; 0.3473 mg/mL and MAG 19:0, 0.3463 mg/mL; (b) MAG 12:0, 1.040 mg/mL, MAG 16:0, 1.012 mg/mL and MAG 18:0, 1.012 mg/mL; and (c) MAG 18:0, MAG 18:1, MAG 18:2 and MAG 18:3.
The silica gel 60 for flash column chromatography used in SPE columns was purchased from Merck, and its characteristics were as follows: particle size range, 0.040–0.060 mm/240–400 mesh; pore volume, 0.71–0.78 mL/g; specific area, 490 m2/g; drying loss, <9.0%; and pH, 6.5–7.5.
Lipid standards were dissolved in CHCl3and plant oils were also diluted to 10% (v/v) in CHCl3. Flour free lipids (FL) were extracted twice, as follows: 70.0 mL of hexane was added to a known amount (ca. 5 g) of sample, and stirred for 1 h at 200 rpm and 20◦C. After-wards, flour bound-lipids (BL) were extracted twice, from the initial pellet of flour, via adding 70.0 mL of water-saturated n-butanol (WSB), and stirring for 30 min at 200 rpm and 20◦C. Finally, flour starch-lipids (SL) were extracted, from the previous pellet flour, via addition of 70.0 mL of n-propanol–water (3:1, v/v) and stirring for 2 h at 150 rpm in a boiling water-bath (which guaranteed a tem-perature well above that of gelatinization of starch); this process was repeated twice, with extraction for 2 and 1 h, respectively. Each extract was filtered under vacuum, and the solvent was evaporated to dryness in a rotatory evaporator at 50◦C. To break lipoprotein associations, each extract was redissolved in a small volume of chloroform–methanol at 19:1 (v/v), added with ca. 10 drops of water and evaporated to dryness once again. The FL and BL extracts were redissolved in CHCl3:MeOH (2:1, v/v), whereas SL extracts were dissolved in CHCl3:MeOH (1:1, v/v) and eventually stored under argon prior to analysis. The non-lipid contaminants were removed from the cereal lipid extracts by partitioning in a bipha-sic CHCl3:MeOH:H2O system, according to the method of Bligh and Dyer[29]with modifications. The lipid extracts thus obtained were transferred to a 20 mL-volumetric flask (to permit quantita-tion) with the same solvent, and stored at−20◦C until analysis. For this sample preparation, the aforementioned solvents were used without further purification.
The NL from flour extracts were separated from the glycolipids (GL) and phospholipids (PhL)—commonly termed polar lipids (PL), via a 0.4 g-silica gel 60 chromatographic column, before HPLC anal-ysis. The 0.4 cm× 1.5 cm chromatographic column was prepared in a 15 mL-isolute filtration column tube, provided with micropore filters (International Sorbent Technology, Hengoed, UK). Samples were filtered through syringe membranes—0.6 mm× 25 mm nee-dles, from Terumo (Leuven, Belgium), and 1 mL-latex-free syringes from Once (Bagsværd, Denmark), using 4 mm-disposable PTFE filter media in 0.45m-polypropylene housing (Whatman, Kent, UK).
(Agilent Technologies, Santa Clara CA, USA) was employed for sep-aration of NL classes in the samples. Two Phenomenex Luna 3® silica gel columns (100 mm× 2.0 mm, 3 m), mounted in series, were used; the columns were protected by a silica gel guard column (4.0 mm× 2.0 mm). Prior to analysis, the HPLC system was rinsed
Materials and methods
Materials
Sample preparation
Chromatographic methods
High-performance liquid chromatography
Table 1
Optimal elution program for the binary solvent (A and B1) gradient used in NP-HPLC analysis of NL.
Time (min) % (v/v) B1 Flow rate (mL/min)
0.0 0.0 0.100 2.0 7.5 0.100 16.0 7.5 0.100 22.0 9.0 0.100 30.0 9.0 0.100 31.0 45.0 0.100 52.0 45.0 0.100 62.0 90.0 0.100 63.0 99.0 0.100 64.0 99.0 0.500 75.0 99.0 0.500 76.0 0.0 0.500 Post-time: 54.0 0.0 0.500
Note: Solvent A: hexane; solvent B1: hexane:MTBE:AcOH (20:80:1, v/v).
with 2-propanol for a few hours to avoid microbial growth, and the columns were further rinsed with hexane at 0.200 mL/min for at least 5 h (or overnight) before the first use.
A light-scattering detector, SEDEX 55 ELSD (Vitry-sur-Seine, France), was used for lipid analysis. The detector temperature was kept at 55◦C and its voltage was 600 V. The nebulizer gas was air compressed at 1 bar. The photomultiplier sensitivity was adjusted to a gain of 7, and the detector signal was recorded and integrated using the software HP ChemStation, v. A.07.01 (Hewlett Packard).
Separation of NL classes consisted of a multistep binary gradient of hexane – solvent A, and hexane:methyl-tert-butyl ether (MTBE):acetic acid (AcOH) – solvent B. Several chromatographic conditions were tested for separation of NL classes. The conditions used for separation were two columns in series, coupled with solvents A and B1 – hexane:MTBE:AcOH
(20:80:1, v/v), as shown inTable 1.
Solvents B1and B2 – hexane:MTBE:AcOH (60:40:1, v/v), were filtered under a vacuum through a filter type FH with 0.5m-pore size (from Millipore, Billerica MA, USA) prior to use; the A and B solvents were flushed with helium for ca. 30 min before sam-ple injection. The chromatographic separation took place at room temperature. The volumes injected during method development (at a draw speed of 104.2L/min) never exceeded 30 L, although most of them were actually below 10L. The extent of separation was calculated via resolution of two adjacent peaks in the chro-matograms.
An LC 1100 Hewlett Packard HPLC system was coupled to an ion-trap Esquire LC–MS (Bruker Daltonic, Bremen, Germany). The conditions used in the HPLC-ELSD system for NL separation were as described above, and the elution program is depicted inTable 1. An external Waters 510 HPLC pump was used for pumping the ionization reagent. The ion chromatograms were extracted from MS data, and integrated using the software Bruker Daltonic DataAnalysis, v. 3.0.
In order to form ammonium adducts, a CHCl3:MeOH:NH3 (20:10:3, v/v) aqueous solution, prepared with CHCl3:MeOH (2:1, v/v) and 10% (v/v) of 25% (v/v) aqueous NH3, was pumped after the column at a constant flow rate of 6 mL/min, using an 1:100 split device to the effluent flow or, alternatively, 60L/min without said device[30].
The LC–ESI-MS system was operated in positive ESI mode, with the following acquisition parameters: capillary voltage of 3000 V; capillary exit offset of 10 V; ions entering the mass spectrometer
accelerated through a skimmer potential of 20 V (sufficient to des-olvate, but not to fragment said ions); and trap drive values of 70 and 40, for SE, TAG and DAG, and for FA, free S and MAG, respec-tively. Conventional full scan ESI-mass spectra of the sample ions were recorded in the m/z scan range of 50–1000, summing up to 15 spectra. Nitrogen was used as nebulizing and drying gas under 40 psi, at a flow rate of 8 L/min and a drying temperature of 300◦C. Auto-MS2spectra for the two most intense co-eluting ions were recorded, using helium (99.996% purity) as collision gas. In addi-tion to auto-MS2, time windows for isolation and fragmentation of specific ions were used for minor components.
In order to optimize separation of the various NL classes, the binary mobile phase gradient was varied as well as the eluent flow rate, and the possibility of coupling two silica gel columns in series was also tested. Several modifications yielding performance gains were applied to the original method, which produced the following general conclusions: the best resolution was obtained at 0.100 mL/min; an appropriate internal standard was not found; and a long post-run time was required to re-equilibrate the silica gel columns.
Peak identification and improvement of NL separation was initially based on standards—individually and as part of several mixtures prepared specifically to confirm retention times; after-wards, the chromatographic method developed was tested via analysis of samples of edible oils and cereal extracts, including a detailed analysis of a sample of simple lipids from maize flour free lipid extract (M-FL-NL). The molecular species of each simple lipid class were identified by LC–ESI-MS2.
In general, all NL classes formed ammonium adducts. The m/z of extracted ion chromatograms (EIC) revealed the molecular weight and unsaturation level, whereas tandem mass spectra (MS2) elu-cidated esterified fatty acids of acylglycerols and SE. Addition of ammonium ions in the presence of ammonia promoted easy and soft ionization; recall that formation of one type of NL adduct, with minimal fragmentation, is critical for quantification.
Identification of molecular species was attempted by analyzing standard compounds, cereal extracts and edible oils; in order to further illustrate application of the technique developed, a sample of M-FL-NL extract was also fully analyzed. Prior to HPLC analysis of the lipid extracts, the NL were isolated from flour extract on a 0.4 cm× 1.5 cm silica gel SPE column, from which the NL were eluted with chloroform—whereas polar lipids (PL), composed by glycolipids (GL) and phospholipids (PhL), remained in the column.
Following the improved elution program depicted inTable 1, NL could be identified based on individual commercial standards (and standard mixtures), as well as selected edible oils and cereal lipid extracts.
Extracted ion chromatograms (EIC) from a rapeseed oil sam-ple, with ESI-MS and tandem MS, may be used to illustrate our results regarding SE—which were the first NL class eluted: the MS showed that SE ammonium adducts ([M+NH4]+) were the base peaks, viz. campesteryl-18:2 (m/z 680.8) and sitosteryl-18:2 (m/z 694.7). Tandem MS of the above compounds (Fig. 1A and B, respec-tively) indicated formation of [(M+NH4)-NH3]+fragments and, in particular, formation of the sterol fragment ion [(M+NH4)-NH3 -FA]+ – which permitted identification of SE: m/z 383.4 (Fig. 1A)
Results
Methods :
High-performance liquid chromatography with electrospray ionization mass spectrometry
Equipment : Analyses of standard mixtures and liquid extracts using the developed
HPLC-ELSC chromatographic method, complemented with ESI-MS detection and ESI-MS
2
Identification
Sterol esters Methods :
Fig. 1. Tandem mass spectra (MS2) of sterol ester (SE) ammonium adducts in rapeseed oil, using the elution program inTable 1: (A) MS2at 21.3 min (campesteryl 18:2), and (B) MS2at 21.5 min (sitosteryl 18:2).
and m/z 397.4 (Fig. 1B), for campesteryl-18:2 and sitosteryl-18:2, respectively[21].
As observed inFig. 2, TAG with different number of acyl group carbons (ACN) were eluted within ca. 24 min. The resolution fac-tors (Rs) of two adjacent peaks in several samples analyzed were: Rs(TAG 57:0–TAG 54:0) = 0.29, Rs(TAG 54:0–TAG 51:0) = 0.85, Rs (TAG 51:0–TAG 48:0) = 0.35, Rs (TAG 48:0–TAG 42:0) = 1.22, Rs (TAG 42:0–TAG 36:0) = 1.48, Rs(TAG 36:0–TAG 30:0) = 1.77, Rs(TAG 30:0–TAG 24:0) = 2.60, Rs(TAG 24:0-TAG 18:0) = 4.68 and Rs(TAG 18:0–TAG 12:0) = 15.8. A relatively good separation of TAG, with the same number of double bounds (DB) but different ACN (in the ACN range of 12–42), was also observed. Furthermore, inspection of MS data in TAG standard mixtures, as well as in samples of flours and plant oils, allows one to pinpoint partial separation of TAG with a given ACN but different DB.
The mass spectrometric identification of TAG in the com-plex standard mixture composed by TAG 36:0, 42:0, 48:0, 48:3, 51:0, 54:0, 54:3 and 54:6 was as follows: the first shoulder was accounted for by TAG 54:0 (m/z 909.1) and TAG 51:0 (m/z 867.2); the next peak corresponded to TAG 54:3 (m/z 903.1); the fol-lowing shoulder was associated with TAG 48:0 (m/z 825.2); the following peak encompassed TAG 42:0 (m/z 741.0), TAG 48:3 (m/z 819.0) and TAG 54:6 (m/z 897.0); and the last peak was associ-ated with TAG 36:0 (m/z 656.9). Inspection of MS data generassoci-ated showed that TAG produced only ammonium adducts ([M+NH4]+) without fragmentation: m/z 656.0 (TAG 36:0: 12:0/12:0/12:0), m/z 741.0 (TAG 42:0: 14:0/14:0/14:0), m/z 825.0 (TAG 48:0: 16:0/16:0/16:0), m/z 819.0 (TAG 48:3: 16:1/16:1/16:1), m/z 867.0 (TAG 51:0: 17:0/17:0/17:0), m/z 908.0 (TAG 54:0: 18:0/18:0/18:0), m/z 903.0 (TAG 54:3: 18:1/18:1/18:1) and m/z 897.0 (TAG 54:6: 18:2/18:2/18:2). The MS2of those TAG were accounted for by
abun-dant DAG ions [(M+NH4)-NH3-FA]+: TAG 36:0 (m/z 439.4), TAG 42:0 (m/z 495.5), TAG 48:0 (m/z 551.6), TAG 48:3 (m/z 547.6), TAG 51:0 (m/z 579.7), TAG 54:0 (m/z 607.5), TAG 54:3 (m/z 603.7) and TAG 54:6 (m/z 599.6). Minor ion were formed via loss of ammonia [(M+NH4)-NH3]+, and appeared in the MS2spectra of unsaturated TAG: TAG 48:3 (m/z 801.9), TAG 54:3 (m/z 885.9) and TAG 54:6 (m/z 879.9).
Major results pertaining to FA identification, as well as to sep-aration between low molecular weight (LMW)-TAG and FA, were mainly obtained by studying the chromatograms of several stan-dard mixtures (from the monoacid TAG 18:0, 24:0, 27:0, 30:0, 42:0 and 54:3, and from the FA 4:0, 6:0, 8:0, 10:0, 12:0, 14:0, 16:0, 17:0, 18:0, 18:2 and 19:0) and using the chromatographic conditions as in Table 1. The results showed that the minimum resolution obtained between the latter was: Rs(TAG 24:0–FA mixture, first peak of one of the FA mixtures) = 0.98 and Rs(second peak of the previous FA mixture–TAG 18:0) = 2.60. Note, however, that LMW-TAG are minor (or even missing) compounds in cereal lipids. These chromatograms, complemented with several EIC of TAG and FA, also indicate that the RT of FA with distinct ACN and DB differ to some extent, and that elution occurs within ca. 2 min.
From the EIC of TAG- and FA-ammonium adducts in simple lipids in SL extracted from maize flour (M-SL-NL), and using the chro-matographic conditions listed in Table 1, one could observe the following compounds: TAG 54:9 (m/z 892.9), TAG 54:6 (m/z 897.5), TAG 54:3 (m/z 904.2), TAG 52.3 (m/z 875.3), TAG 52.2 (m/z 877.2), FA 18:3 (m/z 296.4), FA 18:2 (m/z 298.3), FA 18:1 (m/z 300.4), FA 18:0 (m/z 301.3) and FA 16:0 (m/z 273.3). The same sample showed that FA 18:0 (and the minor component TAG 54:9) elute within a narrow RT window (even though some of the chromatograms displayed did not exhibit such an overlap). Nevertheless, their quantification may
Fig. 2. Chromatograms of monoacid triacylglycerols (TAG) in standard mixtures (recorded using the elution program inTable 1): (a) TAG 12:0, 18:0, 30:0, 48:0 and 54:0, and (b) TAG 54:3 and TAG 54:6.
Triacylglycerols
Table 2
Alternative elution program for the binary solvent (A and B1) gradient used in NP-HPLC analysis of NL with two silica gel columns in series.
Time (min) % (v/v) B1 Flow rate (mL/min)
0.0 0.0 0.100 2.0 7.5 0.100 16.0 7.5 0.100 22.0 9.0 0.100 63.0 99.0 0.100 64.0 99.0 0.500 75.0 99.0 0.500 76.0 0.0 0.500 Post-time: 54.0 0.0 0.500
Note: Solvent A: hexane; solvent B1: hexane:MTBE:AcOH (20:80:1, v/v).
be possible via HPLC-ELSD, when appropriate injection volumes are used. Hence, the above results proved that FA with distinct chain lengths can be only partially separated.
The mass spectrometric identification of some FA (seeTable 3) in simple lipids from maize starch lipid extract (M-SL-NL)—when the HPLC system coupled to the ion-trap LC–MS was operating under the conditions described in Table 1, suggested that the ammo-nium adduct ([M+NH4]+) was the sole ion formed by unsaturated FA, whereas saturated FA formed more abundant [M+NH4-H]+ ions (produced by deprotonation of said ammonium adduct). Furthermore, ammonium adducts ([M+NH4]+) could also form from saturated FA. Tandem MS of unsaturated FA produced high intensity [(M+NH4)-NH3]+and [acyl]+fragments (the latter were produced via release of ammonia and water by the ammonium adduct); and low intensity [acyl-H2O]+fragments (Table 3). Regard-ing saturated FA, the characteristic fragments obtained by MS2 of [M+NH4]+were [(M+NH4)-NH3]+and [M]+. In addition, depro-tonated ammonium adducts from saturated FA ([(M+NH4)-H]+) were often rather abundant in their MS, whereas their character-istic fragments obtained in MS2were accounted for only by [M]+ (Table 3).
The tandem MS of palmitic, linoleic and linolenic acid stan-dards, recorded using the elution program presented inTable 2 (except that the flow rate was 0.15 mL/min in the time frame 0–75 min), are shown inFig. 3. The MS2data of the [(M+NH
4)-H]+ ion with m/z 273.0 (FA 16:0) (Fig. 3A) showed high intensity frag-ment ions with m/z 161.2 and 143.3, and low intensity ions with m/z 241.1, 129.3 and 111.4. The MS2 data of the [(M+NH
4]+ ion with m/z 298.0 (FA 18:2) (Fig. 3B) exhibited an abundant linoleoyl ion with m/z 263.1, as well as low intensity ions [linoleoyl-H2O]+
with m/z 245.2 and [(M+NH4)-NH3]+ with m/z 281.1. Collision-induced dissociation (CID) of the [(M+NH4]+ion with m/z 296.0 (FA 18:3) (Fig. 3C) produced an abundant [(M+NH4)-NH3]+ ion with m/z 279.7, a low intensity linolenoyl ion with m/z 261.1 and a low intensity [linolenoyl-H2O]+ion with m/z 243.1.
Using the elution program tabulated in Table 1, the EIC of a DAG standard mixture (DAG 24:2, 32:2, 36:0, 36:2 and 38:2) (see Fig. 4) exhibited two intense peaks for ammonium adducts of both regioisomers at 50–51 and 53–54 min (except those for DAG 24:2, appearing at ca. 52 and 57 min), which correspond to 1,3-DAG and 1,2(2,3)-DAG, respectively; the reali-sation that the two regioisomers produce distinct fragments via MS and MS2 consequently allows their identification (Table 4). The corresponding MS indicated that isomers at ca. 50–51 min (1,3-DAG) form intense [M+NH4]+adducts and intense [(M+NH4 )-NH3–H2O]+fragments—generated by loss of ammonia and water from [M+NH4]+ ions. In addition, the tandem mass spectrome-try of the [M+NH4]+adduct (at ca. 50–51 min) produced intense [(M+NH4)-NH3–H2O]+ fragments. The MS2 of [(M+NH4)-NH3 -H2O]+fragments (also at ca. 50–51 min) led in general to abundant [acyl]+peaks, and medium intensity [acyl-H
2O]+, [(M+NH4)-NH3 -H2O-74]+and [(M+NH4)-NH3-FA]+ions. The precursor [M+NH4]+ in ESI-MS/MS (at ca. 53–54 min) produced intense [(M+NH4)-NH3]+ ions, and medium intensity [(M+NH4)-NH3-H2O]+and [(M+NH4 )-NH3-FA]+ions.
The chromatograms of several standard mixtures obtained by NP-HPLC-ELSD, using the elution program inTable 1to separate DAG and S, were studied—and an example is plotted inFig. 4. The resolution between the latter 1,3-DAG peak and that in the plant sterols mixture was 1.31 (seeFig. 4).
Inspection of complementary data of EIC pertaining to standard mixtures of DAG regioisomers, and flour and oil samples – includ-ing, for instance, a sample pertaining to sunflower oil (using the chromatographic conditions set forth inTable 1): m/z 610.7 (1,3-DAG 34:2 at 50.9 min and 1,2(2,3)-(1,3-DAG 34:2 at 54.2 min), m/z 612.7 (1,3-DAG 34:1 at 50.9 min and 1,2(2,3)-DAG 34:1 at 53.9 min), m/z 632.7 (1,3-DAG 36:5 at 51.4 min and 1,2(2,3)-DAG 36:5 at 54.7 min), m/z 634.7 (1,3-DAG 36:4 at 51.0 min and 1,2(2,3)-DAG 36:4 at 54.1 min), m/z 636.9 (1,3-DAG 36:3 at 50.8 min and 1,2(2,3)-DAG 36:3 at 53.9 min), m/z 638.8 (1,3-DAG 36:2 at 50.7 min and 1,2(2,3)-DAG 36:2 at 53.6 min), m/z 666.6 (1,3-1,2(2,3)-DAG 38:2 at 50.5 min and 1,2(2,3)-DAG 38:2 at 53.5 min), m/z 383.4 (campesterol fragment
Table 3
Selected molecular species of FA identified in simple lipids (NL) fractions from maize flour (M) starch lipid (SL) extract (M-SL-NL), recorded by LC–MS using the elution program shown inTable 1.
Standard FA MS type [M+NH4]+(m/z) [(M+NH4)-H]+(m/z) [(M+NH4)-NH3]+(m/z) [Acyl]+(m/z) [Acyl-H2O]+(m/z) [Acid]+(m/z)
Unsaturated FA FA 18:3 MS 296.4 MS2296.4 279.2 261.2 243.2 FA 18:2 MS 298.3 MS2298.3 281.2 263.2 245.2 FA 18:1 MS 300.4 MS2300.4 283.1 265.1 247.1 Saturated FA FA 18:0 MS 302.3 301.3 MS2302.3 286.2 284.8 MS2301.3 284.8 FA 16:0 MS 274.3 273.4 MS2274.3 257.1 256.2 MS2273.4 256.2 Fatty acids
Separation of diacylglycerols and free sterols Diacylglycerols
Fig. 3. Electrospray tandem mass spectra (ESI-MS2) of fatty acid (FA) standards (recorded using the elution program inTable 2, except that the flow rate was 0.15 mL/min in
the time frame 0–75 min): (A) MS2of [M+NH
4-H]+ion with m/z 273 (palmitic acid), (B) MS2of [M+NH4]+ion with m/z 298 (linoleic acid), and (C) MS2of [M+NH4]+ion with m/z 296 (linolenic acid).
Fig. 4. Chromatograms of monoacid diacylglycerols (DAG) and free sterols (S) in standard mixtures (recorded using the elution program inTable 1): 1:1 mixture of DAG mixture (DAG 24:2, 32:2, 36:0, 36:2 and 38:2) and plant sterol mixture.
ion at 52.7 min), m/z 395.5 (stigmasterol fragment ion at 52.8 min) and m/z 397.5 (sitosterol fragment ion at 52.6 min), coupled with data inTable 4—pertaining to mass spectrometric identification of a standard mixture of DAG regioisomers with the composition of the DAG counterpart ofFig. 4, one observed that DAG with equal ACN but different DB were partially resolved, and that 1,3- and 1,2(2,3)-DAG were clearly separated to the baseline.
In addition, inspection ofFig. 4and the aforementioned comple-mentary data of EIC indicated that DAG isomers elute close to free S—and this, in turn, elutes between 1,3- and 1,2(2,3)-DAG; and that 1,3-DAG, free S and 1,2(2,3)-DAG are resolved to the baseline (with elution within ca. 6 min). DAG with different chain-lengths were separated only partially. Furthermore, based on the information conveyed byFig. 4, coupled with results of EIC of DAG ammonium
Table 4
Ammonium adduct and fragment ions identified in full scan and product ion tandem mass spectra of a DAG standard mixture, recorded by LC–MS using the elution program shown inTable 1.
Standard DAG MS type [M+NH4]+
(m/z) [(M+NH4 )-NH3]+ (m/z) [(M+NH4 )-NH3-H2O]+ (m/z) [(M+NH4 )-NH3–H2O-74]+ (m/z) [(M+NH4 )-NH3-H2O-FA]+ (m/z) [Acyl]+ (m/z) [Acyl-H2O]+ (m/z) 1,3-DAG 1,3-DAG 24:2 MS 470.5 435.6 MS2470.0 435.3 MS2435.0 361.3 255.1 181.1 163.2 1,3-DAG 32:2 MS 582.7 547.7 MS2582.0 547.6 MS2547.0 473.4 311.2 237.2 219.2 1,3-DAG 36:2 MS 638.8 603.8 MS2638.0 – MS2603.0 529.5 339.2 265.2 247.2 1,3-DAG 36:0 MS 642.6 607.6 MS2642.0 607.6 MS2607.0 533.6 341.1 267.5 249.5 1,3-DAG 38:2 MS 666.8 631.8 MS2666.0 631.7 MS2631.0 557.6 353.3 279.3 261.3 1,2(2,3)-DAG 1,2(2,3)-DAG 24:2 MS 470.5 453.5 435.5 255.3 MS2470.0 453.2 435.2 255.2 1,2(2,3)-DAG 32:2 MS 582.6 MS2582.0 565.5 547.5 311.2 1,2(2,3)-DAG 36:2 MS 638.7 MS2638.0 621.5 603.5 339.2 1,2(2,3)-DAG 36:0 MS 642.6 MS2642.0 625.6 607.6 341.1 1,2(2,3)-DAG 38:2 MS 666.8 MS2666.0 649.6 631.7 353.3
Table 5
Ammonium adduct and fragment ions identified in full scan and product ion tandem mass spectra of MAG standard mixture (MAG 12:0, 16:0, 18:0 and 18:2), recorded by LC–MS using the elution program shown inTable 1.
Standard MAG MS type [M+NH4]+(m/z) [(M+NH4)-NH3]+(m/z) [(M+NH4)-NH3–H2O]+
(m/z) [Acyl]+(m/z) [Acyl-H 2O]+(m/z) Unsaturated MAG MAG 18:2 MS 372.3 355.4 337.5 MS2 372.0 355.3 337.3 263.2 245.3 MS2 355.0 337.2 263.2 245.3 Saturated MAG MAG 18:0 MS 376.4 359.5 341.5 MS2 376.0 359.3 341.5 MS2 359.0 341.3 DAG 16:0 MS 348.4 331.5 313.5 MS2 348.0 331.5 313.5 MS2 331.0 313.3 MAG 12:0 MS 292.3 275.4 257.4 MS2 292.0 275.2 257.2 MS2 275.0 257.2
adducts and S fragment ions in the above sunflower oil sample, one concluded that complete elution of free S within a short RT range occurs, and that the plant sterol mixture composed by-sitosterol, stigmasterol, campesterol and brassicasterol also co-elutes. How-ever, the EIC of these fragment ions—produced by LC-ESI-MS, are useful for quantification.
Likewise to what was observed in the EIC example described above pertaining to sunflower oil, free S were identifiable, via the elution program depicted inTable 1, by their [(M+NH4)-NH3-FA]+ fragments: m/z 381.5, m/z 383.4, m/z 395.5 and m/z 397.5, for bras-sicasterol, campesterol, stigmasterol and sitosterol, respectively. Therefore, free S showed characteristic fragments identical to those observed in tandem mass spectra of SE. Based on the same data, one could also observe that free S elute between DAG regioisomers without a major overlap.
Inspection of the chromatograms of NP-HPLC-ELSD of MAG standard mixtures—with several combinations of MAG 12:0, 16:0, 17:0, 18:0, 18:2 and 19:0, under the chromatographic conditions listed inTable 1, indicated that MAG essentially elute between ca. 66 and 70 min (although MAG may start eluting at ca. 64 min—data not shown). MAG characterized by distinct acyl chains could be only partially separated.
The MS data inTable 5illustrate the abundance of [M+NH4]+ adducts and [(M+NH4)-NH3]+fragments (corresponding to loss of NH3), and of medium to low intensity [(M+NH4)-NH3-H2O]+ frag-ments (corresponding to loss of NH3 and H2O)—as recorded for MAG 12:0, 16:0, 18:0 and MAG 18:2 MAG, in a standard mix-ture. In the same table, one can also observe that the MS2 of [M+NH4]+adduct results in intense [(M+NH4)-NH3]+, as well as in medium to low intensity [(M+NH4)-NH3-H2O]+fragments. The MS2 of [(M+NH4)-NH3]+adduct produced, in turn, abundant [(M+NH4 )-NH3-H2O]+ fragments – with the same m/z as described above. Furthermore, additional peaks were found in both MS2of [M+NH
4]+ and [(M+NH4)-NH3]+ ions of unsaturated MAG 18:2 – viz. [acyl 18:2]+with m/z 263.2 and [acyl-H
2O]+with m/z 245.3, generated via loss of H2O from the acyl group.
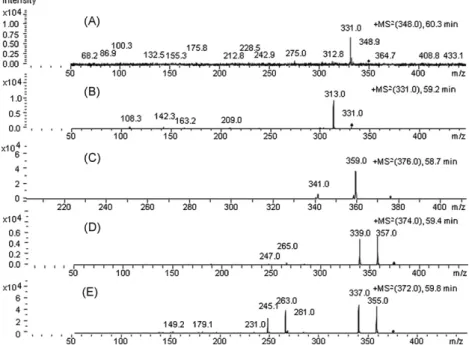
Tandem MS for identification of MAG species, in a standard mix-ture of MAG 18:0, 18:1, 18:2 and 18:3, were recorded using the elution program depicted inTable 2—except that the flow rate was 1.5 mL/min in the time frame 0–75 min, and that a few distinct additional mass spectra (besides those using the elution program
depicted inTable 1) were obtained. In the MS2of [M+NH 4]+ion with m/z 370.0 at 60.3 min (MAG 18:3), one found an abundant [(M+NH4)-NH3]+ ion with m/z 353.1, low to medium intensity [(M+NH4)-NH3-H2O]+ions with m/z 335.1, [acyl 18:3]+with m/z 261.2, and [acyl 18:3-H2O]+with m/z 243.2. The CID of ion with m/z 353.1 (MAG 18:3) produced abundant [acyl 18:3]+ ion with m/z 261.2, and low to medium intensity [(M+NH4)-NH3-H2O]+ions with m/z 335.1, [protonated FA 18:3]+ions with m/z 279.2 and [acyl 18:3-H2O]+ions with m/z 243.1. In the MS2of the [M+NH4]+ion with m/z 372.0 at 59.6 min (MAG 18:2), one could perceive abun-dant [(M+NH4)-NH3]+ions with m/z 355.1, [(M+NH4)-NH3-H2O]+ ions with m/z 337.1 and [acyl 18:2]+ions with m/z 263.1, as well as low to medium intensity [protonated FA 18:2]+ions with m/z 281.2 and [acyl 18:2-H2O]+ones with m/z 245.2.
Furthermore, in the MS2 of [(M+NH
4)-NH3]+ with m/z 355.1 (MAG 18:2), abundant [(M+NH4)-NH3-H2O]+ions with m/z 337.2, and medium intensity [acyl 18:2]+ions with m/z 263.1, as well as [acyl 18:2-H2O]+ions with m/z 245.1 were depicted. The CID of the [M+NH4]+ ion with m/z 374.0 at 59.2 min (MAG 18:1) produced abundant [(M+NH4)-NH3]+ ions with m/z 357.2 and [(M+NH4 )-NH3-H2O]+ions with m/z 339.1, and low intensity [acyl 18:1]+ion with m/z 265.2. The CID of the [(M+NH4)-NH3]+ion with m/z 357.2 (MAG 18:1) led to abundant [(M+NH4)-NH3-H2O]+ions with m/z 339.1 and [acyl 18:1]+ones with m/z 265.2, and low to medium intensity [protonated FA 18:1]+ions with m/z 283.1 and [acyl 18:1-H2O]+ones with m/z 247.2. In the MS2of the [M+NH4]+ion with m/z 376.0 at 58.7 min (MAG 18:0), an abundant [(M+NH4)-NH3]+ion with m/z 359.2 and a low intensity [(M+NH4)-NH3-H2O]+ion with m/z 341.2 were found. Finally, in the MS2of the [(M+NH
4)-NH3]+ ion with m/z 359.1 (MAG 18:0), only an abundant [(M+NH4)-NH3 -H2O]+ion with m/z 341.1 could be pinpointed.
An example of tandem MS of M-FL-NL, obtained using the elu-tion program described inTable 2, is provided inFig. 5. The tandem MS from the EIC for ions with m/z 694.9, 692.8 and 680.8 are shown in Fig. 5A–C, respectively, and correspond to SE ammo-nium adducts ([M+NH4]+). The MS2 of ion with m/z 694.9 shows relatively abundant sitosterol and stigma/avenasterol ([(M+NH4 )-NH3-FA]+) fragment ions, with m/z 397.4 and 395.4, respectively (seeFig. 5A); these are formed by cleavage of ammonia, together with linoleic acid and oleic acid, respectively. Hence, the MS2 data are consistent with sitosteryl linoleate and stigma/avenasteryl Free sterols
Monoacylglycerols
Applications of optimized chromatographic methods in analyses of simple liquid from maize flour free lipid extract
Fig. 5. Tandem MS data recorded in the auto-MS2mode for extracted ion chro-matograms (EIC) of sterol esters (SE) in simple lipids (NL) fraction from maize flour (M) free lipids (FL) extract (M-FL-NL) (chromatographic conditions as inTable 2): (A) MS2at 21.2 min (sitosteryl linoleate + stigma-/avenasteryl oleate), from EIC of m/z 694.9; (B) MS2at 21.2 min (stigma-/avenasteryl linoleate), from EIC of m/z 692.9; and (C) MS2at 21.0 min (campesteryl linoleate), from EIC of m/z 680.8.
oleate. The MS2of the ion with m/z 692.8 shows abundant stigma-/avenasterol fragment ion with m/z 395.4, formed by cleavage of ammonia and linoleic acid (seeFig. 5B); this is consistent with stigma-/avenasteryl linoleate. The MS2of ion with m/z 680.8 shows a relatively abundant campesteryl fragment ion with m/z 383.3, which is formed by loss of ammonia and linoleic acid (seeFig. 5C); this confirms that the ion with m/z 680.8 is campesteryl linoleate. Further molecular species of sterol esters identified are shown in Table 6.
Two examples of identification of a three- and a two acid-TAG in M-FL-NL are provided inFig. 6A and B, respectively—which were obtained from the EIC for ions with m/z 875.1 and that for ion with m/z 899.1, respectively. In the MS2of [M+NH
4]+with m/z 875.1, low intensity [(M+NH4)-NH3]+and [(M+NH4)-NH3-H2O]+ions are shown, with m/z 857.9 and 839.9, respectively, as well as abun-dant diacylglycerol [(M+NH4)-NH3-FA]+ions with m/z 601.7, 577.7 and 575.7—which are formed via cleavage of palmitic, linoleic and oleic acids, respectively, along with ammonia (Fig. 6A). This is con-sistent with regioisomers 16:0/18:1/18:2 and 16:0/18:2/18:1, the
Fig. 6. Tandem MS data recorded in the auto-MS2mode for extracted ion chro-matograms (EIC) of triacylglycerols (TAG) in simple lipids (NL) fraction from maize flour (M) free lipids (FL) extract (M-FL-NL) (recorded using the elution program in
Table 2): (A) MS2at 24.8 min (TAG 52:3: 18:2/18:1/16:0), from EIC of m/z 875.1; and (B) MS2at 25.4 min (TAG 54:3: 18:2/18:1/18:1), from EIC of m/z 899.
former being predominant. In the MS2of [M+NH
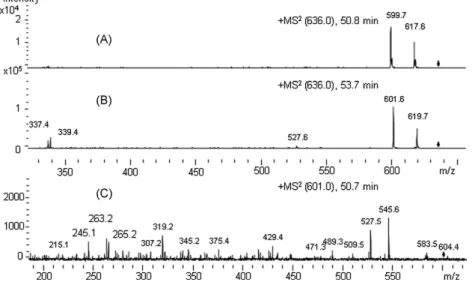
4]+with m/z 899.1 at 25.4 min inFig. 6B, [(M+NH4)-NH3]+and [(M+NH4)-NH3-H2O]+ ions, with m/z 881.9 and 864.0, respectively, are depicted—as well as DAG [(M+NH4)-NH3-FA]+ions with m/z 601.7 and 599.8, formed by cleavage of ammonia and linoleic and oleic acid, respectively; this observation is consistent with the predominant regioisomer 18:2/18:1/18:1. Further TAG species identified are listed inTable 6. The chromatographic resolution and mass spectrometric identi-fication of DAG 36:3 regioisomers are presented inFig. 7; the MS2of [M+NH4]+ion with m/z 636.7 at 50.8 min can be observed inFig. 7A, whereas the MS2of [M+NH
4]+ion with m/z 636.7 at 53.7 min shows [(M+NH4)-NH3-FA 18:2]+ion with m/z 339.3 and [(M+NH4)-NH3 -FA 18:1]+ion with m/z 337.3 as characteristic fragments—which are consistent with 1,2(2,3)-DAG 18:1/18:2 (Fig. 7B). The MS2of [(M+NH4)-NH3-H2O]+, with m/z 601.9 at 50.7 min, shows charac-teristic [acyl 18:1]+and [acyl 18:2]+ions, with m/z 265.2 and 263.2, respectively (Fig. 7C); this indicates that the DAG eluted at 50.7 min is 1,3-DAG 18:1/18:2. Additional identified molecular species of DAG are conveyed byTable 6.
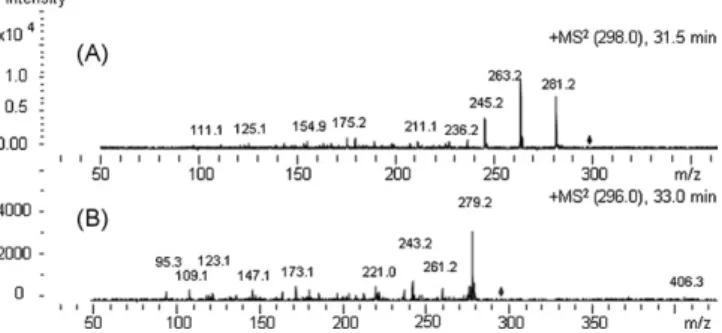
The identification of FA is elucidated inFig. 8, which provides MS2 data for [M+NH
4]+ions with m/z 298.4 at 31.5 min (Fig. 8A) and m/z 296.0 at 33.0 min (Fig. 8B). The CID of [M+NH4]+ions with m/z 298.4 at 31.5 min produced [protonated FA 18:2]+ions with m/z 281.2, [acyl 18:2]+ions with m/z 263.2 and [acyl 18:2-H
2O]+ions with m/z 245.2 (Fig. 8A)—all of which are consistent with linoleic
Fig. 7. Tandem MS data recorded in the auto-MS2mode for extracted ion chromatograms (EIC) of simple lipids (NL) fraction from maize flour (M) free lipids (FL) extract (M-FL-NL) (recorded using the elution program inTable 2): (A) MS2at 50.8 min (1,3-DAG 36:3) and (B) MS2at 53.7 min (1,2(2,3)-DAG 36:3), from EIC of m/z 636.7; and (C) MS2at 50.7 min (1,3-DAG 36:3), from EIC of m/z 601.9 min.
Table 6
Molecular species identified in simple lipids (NL) in maize flour (M) free lipid (FL) extract (M-FL-NL).
[M+NH4]+or other precursor ion (m/z) RTa(min) Major and (minor) molecular species; ACN:DBb Characteric ions in tandem mass spectra (m/z)
SE 678.8 21.1 680.7 21.1 Campesteryl-18:2 MS2681: 663c, 383.4d 682.8 21.1 692.8 21.1 Stigma/avenasteryl-18:2 MS2692: 675c, 395.4d 694.9 21.1 Sitosteryl-18:2 MS2694: 677c, 397.4d 696.9 21.1 Sitosteryl-18:1, Sitostanyl-18:2 MS2696: 679c, 397.4d, 399d TAG 869.1 26.2 871.1 26.0 52:5, 16:0/18:2/18:3 MS2871: 854c, 573d, 575d,597d 873.1 25.3 52:4, 16:0/18:2718:2 MS2873: 856c, 575d, 600d 875.1 24.8 52:3, 16:0/18:1/18:2 MS2875: 858c, 575d, 577d, 601d 877.1 24.5 52:2, 16:0/18:1/18:1 (16:0/18:0/18:2) MS2877: 860c, 575d, 577d, 579d, 603d 879.0 24.4 52:1, 16:0/18:0/18:1 MS2879: 862c, 577d, 579d, 605d 895.1 26.3 54:7, 18:2/18:3/18:2 MS2895: 878c, 597d, 599d 897.1 25.7 54:6, 18:2/18:2/18:2 MS2897: 880c, 599d 899.1 25.1 54:5, 18:2/18:1/18:2 MS2899: 882c, 599d, 601d 901.1 24.7 54:4, 18:1/18:2/18:1 (18:0/18:2/18:2) MS2901: 884c, 599d, 601d, 603d 903.2 24.4 54:3, 18:1/18:1/18:1 MS2903: 886c, 603d 905.2 24.3 54:2, 18:1/18:0/18:1 MS2905: 888c, 603d, 605d 907.3 24.2 54:1, 18:1/18:0/18:0 MS2907: 890c, 605d, 607d DAG 610.7 49.9 1,3-34:2, 16:0/18:2 575.7 50.0 MS2575: 239e, 263e 610.7 51.8 1,2-34:2, 16:0/18:2 MS2610: 575f, 313d, 337d 612.8 49.8 1,3-34:1, 16:0/18:1 577.7 49.8 MS2577: 239e, 265e 612.8 51.7 1,2-34:1 632.8 50.2 1,3-36:5 MS2632: 615c, 597f, 597.6 50.1 632.8 52.0 1,2-36:5 634.8 50.0 1,3-36:4 MS2634: 617c, 599f 599.7 50.0 634.8 51.9 1,2-36:4, 18:2/18:2 (18:1/18:3) MS2634: 617c, 599f, 339d, 337d, 335d 636.8 49.8 1,3-36:3, 18:2/18:1 MS2636: 619c, 601f, 599 601.7 49.8 MS2601: 263e, 265e 636.8 51.7 1,2-36:3, 18:2/18:1 MS2636: 619c, 601f, 339d, 337d 638.8 49.7 1,3-36:2, 18:1/18:1 MS2638:621c, 603d, 601 603.8 49.7 MS2603: 265e 638.8 51.5 1,2-36:2, MS2638: 621c, 603f, 339d FA 273.3/274.4 30.2 16:0 MS2274: 257g 296.3 31.6 18:3 MS2296: 279g, 261e, 243h 298.3 30.7 18:2 MS2298: 281g, 263e, 245h, 227 300.3 30.1 18:1 MS2300: 283g 301.3 29.8 18:0 S 383.4 52.5 Campesterol cf. Fig. 16H 395.5 52.7 Stigma/avenasterol cf. Fig. 16F 397.5 52.5 Sitosterol cf. Fig. 16D 399.5 44.9 Sitostanol cf. Fig. 16B MAG 348.4 66.6 16:0 MS2348: 331c, MS2331: 313 370.3 66.6 18:3 372.4 66.6 18:2 MS2372: 355c, 337f, 28g, 263e, 245h 374.4 66.5 18:1 MS2374: 357c, 339f, 28g, 265e, 247h 376.4 66.5 18:0 MS2376: 359c, 341f
aRetention time in minutes.
bNumber of acyl group carbons: number of double bonds. c [(M+NH 4)-NH3]+. d[(M+NH 4)-NH3-FA]+. e[Acyl]+. f [(M+NH 4)-NH3–H2O]+. g[Acid+H]+. h[Acyl-H 2O]+.
acid. The MS2for [M+NH
4]+ions with m/z 296.0 at 33.0 min showed [protonated FA 18:3]+ions with m/z 279.2, [acyl 18:3]+ions with m/z 261.2 and [acyl 18:3-H2O]+ions with m/z 243.2 (Fig. 8B)—which pointed at linolenic acid. The EIC for [M+NH4]+ions with m/z 298.4 and the corresponding MS2data at 31.5 min (Fig. 8A) unfolded two
peaks for each FA species; the MS2of the former and latter peaks were similar (data not shown). In addition, specific ions for identi-fication of palmitic and oleic acids are shown inTable 6.
Examples of MS2 data from EIC of sterol fragment ([M+NH 4 -NH3]+) ions, for identification of S in M-FL-NL, are provided in
Fig. 8. Tandem MS data recorded in the auto-MS2mode for extracted ion chro-matograms (EIC) of fatty acids (FA) in simple lipids (NL) fraction from maize flour (M) free lipids (FL) extract (M-FL-NL) (recorded using the elution program inTable 2): (A) MS2at 31.5 min (FA 18:2), from EIC of m/z 398.4 and (B) MS2at 33.0 min (FA 18:3), from EIC of m/z 296–287.
Fig. 9: MS2for ions with m/z 399.0 at 44.8 min (sitostanol fragment ion) are shown inFig. 9A, whereas MS2 for ions with m/z 397.0 at 53.1 min (sitosterol fragment ion—which was similar to that of sitosterol standard) are shown inFig. 9B. The MS2for ions with m/z 395.0 at 52.6 min (stigma/avenasterol fragment ion) are shown in Fig. 9C, and that for ions with m/z 383.0 at 52.3 min (campesterol fragment ion—which was similar to that of campesterol standard) are inFig. 9D. The MS2for sitosterol and campesterol in our data (Fig. 9B and D, respectively) were similar to those in rapeseed oil [21].
The EIC of MAG in M-FL-NL using the chromatographic condi-tions tabulated inTable 2and recorded in auto-MS2mode, coupled with their MS and tandem MS (not shown) assisted the mass spec-trometric identification of MAG. The MS2for [M+NH
4]+ion with
Fig. 9. Tandem MS data recorded in the auto-MS2mode for extracted ion chro-matograms (EIC) of S in simple lipids (NL) fraction from maize flour (M) free lipids (FL) extract (M-FL-NL) (recorded using the elution program inTable 2): (A) MS2 at 44.8 min (sitostanol), from EIC of m/z 399–400; (B) MS2at 53.1 min (sitosterol), from EIC of m/z 397–398; (C) MS2at 52.6 min (stigma-/avenasterol), from EIC of m/z 395–396; and (D) MS2at 53.3 min (campesterol), from EIC of m/z 383–384.
m/z 374.0 at 66.5 min showed relatively abundant [(M+NH4)-NH3]+ (82%) and [(M+NH4)-NH3-H2O]+ions (100%), with m/z 357.4 and 339.3, respectively, and low intensity [protonated FA 18:1]+(5%) and [acyl 18:1]+ions (7%), with m/z 283.1 and 265.1, respectively – which were consistent with MAG 18:1. In the MS2for [M+NH
4]+ion with m/z 372.0 at 66.6 min, abundant [(M+NH4)-NH3]+(100%) and [(M+NH4)-NH3-H2O]+ions (56%), with m/z 355.3 and 337.3, respec-tively, are shown, as well as a low intensity [protonated FA 18:2]+ ion with m/z 281.3, and medium intensity [acyl 18:2]+(42%) and [acyl 18:2-H2O]+ions (28%), with m/z 263.1 and 245.1, respectively: this is clearly consistent with MAG 18:2.
The MS2 data for identification of MAG in M-FL-NL extract, recorded using an elution program similar to that inTable 2except that the flow rate was 0.15 mL/min in the time frame 0–75 min, are shown inFig. 10. Unlike what was observed in the data described above, the MS2for [M+NH
4]+ions with m/z 348.0 and 376.0 showed [(M+NH4)-NH3]+ions with m/z 331.0 and 359.0, respectively, and low intensity [(M+NH4)-NH3-H2O]+ions with m/z 312.8 and 341.0, respectively (Fig. 10A and C). The MS2for the [(M+NH
4)-NH3]+ion with m/z 331.0 shows abundant [(M+NH4)-NH3-H2O]+ ions with m/z 313.0 (Fig. 10B); these data indicate MAG 16:0 and MAG 18:0, respectively. The MS2for [M+NH
4]+ions with m/z 374.0 and 372.0 (Fig. 10D and E) indicated abundant [(M+NH4)-NH3]+ions with m/z 357.0 and 355.0, respectively, abundant [(M+NH4)-NH3-H2O]+ions with m/z 339.0 and 337.0, respectively, low to medium intensity [acyl 18:1]+and [acyl 18:2]+ions, with m/z 265.0 and 263.0, respec-tively, and low to medium intensity [acyl 18:2]+ ions, with m/z 247.0 and 245.0, respectively. These MS2data were similar to those described above, except that the intensity inFig. 10D and E was ca. 10-fold.
Microbore, small particle-size silica gel columns for separa-tion, followed by ELSD and ESI-MS for detecsepara-tion, were successfully employed in the analysis of NL. The column chosen—packed with 3m-particles, offers considerable advantages in terms of resolu-tion when compared with (the widely used) 5m counterpart. A guard column proved also advantageous in extending the column lifetime. On the other hand, an auto-sampler and a data handling station have turned the proposed method into a fully automated one.
Identification of HPLC peaks was carried out partly by compar-ison of the RT in ELSD chromatograms with those of reference compounds in standard mixtures, and by electrospray tandem mass spectrometry—which could as well be successfully used to confirm said identification, based on comparison of retention data. Ion chromatograms and MS (and especially tandem MS) are indispensable to accurately identify the peaks showing up in ESI-EIC and NP-HPLC-ELSD chromatograms. In addition, simi-lar operation conditions can eventually be applied to analyze all simple lipids (NL) found in the feedstocks tested. NP-HPLC–ESI-MS and -NP-HPLC–ESI-MS2 thus provided extra advantages, in attempts to determine molecular species within the broad range entertained by NL.
The neutral lipid (NL) composition of cereal extracts is often determined by isolation of lipid classes via thin-layer chromatog-raphy (TLC), after addition of an internal standard to each fraction,
Discussion
Identification of NL classes and molecular species in each lipid class
Fig. 10. Tandem MS of MAG in simple lipids (NL) fraction from maize flour (M) free lipids (FL) extract (M-FL-NL) (recorded in auto-MS2mode and using an elution program similar to that inTable 2, except that the flow rate was 0.15 mL/min in the time frame 0–75 min): (A) MS2of ion with m/z 348 at 60.3 min (monopalmitin); (B) MS2of ion with m/z 331 at 59.2 min, i.e. the major fragment in (A); (C) MS2of ion with m/z 376 at 58.7 min (monostearin); (D) MS2of ion with m/z 374 at 59.4 min (mono-olein); and (E) MS2of ion with m/z 372 at 59.8 min (monolinolein).
followed by transesterification of acylglycerol and SE fractions, and determination of the FA methyl esters formed by gas liquid chro-matography (GC)[31]. Furthermore, solid-phase extraction (SPE) [32]and HPLC[19,20]have been used for analysis of NL.
The introduction of normal phase (NP) HPLC with ELSD by Christie[19,20]—for analysis of lipids from biological tissues, has led to a rather useful tool with a long list of applications. He indeed separated and quantified CE, TAG, DAG, FA and several PhL on a 150 mm× 5 mm i.d. silica column with 3 m-particle size, using a ternary gradient. Several studies with 100 mm× 3 mm to 300 mm× 4.6 mm i.d. columns, with 5–10 m-particle size silica gel, demonstrated their possibility to yield: CE and TAG fractions, FA and TAG fractions, and FA, cholesterol (C), 1,2(2,3)-DAG and 1,3-DAG fractions, using three different eluant mixtures and spec-trometric detection[33]; SE + TAG, TAG, S and FA fractions of wheat lipid extracts, using ternary gradient and ELSD[34]; and TAG, FA, C and DAG fractions of cell culture NL using isocratic elution, and ELSD and other forms of detection[35]. A 250 mm× 4 mm i.d. col-umn with 5m-particle size Diol phase, followed by ELSD, resolved and detected all lipid classes except CE in fish extracts[36], whereas a 150 mm× 2 mm i.d. column with polymerized vinyl alcohol on 5m-silica gel coupled with ELSD was able to separate C, DAG and MAG fractions of standard lipid mixtures[37].
Conversely, Liu et al.[38]succeeded in separating all simple lipid classes (SE, TAG, FA, DAG, MAG and S fractions of peanut oil) in a 150 mm× 4.6 mm i.d. column with 10 m-particle size silica, via a binary eluant gradient. Foglia and Jones[39]obtained CE, FA, TAG, C, 1,3-DAG, 1,2(2,3)-DAG and 1-MAG fractions of standard lipid mixtures on a 250 mm× 4.6 mm i.d. cyanopropyl column using a binary eluant gradient; and Homan and Anderson[40]resolved CE, TAG, C, DAG, FA and MAG fractions of standard mixtures and tissue extracts on a 100 mm× 4.6 mm i.d. column with 5 m-particle-size silica gel, using a ternary eluant gradient, followed by ELSD detection. Furthermore, silica gel columns have been employed for determination of simple lipids in human plasma[41,42], and a cyanopropyl column has been successfully used in the separation of short- and long-chain TAG[43]; a 250 mm× 4.6 mm i.d. silica gel column with 3m-particle size proved successful in separating
regioisomers of acetate and propionate TAG[43]; and two (or three) 100 mm× 2 mm i.d. silica columns in series, each of 3 m-particle size, could resolve regioisomers of acetate, butyrate and caproate TAG[30,44].
Recall that Duffin et al.[22]performed fundamental studies on CID of TAG, DAG and MAG ammonium adducts produced by ESI. A number of other works dealing with ESI-MS2 of TAG ammo-nium adducts have been reviewed elsewhere[21], in attempts to identify molecular species of simple lipids by tandem MS of said ammonium adducts – in which the fragmentation mechanism of acylglycerols was studied by flow injection MS2and MS3. Wu et al. [23]characterized TAG, DAG, FA and tocopherols by ESI ionization Fourier transform ion cyclotron resonance MS. Atmospheric pres-sure chemical ionization MS was applied by Mu et al.[11]when studying molecular species of TAG and DAG in a structured lipid sample, by Holˇcapek et al.[12] for characterization of TAG and DAG composition of plant oils, and by Nagy et al.[24]for MS-based chemometric characterization of olive oil TAG, DAG; Schiller et al. [25]used in turn matrix-assisted laser desorption MS for analysis of DAG and phospholipids. Duffin et al.[26]used precursor ion tandem MS for identification of ESI-ionized CE in tissue extracts, and Kalo and Kuuranne[27]did likewise for determination of CE in butterfat and SE in vegetable oil samples. Hsu and Turk[28]analyzed dilithi-ated adducts of long-chain unsaturdilithi-ated FA using positive ESI-MS and MS2, and Kalo et al.[21]identified ESI-produced ammonium adducts of FA by MS2and MS3.
Myher et al.[45]estimated the molecular species of corn oil TAG, on the basis of ion sum, by RP-LC with direct liquid inlet mass spectrometry. Mottram et al.[46]used RP-LC-APCI-MS for identi-fication of maize oil TAG and DAG species, Holˇcapek et al.[12]for identification of corn oil TAG species and estimation of their ratios by peak areas, and Jakab et al.[47]for identification of corn germ oil TAG species and estimation of their ratios also by peak areas.
The molecular species of TAG identified in the present study (Table 6) are similar to those identified by Myher et al.[45] – with the exception that 16:0/18:2/18:3 and 18:1/18:0/18:0 were not identified there, and that TAG with two or three palmitoyl residues were missing in our data. Furthermore, the
predom-inant regioisomer in our study could be deduced from CID; there is also a relatively good similarity with the TAG species identified by RP-LC-APCI-MS [12,46, 47]. Relative to our data, Mottram et al. [46] identified higher number of TAG species, including TAG with C17, C20, C22 and C24 acyls. In general, the regioisomers identified were the same as in our study, except that the predominant regioisomers in the present study vs.[46] were 18:2/18:3/18:2 vs. 18:2/18:2/18:3, 18:2/18:1/18:2 instead of 18:2/18:2/18:1, 16:0/18:0/18:2 instead of 16:0/18:2/18:0 and 16:0/18:0/18:1 instead of 16:0/18:1/18:0. Holˇcapek et al.[12] iden-tified a higher number of TAG species (18) than in this study (13). For most TAG species, the same regioisomer was identified in the present study and elsewhere[12], except 18:2/18:3/18:2 instead of 18:2/18:2/18.3, 18:2/18:1/18:2 instead of 18:1/18:2/18:2 and 16:0/18:0/18:1 instead of 16:0/18:1/18:0.
Molecular species of TAG identified elsewhere in corn germ were similar to those reported by us. However, our intensities of 16:0/18:2/16:0 and 16:0/18:1/16:0 ammonium adducts were so low that MS2could not be recorded; on the other hand, the TAG species 18:1/18:0/18:0, 16:0/18:0/18:1 and 16:0/18:0/18:2 were not identified by Jakab et al.[47]. In general, the regioisomers iden-tified were the same in both studies, except 18:2/18:3/18:2 instead of 18:2/18:2/18:3, 18:2/18:1/18:2 instead of 18.2/18:2/18:1, 18:1/18:2/18:1 instead of 18:1/18:1/18:2 and 18:1/18:0/18:1 instead of 18:0/18:1/18:1.
The method developed to specifically analyze NL classes via normal phase HPLC-ELSD is reproducible and produces a baseline separation for all NL classes in the following order: SE, HMW-TAG, FA, LMW-HMW-TAG, DAG, S and MAG. This method apparently represents a novel analytical approach to resolve NL in cereals and baking products. Furthermore, the RT did not appreciably change—neither did the back-pressure; significant loss in resolu-tion was also not detected. The 1,3-DAG, S and 1,2(2,3)-DAG were accordingly resolved to the baseline. However, there was varia-tion in their eluvaria-tion order: in the present data pertaining to simple lipids of M-FL-NL—using the elution gradient program described in Table 2, the elution order was 1,3-DAG, S and 1,2(2,3)-DAG, whereas in a previous paper encompassing rapeseed oil[21], the order was S, 1,3-DAG and 1,2(2,3)-DAG. This variation may be caused by con-tamination of the column with impurities or residual extraneous material. This variation does not disturb the analysis using ESI-MS IC, but will need regular control with standard mixtures and calcu-lation of RT or retention indices in the NP-HPLC-ELSD analysis to ensure full accuracy.
Short- and medium-chain TAG were fully separated relative to the baseline, but long-chain TAG only partially; and TAG with the same chain length but different degrees of unsaturation were par-tially separated as well. Conversely, FA, DAG and MAG possessing distinct chain lengths could be separated to a limited extent. All NL but MAG were eluted at the (optimum) flow rate of 0.1 mL/min, within a total run time of 76 min. A post-run time of 54 min with hexane between runs appeared to be critical to re-equilibrate the column(s).
A good analytical performance was experienced within a wide concentration range of lipid classes of actual foods, viz. maize and rye flour lipid extracts, as well as some edible oils. The method described in this paper was in fact characterized by a good qual-ity in terms of analysis of NL in plant tissues and edible oils; lipids accordingly eluted in descending order of chain length, but in ascending order of number of double bonds. NP-HPLC-ESI-MS and -MS2thus represent a rather suitable means for identification and quantification of simple lipids within the same lipid class—not only those bearing distinct chain lengths, but also simple lipids with different number of double bonds. The novel technique described here is consequently of interest for qualitative characterization and quantitative determination of NL classes and molecular species
of NL in plant tissues and baked items (should appropriate cal-ibration curves be available in advance). Hence, combination of NP-HPLC with MS will provide reliable identification of NL molec-ular species—which far exceeds the capabilities of either technique by itself.
Several members of the Regional Directorate of Agriculture of Entre-Douro-e-Minho (DRAEDM, Portugal) and several local farm-ers are hereby gratefully acknowledged for their cooperation, on a volunteer basis, in terms of sample supply. Financial support for author J.M.R. was provided by a Ph.D. fellowship within pro-gram PRAXIS XXI, ref. PRAXIS XXI/BD/16060/98, administered by Fundac¸ão para a Ciência e a Tecnologia (Portugal) and supervised by author F.X.M. Partial financial support was received within program PAMAF – IED, administered by Ministério da Agricultura, Desen-volvimento Rural e Pescas (Portugal) and coordinated by author F.X.M., through research grant “Pão de milho: caracterizac¸ão do processo tradicional de produc¸ão e melhoramento tecnológico”, ref. PAMAF 1022.
Supplementary data associated with this article can be found, in the online version, atdoi:10.1016/j.chroma.2010.02.034.
[1] F. MacRitchie, Cereal Chem. 58 (1981) 156.
[2] J.F. Panozzo, M.C. Hannah, L. O’Brien, F. Bekes, J. Cereal Sci. 17 (1993) 47. [3] N.O. Carr, N.W.R. Daniels, P.J. Frazier, Crit. Rev. Food Sci. Nutr. 31 (1992) 237. [4] O.K. Chung, Y. Pomeranz, Baker’s Digest 51 (1977) 32.
[5] O.K. Chung, Y. Pomeranz, K.F. Finney, Cereal Chem. 55 (1978) 598. [6] O.K. Chung, Y. Pomeranz, Baker’s Digest 55 (1981) 38.
[7] O.K. Chung, Cereal Foods World 31 (1986) 242. [8] W.R. Morrison, J. Cereal Sci. 8 (1998) 1. [9] Y. Pomeranz, Cereal Foods World 30 (1985) 443. [10] Y. Pomeranz, Cereal Foods World 25 (1980) 656.
[11] H. Mu, F. Sillen, C.-E. Høy, J. Am. Oil. Chem. Soc. 77 (2000) 1049.
[12] M. Holˇcapek, P. Jandera, P. Zderadiˇcka, L. Hrubá, J. Chromatogr. A 1010 (2003) 195.
[13] R.D. Plattner, G.F. Spencer, R. Kleiman, J. Am. Oil Chem. Soc. 54 (1977) 511. [14] W.W. Christie, J. High Resolut. Chromatogr. Chromatogr. Commun. 10 (1987)
148.
[15] B. Nikolova-Damyanova, B.G. Herslöf, W.W. Christie, J. Chromatogr. 609 (1992) 133.
[16] R.O. Adlof, J. Chromatogr. A 741 (1996) 135. [17] R.D. Plattner, K. Payne-Wahl, Lipids 14 (1979) 152. [18] S.H. Rhodes, A.G. Netting, J. Chromatogr. 448 (1988) 135. [19] W.W. Christie, J. Lipid Res. 26 (1985) 507.
[20] W.W. Christie, J. Chromatogr. A 361 (1986) 396.
[21] P.J. Kalo, V. Ollilainen, J.M. Rocha, F.X. Malcata, Int. J. Mass Spectrom. 254 (2006) 106.
[22] K.L. Duffin, J.D. Henion, J.J. Shieh, Anal. Chem. 63 (1991) 1781. [23] Z. Wu, R.P. Rogers, A.G. Marshall, J. Agric. Food Chem. 52 (2004) 5322. [24] K. Nagy, D. Bongiorno, G. Avellone, P. Agozzino, L. Ceraulo, K. Vékey, J.
Chro-matogr. A 1078 (2005) 90.
[25] J. Schiller, J. Arnold, S. Bernard, M. Müller, S. Reichl, K. Arnold, Anal. Biochem. 267 (1999) 46.
[26] K. Duffin, M. Obukowicz, A. Raz, J.J. Shieh, Anal. Biochem. 279 (2000) 179. [27] P. Kalo, T. Kuuranne, J. Chromatogr. A 935 (2001) 237.
[28] F.-F. Hsu, J. Turk, J. Am. Soc. Mass Spectrom. 10 (1999) 600. [29] E.G. Bligh, W.J. Dyer, Can. J. Biochem. Physiol. 37 (1959) 9.
[30] P. Kalo, A. Kemppinen, V. Ollilainen, A. Kuksis, Int. J. Mass Spectrom. 229 (2003) 167.
[31] W.R. Morrison, S.L. Tang, K.D. Hargin, J. Sci. Food Agric. 31 (2006) 329. [32] J.G. Hamilton, K. Comai, Lipids 23 (1988) 1146.
[33] J.G. Hamilton, K. Comai, Lipids 23 (1988) 1150.
[34] F.D. Conforti, C.H. Harris, J.T. Rinehart, J. Chromatogr. 645 (1993) 83. [35] E.J. Murphy, T.A. Rosenberger, L.A. Horrocks, J. Chromatogr. B 685 (1996) 9. [36] C. Silversand, C. Haux, J. Chromatogr. B 703 (1997) 7.
[37] F.S. Deschamps, P. Chaminade, D. Ferrier, A. Baillet, J. Chromatogr. A 928 (2001) 127.
[38] J. Liu, T. Lee, E. Bobik, M. Guzman-Harty, C. Hastilow, J. Am. Oil Chem. Soc. 70 (1993) 343.
[39] T.A. Foglia, K.C. Jones, J. Liq. Chromatogr. Related Technol. 20 (1997) 1829.
Acknowledgements
Appendix A. Supplementary data
[40] R. Homan, M.K. Anderson, J. Chromatogr. B 708 (1998) 21.
[41] T. Seppänen-Laakso, I. Laakso, H. Vanhanen, K. Kiviranta, T. Lehtimäki, R. Hiltunen, J. Chromatogr. B 754 (2001) 437.
[42] J.J. ´˚Agren, M. Hallikainen, H. Vidgren, T.A. Miettinen, H. Gylling, Clin. Chim. Acta 366 (2006) 309.
[43] T.J. Mangos, K.C. Jones, T.A. Foglia, Chromatographia 49 (1999) 363.
[44] P. Kalo, A. Kemppinen, V. Ollilainen, A. Kuksis, Lipids 39 (2004) 915. [45] J.J. Myher, A. Kuksis, L. Marai, F. Manganaro, J. Chromatogr. 283 (1984)
289.
[46] H.R. Mottram, S.E. Woodbury, R.P. Evershed, Rapid Commun. Mass Spectrom. 11 (1997) 1240.

![Fig. 3. Electrospray tandem mass spectra (ESI-MS 2 ) of fatty acid (FA) standards (recorded using the elution program in Table 2, except that the flow rate was 0.15 mL/min in the time frame 0–75 min): (A) MS 2 of [M+NH 4 -H] + ion with m/z 273 (palmitic aci](https://thumb-eu.123doks.com/thumbv2/123dok_br/15636190.1056876/6.892.207.673.90.268/electrospray-tandem-spectra-standards-recorded-elution-program-palmitic.webp)