*Correspondence: C. B. G. Bottoli. Instituto de Química, Universidade Estadual de Campinas, Caixa Postal 6154, 13084-971 - Campinas - SP, Brazil. E-mail: [email protected]
A
vol. 47, n. 4, oct./dec., 2011
Determination of parabens in sweeteners by capillary
electrochromatography
Carla Beatriz Grespan Bottoli
*, María de Jesús Santa Gutiérrez-Ponce, Valeska Soares Aguiar,
Walkyria Moraes de Aquino
Departament of Analytical Chemistry, Institute of Chemistry, University of Campinas, Brazil
Parabens, common food preservatives, were analysed by capillary electrochromatography, using a commercial C18 silica (3 µm, 40 cm × 100 µm i. d.) capillary column as separation phase. In order to optimise the separation of these preservatives, the effects of mobile phase composition on the separation were evaluated, as well as the applied voltage and injection conditions. The retention behavior of these analytes was strongly inluenced by the level of acetonitrile in the mobile phase. An optimal separation of the parabens was obtained within 18.5 minutes with a pH 8.0 mobile phase composed of 50:50 v/v
tris(hydroxymethyl)aminomethane buffer and acetonitrile. The method was successfully applied to the quantitative analysis of paraben preservatives in sweetener samples with direct injection.
Uniterms: Capillary eletrochromatography/quantitative analysis. Parabenos/determination. Sweeteners/ quantitative analysis.
Os parabenos, empregados como conservantes em alimentos, foram analisados por eletrocromatograia capilar, empregando uma coluna comercial recheada com partículas de sílica-C18 (3 µm, 40 cm × 100 µm d. i.) como fase estacionária de separação. Para otimizar a separação destes conservantes foram avaliados os efeitos da composição da fase móvel na separação, bem como a voltagem e as condições de injeção. O comportamento de retenção dos analitos foi fortemente inluenciado pela proporção de acetonitrila na fase móvel. A separação dos parabenos foi alcançada em 18,5 min com uma fase móvel contendo tampão tris(hidroximetil)aminometano e acetonitrila na proporção 50:50 v/v. O método foi aplicado na análise quantitativa de parabenos em adoçantes empregando a injeção direta das amostras.
Unitermos: Eletrocromatograia capilar/análise quantitativa. Parabenos/determinação. Adoçantes/
análise quantitativa.
INTRODUCTION
Capillary electrochromatography (CEC) is a separa-tion technique that combines the selectivity of separasepara-tions obtained by high-performance liquid chromatography
(HPLC) with the miniaturisation and high eficiency ob -tained by capillary electrophoresis (CE), leading to a new technique with better properties. However, the electropho-retic and chromatographic interactions in CEC make it a more complicated analytical technique than either HPLC or capillary zone electrophoresis (CZE). The column used in CEC is a capillary, as is the separation column of CE. However, the column is packed either with a silica-based
stationary phase or prepared to contain polymeric or silica-based monoliths, similar to those used in HPLC. Thus, the compounds migrate through the column according to their electric charge and according to their interaction with the stationary phase contained in the capillary column (Krull
et al., 2000).
The most frequent applications of CEC have been
mainly as a variant of HPLC in which the low of mobile phase through the column is maintained by an electric ield
rather than by applied pressure, resulting in an attractive analytical method that can be used to separate both neutral and charged compounds. In recent years, the number of publications related to this technique has been growing rapidly, probably because CEC has demonstrated some advantages, e.g., reduced time of analysis, higher
smaller amounts of solvents if compared to HPLC (Bragg
et al., 2008; Lerma-Garcia et al., 2008; Musenga et al., 2007; Valette et al., 2005). In the pharmaceutical and food industries, rapid, inexpensive and efficient separation techniques are essential. Currently, most of these analyses are performed by HPLC, but the characteristics and avail-ability of CE instrumentation have made CEC a technique
with potential in these industries. (Lerma-Garcia et al.,
2008; Huo et al., 2008)
The parabens are esters of p-hydroxybenzoic acid
that differ in the alkyl group linked to the ester functional group. The parabens have antimicrobial functions and thus act as preservatives in food, pharmaceuticals and cosmetics (De Rossi, Desiderio, 2002). The antibacterial and antifungal activity of these compounds increases with increasing alkyl chain length, but this increase reduces the solubility of these compounds in water. Thus, the best preservatives are those that combine the features of being both soluble and antimicrobial. This property is achieved by mixing two types of parabens, the methyl and propyl-parabens, which are thus found with great frequency in foods, cosmetics and drugs (Panusia, Gagliardi, 2008).
There is a limit to the maximum amount of alkyl-parabens that can be introduced into foods, cosmetics and medicines, although possible side effects are not yet known. Hypersensitivity reactions have been reported with the use of hydroxybenzoates and it has been reported that parabens possess oestrogenic activity (Darbre et al., 2002). Accord -ing to the European Economic Community, the maximum content of parabens in cosmetics should be less than 0.4% w/w. However, 0.8% w/w has been found in the form of 4-hydroxybenzoic acid (which acts both as metabolite and as degradation product of parabens after hydrolysis under acidic or alkaline conditions) (Kokoletsi et al., 2005). In pharmaceutical products, the limit is 1.0% w/w (Soni et al., 2001, European Economic Community, 1993).
Studies on the separation of parabens have been
de-veloped using HPLC. Kokoletsi et al. (2005)separated the
methyl and propylparabens found in raditidine oral liquid formulation using reversed-phase HPLC. They used a Nu-cleosil C18 column, UV detector at 254 nm and a mobile phase consisting of a mixture of aqueous ammonium ace-tate (0.5 mol L-1), acetonitrile and methanol, with gradient
elution. Samples of liquid pharmaceuticals were analysed and the chromatograms obtained presented a large number of peaks, indicating the presence of degradation product (4-hydroxybenzoic acid) and also the interaction between the parabens and the sorbitol existing in the sample.
Although CEC has been successfully used for the
analysis of pharmaceutical compounds (Huo, Kok, 2008;
Castro-Puyana et al., 2010), few studies have been
per-formed on the separation of parabens. The work of Huang
et al. (2004) used monolithic columns based on esters of methacrylates as stationary phase. For all analytes it
was observed that the capillary columns illed with more
porous monoliths resulted in reduced retention times of the compounds and optimisation of the separation was obtained with columns containing fewer pores in the stationary phase. With this type of column, a good separa-tion was achieved with a separasepara-tion time of 7.0 min, for thiourea, sorbic acid, benzoic acid and ethyl, propyl and butyl parabens using a mobile phase composed of pH 3.0 phosphate buffer: acetonitrile, 35:65 v/v. In another work,
Huang et al. (2006) used a monolithic capillary column
based on polystyrene-divinylbenzene. This column was used due to its high stability against large pH variations
of the medium. A third study, conducted by De Rossi and
Desiderio (2002), emphasised the separation of parabens in cosmetics and drugs in the presence of its main me-tabolite, 4-hydroxybenzoic acid. In this study, they used a capillary column packed with C18 stationary phase. The optimum conditions of separation were obtained using a
mobile phase consisting of 5.0 mmol l-1 ammonium
for-mate buffer at pH 3.0: acetonitrile, 35:65 v/v.
The present study describes the separation of alkyl-parabens by capillary electrochromatography and their
de-termination in sweeteners. A commercial capillary column illed with C18 silica particles was used. The conditions of
separation were improved to achieve the best separation
between the analytes, which were then quantiied.
MATERIALS AND METHODS
CEC instrumentation
CEC experiments were performed with a HP CE
instrument from Agilent Technologies (Waldbronn, Ger -many) equipped with a UV-visible diode-array detector and the option to apply pressures of 2-12 bar to the outlet and/or inlet vial. Data acquisition and processing were performed using HP Chemstation software.
A LC-10AD HPLC pump from Shimadzu (Kyoto,
Japan) was used to condition the column.
Chemicals and sample preparation
HPLC grade acetonitrile (ACN) was obtained from J.T.Baker (USA), and potassium dihydrogen phosphate
and dipotassium hydrogen phosphate were purchased
from Merck (Darmstadt, Germany). Tris(hydroxymethyl)
aminomethane (TRIS) and thiourea were purchased from
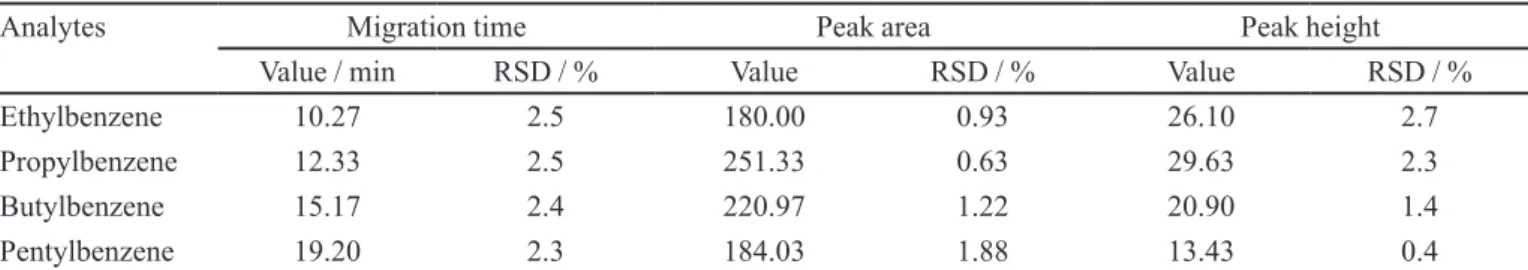
TABLE I - Chromatographic parameters of the test mixture and relative standard deviation (RSD) of repeatability for three analyses of the mixture, performed in one day
Analytes Migration time Peak area Peak height
Value / min RSD / % Value RSD / % Value RSD / %
Ethylbenzene 10.27 2.5 180.00 0.93 26.10 2.7
Propylbenzene 12.33 2.5 251.33 0.63 29.63 2.3
Butylbenzene 15.17 2.4 220.97 1.22 20.90 1.4
Pentylbenzene 19.20 2.3 184.03 1.88 13.43 0.4
propylbenzene, butylbenzene and pentylbenzene were the
constituents of the test mixture from Fluka (USA). The
solutions of the standard neutral mixtures were prepared by dissolving appropriate quantities of each compound in
ACN to obtain a 10 mg mL-1 solution.
The standards of parabens, butylparaben, ethylpara-ben, methylparaben and propylparaben were obtained
from Aldrich (USA). A standard mixture of parabens
(10 mg mL-1) in different volume ratios, as well as
thio-urea (5 mmol L-1), were prepared. The analytical curves
were constructed from three replicate measurements at
each concentration in the range of 250 to 1500 µg mL-1
(5 points). Thiourea (5 mmol L-1) was used as an
electro-osmotic low (EOF) marker.
Commercial sweeteners (liquid samples) were ob-tained from a supermarket in Campinas, Brazil, and used as samples for the determination of parabens in this study.
Without any sample preparation, the sweetener (200 µL)
was fortiied with 75 µL of standard analytes (10 mg mL-1)
and this mixture was completed with electrolyte until
1 mL. The solution was iltered and injected, and the op -timum CEC conditions were applied.
CEC conditions
A C18-silica column (3 µm particles, 40 cm effective lenght × 100 µm inner diameter) was purchased from Agi -lent (Waldbronn, Germany). The column was placed in the CE instrument and was equilibrated with the mobile phase under the following stepping conditions: 5 kV, 10 kV, 15 kV, 20 kV, 25 kV and 30 kV, applying 5 bar of pressure for 15 min each. The last condition was maintained until a stable base line was obtained. Samples and standards were electrokinetically injected into the capillary for 5 s at a voltage of 10 kV. Separations were carried out using an electrical voltage of 30 kV, and 254 nm was selected as the detection wavelength. Mobile phases were prepared
by mixing ACN and TRIS buffer (15, 25 and 50 mmol L-1)
in different volume ratios. 1 mol L-1 HCl was added to the
mobile phase solutions until a pH of 8.0 was achieved.
RESULTS AND DISCUSSION
The first step was to test the performance of the capillary CEC column. The column was conditioned with
ACN:H2O 80:20 v/v, using the HPLC pump for 2 h. The
performance was studied by analysing a neutral test mix-ture, thiourea, ethylbenzene, propylbenzene, butylbenzene and pentylbenzene. The electrolyte used for this study was
ACN : 25 mmol L-1 TRIS, pH 8.0, 70:30 v/v. The
separa-tion was performed at 30 kV at a temperature of 25 °C.
The samples were injected in the electrokinetic mode at 10 kV for 5 seconds. Table I shows the chromatographic parameters calculated for compounds of the test mixture and the relative standard deviation [RSD = (standard de-viation/mean) × 100] calculated for three analyses of the mixture performed in one day. The maximum RSD values observed were 2.50, 1.88 and 2.68% for migration times, peak areas and peak heights, respectively. These data
conirmed that the equipment and the column have good
repeatability and can be used for the intended purpose. The chemical structures of parabens used in this
study are shown in Figure 1. As it can be observed from
the chemical structures, parabens are neutral alkyl esters of 4-hydroxybenzoic acid. Due to the phenyl ring of the para-bens, these compounds are UV-detectable at extremely low concentrations. Neutral solutes are separated in CEC by partitioning between mobile and stationary phase, as in HPLC, but they move through the column with the EOF, as in CE. The retention mechanism of parabens is determined by hydrophobic interactions between the C18 stationary phase and the nonpolar moiety of each analyte and by interactions between the polar mobile phase and
sample molecules. In this study, the inluence of opera ting
parameters, such as the nature of the buffer electrolyte
and its concentration, amount of organic modiier, applied
voltage, and injection conditions were studied in order to optimise the CEC separation of these parabens.
Mobile phases consisting of TRIS, pH 8.0
on the separation of the parabens. The buffer TRIS was chosen because it has low mobility, which allows higher
concentrations of buffer to be used without signiicantly
increasing the current. The variation range of the current observed upon incorporating acetonitrile into the buffer solution within the concentration range 50-80% was 9
to 3.5 µA. A pH of 8.0 was chosen because the EOF at
this pH has greater stability, when compared to lower pH
values. The inluence of the ionic strength of the mobile
phase was evaluated using 15, 25 and 50 mmol L-1 TRIS.
It was observed thatboth 50 mmol L-1 and 15 mmol L-1
of the buffer electrolyte affected the stabilisation of base
line. Previous CEC studies (Yan et al., 1994; Smith,
Evans, 1994; Smith, Evans, 2005; Dittman et al., 2005)
have demonstrated that low buffer concentrations produce higher separation efficiencies, but in our experiment,
the use of 25 mmol L-1 TRIS produced reproducible and
highly eficient separations. An earlier paper (Huang et al.,
2006) had selected a mobile phase composed of ACN and
25 mmol L-1 phosphate buffer, pH 8.0, in the volume ratio
of 50:50 v/v as the optimal condition for paraben analyses. Thus, some experiments were performed using phosphate buffer and acetonitrile as mobile phase, but under these
conditions analyses were dificult, due to the long time
required to achieve good stability of the base line and due to the instability of the current.
FIGURE 1 - Chemical structures of a) methyl, b) ethyl, c) propyl and d) butylparabens
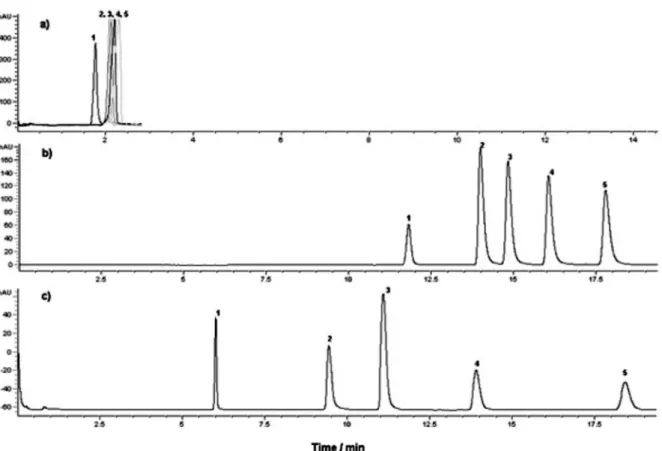
FIGURE 2 - Effect of mobile phase composition on the CEC separation of 5 mmol L-1. 1) thiourea and 1500 µg mL-12) methyl,
FIGURE 3 - Effect of applied voltage on the CEC separation of 5 mmol L-1 thiourea and 500 µg mL-1 parabens. Conditions: 25 mmol L-1 TRIS (pH 8.0):ACN, 50:50 v/v; 3 µm C18 stationary phase, 40 cm packing x 100 µm i.d.; applied voltage: 30 kV; electrokinetic injection, 5 s, 10 kV; temperature: 25.0 °C; UV detection: 254 nm.
Variation of the organic solvent in the buffer was also examined, since it is known that this variable affects the analysis time. Longer analysis times are expected as the proportion of organic solvent is decreased because of the
increased k value. With 80% acetonitrile, all compounds
coeluted. In the presence of 50% acetonitrile the duration of a run for parabens was only slightly longer (1.0 min)
in comparison with 70% acetonitrile, but with signiicant
effects on resolution. Figure 2 displays electrochromato-grams for the separation of parabens on a C18 stationary
phase using binary TRIS-ACN mixtures. The results are in
accordance with the literature (Schwer, Kenndler, 1991), with authors having reported the variation of the electro-osmotic velocity according to the content of the organic solvent in the electrolyte, thus indicating that a reduction of various types of organic solvent in the buffer led to an increase in electroosmotic velocity. In our experiment, using the CEC technique, the same results were obtained, except with 80% acetonitrile. In this case, the presence of two effects can be responsible for unexpected behavior of thiourea when 80% acetonitrile was used. One of these effects is the retention of analyte by the stationary phase and the control of this retention by varying solvent strength
in the mobile phase, i.e., a separation mechanism based on reversed-phase chromatography. The second effect is an increase in electroosmotic velocity when the proportion of organic solvent in the buffer decreases. Our experiments
showed that, in the presence of 80% acetonitrile, the irst
effect prevails, leading to lower migration time of thiourea, when compared to 70% acetonitrile.
The effect of the applied voltage on the CEC separa-tion of parabens was investigated using a mobile phase of
ACN: 25 mmol L-1 TRIS buffer at pH 8.0, 50:50 v/v. As
expected, retention times decreased when a higher voltage was applied. Figure 3 demonstrates the electrochromato-grams obtained when 15, 20, 25 and 30 kV were applied.
At 30 kV, the analytes eluted faster, with good resolution and eficiency. Based on these results, 30 kV was applied
for this separation.
The injection conditions were studied by varying the injection time and the voltage of the electrokinetic injection. Injection times lower than 5 seconds and 10 kV showed a decreased separation performance and loss of symmetry of the peaks. The optimum conditions for the
separation of the parabens were ACN: 25 mmol L-1 TRIS
injected in the electromigration mode by applying 10 kV for 5 s.
The intra-day and inter-day injection repeatability was verified by analysing a methyl and propylparaben
(1000 µg mL-1) analyte mixture in three consecutive
runs for three days, evaluating retention time, peak area and RSD% data. The maximum RSD values observed were 3.02 and 6.14%, for migration time and peak area, respectively. Under these experimental conditions, the
CEC system enabled quantiication of parabens in sweet -eners. Table II reports the relative regression equations,
the squared correlation coeficients and the quantiica -tion limits obtained. The concentra-tion of methylparaben
found in the sweetener was 2113 µg mL-1, which
corre-sponds to 0.21% w/v. For propylparaben, a concentration
of 1199 µg mL-1 was observed, corresponding to 0.12%
w/v. It was not possible to compare these values with the label information because the manufacturer did not declare these compounds on the labels. However, methyl and propylparabens are usually used in the range of 0.01 to 0.35% w/v of concentration in sweeteners.
CONCLUSIONS
In this study, a reliable CEC method was developed for the separation of parabens. The method can be applied
for quantiication of parabens in sweeteners that contain
various concentrations of methyl and propylparabens. The results of repeatability and linearity also showed that, by using commercially available instrumentation and packed capillary columns, the CEC technique has the potential to be used routinely in food analysis.
ACKNOWLEDGMENTS
The authors would like to thank Professor Susanne Rath for the donation of the standards of parabens and to acknowledge the financial support and fellowships
from Fundação de Amparo à Pesquisa do Estado de São Paulo (FAPESP), Conselho Nacional de Desenvolvimento Cientíico e Tecnológico (CNPq) and Instituto Nacional de
Ciência e Tecnologia de Bioanalítica (INCT-Bioanalítica).
REFERENCES
BRAGG, W.; NORTON, D.; SHAMSI, S.A. Optimized separation of β-blockers with multiple chiral centers using capillary electrochromatography-mass spectrometry. J. Chromatogr. B, v.875, n.1, p.304-316, 2008.
CASTRO-PUYANA, M.; CREGO, A.L.; MARINA, M.L. Recent advances in the analysis of antibiotics by CE and CEC. Electrophoresis, v.31, n.1, p.229-250, 2010.
DARBRE, P. D.; BYFORD, J. R.; SHAW, L. E.; HORTON, R. A.; POPE, G.S.; SAUER, M. J. Oestrogenic activity of isobutylparaben in vitro and in vivo. J. Appl. Toxicol., v.22, n.4, p.219-226, 2002.
DE ROSSI, A.; DESIDERIO, C. Fast capillary electro-chromatographic analysis of parabens and 4-hydroxybenzoic acid in drugs and cosmetics. Electrophoresis, v.23, n.19, p.3410-3417, 2002.
DITTMANN, M. M.; WIENAND, K.; BEK, F.; ROZING, G. P. Theory and practice of capillary electrochromatography.
LC-GC, v.13, n.10, p.800-814, 1995.
EUROPEAN ECONOMIC COMMUNITY. ECC.Instruction
n° 93/95. Brussels: Off. J. Eur. Comm., 1993. p.32-37.
H U A N G , H . - Y. ; C H I U , C . W. ; H U A N G , I . - Y. ; YEH, J. M. Analyses of preservatives by capillary electrochromatography using methacrylate ester-based monolithic columns. Electrophoresis, v.25, n.18-19, p.3237-3246, 2004.
HUANG, H.-Y.; HUANG, I.-Y.; LIN, H. Y. Separation of parabens in capillary electrochromatography using poly(styrenedivinylbenzene-methacrylic acid) monolithic column. J. Sep. Sci.,v.29, n.13, p.2038-2048, 2006.
H U O , Y. ; K O K , W. T. R e c e n t a p p l i c a t i o n s i n C E C .
Electrophoresis, v.29, n.1, p.80-93, 2008. TABLE II - Quantitative performance of parabens using the CEC method
Analytes equation (Y=A + BX)Relative regression R2 Error Calibration range / µg mL-1
(5 calibration levels)
Quantiication limit / µg mL-1
A B
KOKOLETSI, M. X.; KAFKALA, S.; TSIAGANIS, M. A novel gradient HPLC method for simultaneous determination of ranitidine, methylparaben and propylparaben in oral liquid pharmaceutical formulation. J. Pharm. Biomed. Anal., v.38, n.4, p.763-767, 2005.
KRULL, I. S.; STEVENSON, R. L.; MISTRY, K.; SWARTZ, M. E. Capillary electrochromatography and pressurized
low capillary electrochromatography. An introduction.
New York: HNB Publishing, 2000. p.1-32.
LERMA-GARCÍA, M. J.; SIMÓ-ALFONSO, E. F.; RAMIS-RAMOS, G.; HERRERO-MARTÍNEZ, J. M. Rapid determination of sterols in vegetable oils by CEC using methacrylate ester-based monolithic columns.
Electrophoresis, v.29, n.22, p.4603-4611, 2008.
MUSENGA, A.; MANDRIOLI, R.; FERRANTI, A.; D’ORAZIO, G.; FANALI, S.; RAGGI, M. A. Analysis of aromatic and terpenic constituents of pepper extracts by capillary electrochromatography. J. Sep. Sci., v.30, n.4, p.612-619, 2007.
PANUSIA, A.; GAGLIARDI, L. Counterfeit homeopathic medicinal products: syrups. A simple and rapid LC-ESI-MS method to detect preservatives not declared in label. J. Pharm. Biomed. Anal., v.47, n.4-5, p.786-789, 2008.
SCHWER, C.; KENNDLER, E. Electrophoresis in fused-silica capillaries: the inluence of organic solvents on the electroosmotic velocity and the ζ potential. Anal. Chem., v.63, n.17, p.1801-1807, 1991.
S M I T H , N . W. ; E VA N S , M . B . T h e a n a l y s i s o f pharmaceutical compounds using electrochromatography.
Chromatographia, v.38, n.9-10, p.649-657, 1994.
SMITH, N. W.; EVANS, M. B. The efficient analysis of neutral and highly polar pharmaceutical compounds using reversed-phase and ion-exchange electrochromatography.
Chromatographia, v.41, n.3-4, p.197-203, 1995.
SONI, M. G.; BURDOCK, G. A.; TAYLOR, S. L.; GREENBERG, N. A. Safety assessment of propyl paraben: A review of the published literature. Food Chem. Toxicol., v.39, n.6, p.513-532, 2001.
VALETTE, J. C.; DEMESMAY, C.; ROCCA, J. L.; VERDON, E. Potential use of an aminopropyl stationary phase in hydrophilic interaction capillary electrochromatography. Application to tetracycline antibiotics. Chromatographia, v.62, n.7-8, p.393-399, 2005.
YA N , C . ; S C H A U F E L B E R G E R , D . ; E R N I , F. Electrochromatography and micro high-performance liquid-chromatography with 320 µm I.D. packed-columns.
J. Chromatogr. A, v.670, n.1-2, p.15-23, 1994.
Received for publication on 23th June 2010