39
SYMBOLIC DATA ANALYSIS FOR THE ASSESSMENT OF USER
SATISFACTION: AN APPLICATION TO READING ROOMS
SERVICES
Aurea Sousa, PhD
University of the Azores, Mathematics Department; CEEAplA, Portugal
Licínio Tomás, PhD
University of the Azores, History, Philosophy and Social Sciences Department, CES, Portugal
Osvaldo Silva, PhD
University of the Azores, Mathematics Department; CMATI and CES, Portugal.
Helena Bacelar-Nicolau, PhD
University of Lisbon, Faculty of Psychology, Laboratory of Statistics and Data Analysis, Portugal.
Abstract:
This paper re-examines and deepens the study of a portion of the data collected within the context of a wider 2007 research project conducted in the Autonomous Region of Azores. The 2007 study aimed to understand users’ habits, attitudes and cultural practices, concerning reading and utilization of different library services, archives and museums. Based upon knowledge that only data analysis of a representative sample can supply, the study aimed to identify the aspects that should be prioritized in a process of restructuring the cultural services of leisure and reading to be implemented. This paper, utilizing data from the 2007 study, presents some results from the Ascendant Hierarchical Cluster Analysis (AHCA) of symbolic objects, according to the treatment to which they were submitted. These objects are described by different symbolic attributes pertaining to the latent variable ‘Degree of Satisfaction’. This variable was evaluated according to different dimensions of on-the-spot reading and consultation services. The aggregation criteria used in this study belong to a parametric family of methods and the similarity measure used is the weighted generalized affinity coefficient, for symbolic data. The validation of the clustering results is based on some validation measures.
Key Words: Ascendant Hierarchical Cluster Analysis, Symbolic Data, Affinity Coefficient, VL
Methodology.
Introduction
The increasing use of databases, often large ones, in diverse areas of study, including Sociology, makes it pertinent to summarise data in terms of their most relevant concepts. These concepts may be described by types of complex data, also known as symbolic data [1].
In a symbolic data table, lines correspond to symbolic objects (SO’s) and columns to symbolic
variables, which may contain not just one value, as usual, but values, such as subsets of categories,
intervals in real axes, or frequency distributions.
After a process of grouping, symbolic data can be used to describe the properties of the clusters obtained in terms of the initial variables, thus making it possible to summarize large sets of data. Some symbolic data sources can be found, for instance, in [1] and in [2]. It is important to stress that relational databases are an important source of symbolic objects, when we wish to study the properties of a set of units whose description needs the merging of several relations ([3]; [1]).
Stéphan [3] defines operators that can be used to retrieve groups of individuals from a relational database. The descriptions of groups are represented by assertions, in the formalism of symbolic data, which can be automatically obtained from a population or from a selected sample, and can be analysed using methods of Symbolic Data Analysis (SDA), which take under consideration a previous knowledge of the data (e.g., metadata) [4].
40 Based on the affinity coefficient between two discrete probability distributions as defined by Matusita [5], Bacelar-Nicolau [6] suggests the use of the affinity coefficient as a basic similarity coefficient between the columns or the lines of a data matrix. Later on she extended that coefficient to different types of data, including complex data (symbolic data) and variables of mixed types (heterogeneous data), possibly with different weights ([7]-[10]).
In the complex nature of cultural consumption, preferences show that in living practices there are different social denominators involved in the establishment of more long-lasting habits, which become the basis for daily reading routines. Despite several sorts of incentives, the interest in reading, in visiting museums or in attending libraries – as well as the regularity with which these occur – are still unequally distributed in the population. In most cases, these interests and activities are confined to groups with particular interests, such as those concerning to ludic or relaxing and recreational activities, cultural or professional enrichment.
The factors and the contexts related to the formation and development of such habits remain still somehow ambiguous, considering that this is still a relatively unknown process in the modern ways of life. There is, nonetheless, a certain number of indicators and information already contextualized and ready to be gathered and systematized through a set of categories, built and used specifically to serve the general purposes of this study.
The first part of the questionnaire used in the 2007 study, on the habits, attitudes and practices of readers and consumers of library services, included a filtering question: "Have you ever visited or
been to any public library in your region or island”, to which each of the 1684 respondents Answered
(Yes or No).
The data matrix obtained from the question of filtering was used to provide the basis for the analysis which this article seeks to outline, with some results concerning the application of some methods of Ascendant Hierarchical Cluster Analysis of symbolic objects. The applied approach using symbolic objects allows us to exhibit differences on the users’ degree of satisfaction according to a greater level of granularity, such as the island or the employment status. In this process was necessary to transform the standard data matrix (674 X 14) into two symbolic data matrices by the generation of symbolic objects.
We present, in Section 3, the main results of the Ascendant Hierarchical Cluster Analysis (of symbolic data) based on data from the wider 2007 study, conducted in the entire Autonomous Region of Azores. In the present work we consider different items/indicators used to measure the latent variable ‘Degree of Satisfaction’, which was evaluated according to several aspects of on-the-spot consultation and reading services.
Used Methods of Cluster Analysis
The purpose of cluster analysis (of classical data as well as of symbolic data) is to build, from a data matrix (N p), a classification which is appropriate for a set E of data units or a set Y of variables, with the purpose of obtaining “homogenous” clusters of objects in a population Ω or E, so
as to allow objects of the same cluster to present great similarity, whereas objects of different clusters will be much more different.
Given a matrix of proximity between symbolic objects, these can be classified through classical agglomerative hierarchical algorithm ([11]-[13]) or probabilistic ones [2]. Once we have obtained the matrix of the proximity between the elements of E, the classification can be obtained regardless of the fact that the data are symbolic [14]. This is the case of the algorithms of AHCA used in Section 3 of this paper.
The algorithms of AHCA for the case where the elements of a set E= {1,..., N} of symbolic objects are described by p symbolic variables, Y1,...,Yp, take as their starting point, like they do in
classical ones, the finest partition , with N clusters of a single symbolic object. If, at the j-th stage, clusters A and B are put together, a new partition resulting from that stage, is defined as follows: . The process includes N-1 stages and ends when the less fine partition {{E}} has been obtained, which is composed of a single cluster containing all of the N symbolic objects. Thus, if in the first stage of the process there are N clusters, in the second one there will be N-1, and so forth, since in each new step a new cluster is formed, by joining two previously formed clusters [2]. × s P0
,
s jP
{ }
(
P
A
,
B
)
{
A
B
}
P
js=
js−1−
∪
∪
41
Comparison measures
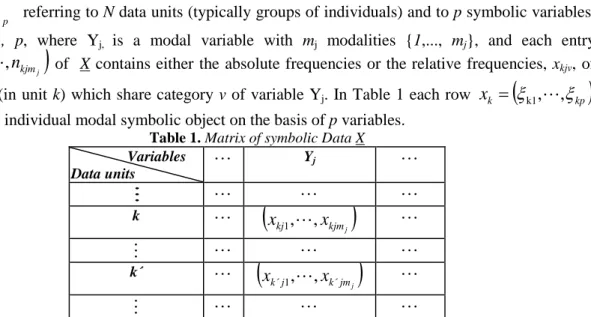
The data matrices analysed in Section 3.2 generically correspond to symbolic data tables referring to N data units (typically groups of individuals) and to p symbolic variables, Yj, j=1, ..., p, where Yj, is a modal variable with mj modalities {1,..., mj}, and each entry
of X contains either the absolute frequencies or the relative frequencies, xkjv, of
individuals (in unit k) which share category v of variable Yj. In Table 1 each row
describes an individual modal symbolic object on the basis of p variables.
Table 1. Matrix of symbolic Data X
Variables Data units
Yj
k
k´
Taking as their starting point a table like Table 1, Nicolau and Bacelar-Nicolau ([15]; [8], [9]) suggest the use of the weighted generalized affinity coefficient in cases where symbolic objects are described by vectors of p probabilities or frequency distribution, or in case of some other data support to which this sort of description could be extended, such as histograms and variables whose values are intervals of real axes.
Let Akk’=(akk’jj’), be a table associated with the pair of symbolic objects (Ok, Ok’),
where akk’jj’ is the (partial, local or variable-specific) affinity coefficient between the frequency distributions , , corresponding to the variables j and j’ ([8]; [15]):
, , mj=mj’,
where is the number of individuals belonging to the data unit (group k) for which the variable Yj (Yj’) has been observed and . It is important
to note that the value 1 is obtained if the frequency distributions and are identical or proportional and that the result is value 0 if they are orthogonal. For a binary variable the variable-specific affinity similarity coefficient turns out to be the so called Ochiai coefficient ([8]).
Let , be a table of weights to be used in the convex linear combination, with ≥0 and . The weighted generalised affinity coefficient between Ok and Ok’ is
given by:
(1) and takes values in [0, 1]. In fact, this coefficient is a general similarity coefficient, which uses all the information included in the matrix (p p), Akk’, of the similarity coefficients crossing the p
laws which describe the symbolic objects Ok and Ok’, and is defined by a convex linear combination
of the values of this matrix ([15]).
The used probabilistic aggregation criteria in the present work (AVL, AV1 and AVB) in the scope of the probabilistic approach of AHCA, named VL methodology (V for Validity, L for Linkage) resorts, essentially, to probabilistic notions for the definition of the comparative functions. In fact, the
( )
kj N pX
=
ξ
×(
n
kj1,
,
n
kjmj)
ij=
ξ
(
kp)
kx
=
ξ
k1,
,
ξ
(
)
j kjm kjx
x
1,
,
(
)
j jm k j kx
x
´ 1,
,
´
, ' , 1≤ j j≤ p kj ξ ξk´j'(
)
∑
= = = j m 1 k´j. k´j kj. kj k´j kj kk jj n n . n n ,ξ ξ aff a ' ' ' ' ' 1≤ j,j'≤ p∑
==
j m 1 kj kj.n
n
=∑
= ' ' ' j m 1 kj . kj n n (
ξ ,ξ)
1 aff 0≤ kj k´j' ≤ kj ξ ξk´j´( )
j j p Pkk' =π
jj' , 1≤ , '≤ ' jjπ
1 ' , 1 ' =∑
≤ ≤j j p jjπ
( )
' ' , 1 ' ' * ' , jj p j j kk jj a k k a∑
π
≤ ≤ = ×42 VL-family is a set of agglomerative hierarchical clustering methods, based on the cumulative distribution function of basic similarity coefficients ([7]; [16]).
The analysis of the symbolic data matrices was done by using the weighted generalised affinity coefficient ([15]; [8]; [2]), with the weight option: πjj’=1/p if j=j’ and πjj’=0 if j≠j’ [15]. The measure
of comparison between the elements was combined with classical aggregation criteria, Single Linkage (SL) and Complete Linkage (CL), and probabilistic ones, AVL, AV1 and AVB ([7]; [16]).
Validation measures
Let E be a set of elements to classify, of cardinal N, and a partition in c clusters of E. When the cardinality of E is high, it is useful to achieve a reduced or condensed hierarchy to the more representative levels. For this reason, the values of validation indexes ([2]; [17]) obtained from the values of the proximity matrix between elements, such as, for instance, the global statistics of levels, STAT, [6] can also be calculated, even in the case of symbolic data matrices.
On what validation of results is concerned, in this paper we chose to use some of the validation indexes mentioned in [2] and in [17], namely the STAT, DIF [6], P(I2mod, ∑) and γ from Goodman and Kruskal indexes. To determine the appropriate number of clusters we used measures defined in the present section adapted for the case of similarity measures.
Considering , the global statistics of levels (STAT) ([6]) is defined by: , where (2)
, CB = #(G(PI) ∩ (R x S)),
represents the graph of the initial preordination defined in F F, R is the set of the pairs of elements joined in the same cluster and S is the set of separated pairs.
Bacelar Nicolau ([6]) proposed the calculation of the values of STAT for each level (K=1 ,..., m, where m represents the total number of levels) of the hierarchy of classification and the values of the:
DIF(k) = STAT(k)-STAT(k-1). (3)
The P(I2mod, ∑) measure ([2]; [17]) is a normalization of the P(I2, ∑) measure, reported in [14],
and is defined as:
, (4) where sij is a similarity measure between the elements i and j, is the number of elements of
the cluster Cr , N is the number of elements to classify and c is the number of clusters of the partition.
The γ index, proposed by Goodman and Kruskal, has been widely used ([14]). Comparisons are made between all within-cluster similarities sij and all between-cluster similarities . A comparison
is deemed to be concordant (resp., discordant) if sij is strictly greater (resp., less) than . This index
is defined by:
, (5) where S+ (resp., S-) denotes the number of concordant (resp., discordant) comparisons. Result Analysis
Data presentation
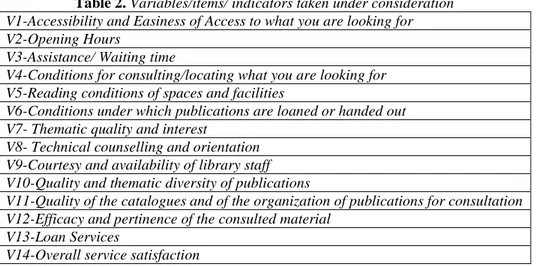
The enquiry which was elaborated included, among others, a set of questions about the evaluation of the degree of satisfaction with the different indicators or dimensions referring to the quality of on-the-spot reading services, which can be consulted in Table 2.
{
C
1,
C
2,
,
C
c}
( )
{
i
j
i
j
E
}
F
=
,
:
,
∈
12 1 ) ( # * ) ( )*# ( # + = F S R C STAT V 2 ) ( # R S C CV = B − ×G
(
PI
)
=
{
(
ij
,
k
)
∈
F
×
F
:
s
ij≥
s
k}
×(
)
∑
∑
∑ ∑
=−
≡
c ∈ ∈ r ijN
s
c
I
P
iCr jECr 1n
r*
n
r1
)
mod,
2
(
/ rn
ks
ks
(
+−
−) (
++
−)
≡
S
S
S
S
γ
43
Table 2. Variables/items/ indicators taken under consideration V1-Accessibility and Easiness of Access to what you are looking for V2-Opening Hours
V3-Assistance/ Waiting time
V4-Conditions for consulting/locating what you are looking for V5-Reading conditions of spaces and facilities
V6-Conditions under which publications are loaned or handed out V7- Thematic quality and interest
V8- Technical counselling and orientation V9-Courtesy and availability of library staff V10-Quality and thematic diversity of publications
V11-Quality of the catalogues and of the organization of publications for consultation V12-Efficacy and pertinence of the consulted material
V13-Loan Services
V14-Overall service satisfaction
The questionnaire used in the 2007 study contained a filter-question: “Have you ever visited or
been to any public library in your island or region?”, to which each of the 1684 respondents answered
(Yes or no). Thus, the final classical data matrix is a matrix (674x14) constituted by 674 individuals, who answered “yes” to the above mentioned filter question, and by 14 variables/items which aimed at assessing the level of satisfaction regarding the quality of on-the-spot reading services.
The 674 respondents, who had already visited a public library in their island or region, indicated verbally their degree of satisfaction with statements containing five Lickert-type possible positions
(1-Very unsatisfied, 2-Unsatisfied, 3-Neutral, 4-Satisfied, 5-(1-Very satisfied). The answering modalities are
distributed around a neutral or indifference axis, permitting, therefore, a precise determination of positional attitude regarding the evaluated service quality. This study also took into consideration the following nominal variables: “Island” (1- Santa Maria; 2- São Miguel; 3- Terceira; 4- Graciosa;
5-Faial; 6-Pico; 7-São Jorge; 8-Flores; 9-Corvo) and “Employment Status” (S1-"Employed on a permanent contract of employment); S2 -"Self-employed"; S3-"Non-paid family work"; S4-"Looking for the first job"; S5-"Retired"; S6 -"Student/Working student"; S7- "Employed on a fixed-term contract"; S8-"Freelancer or similar"; S9-"Unemployed"; S10-"Homemaker"; S11-"Disabled/Handicapped/Unable to work"; S12-"Others"). Two matrices of symbolic data were also
obtained from the above mentioned matrix (674 x 14). For this purpose some groups of individuals were created, according to the variables “Island in which the interview took place” and “Employment
status”. Each matrix contains fourteen columns and a number of lines determined by the number of
categories of the variables which were taken into consideration to form the groups. In Table 3, the notation Fi indicates the number of individuals included in category i of variable j, respectively with 1
≤ i≤ 9 and 1 ≤ i≤ 12, for the variables “Island“ and “Employment status”. The totals in this table are
different because the two variables contain a different number of missing values.
Table 3. Nominal Variables – Application to real data
Island Employment status
Categories Fi Categories Fi
Sta Maria 72 S1- Employed PC 259 S. Miguel 94 S2- Self-employed 49 Terceira 148 S3- Non-paid family work 6 Graciosa 82 S4- Looking for first job 5
Faial 48 S5- Retired 52 Pico 79 S6- Student/Working St. 133 S. Jorge 78 S7- Employed F-TC 103 Flores 27 S8- Freelancer 8 Corvo 46 S9- Unemployed 18 ---- ---- S10- Homemaker 31 ---- ---- S11- Disab./Hand./Unable 4 ---- ---- S12- Other 0 TOTAL 674 668
44
AHCA of the data units (Symbolic Data)
As mentioned in Section 2, two symbolic data matrices were created, according respectively to the island in which the interview took place and the respondents’ employment status.
Table 4. A part of the symbolic data matrix –Islands
V1 V2 … Sta Maria S (1.00) VS (0.04), N (0.13), S (0.74), U (0.08), VU (0.05) … S. Miguel VS (0.74), S (0.26) VS (0.54), N (0.06), S (0.35), U (0.04) … Terceira S (0.57), N (0.22), U (0.17), VU (0.04) VS (0.01), N (0.23), S (0.60), U (0.13), VU (0.03) … Graciosa S (0.79), N (0.18), U (0.02) VS (0.02), N (0.21), S (0.72), U (0.04), VU (0.01) … Faial S (1.00) VS (0.08, N (0.04),S(0.83), U(0.02), VU (0.02) … Pico N (0.71), U (0.27), VU (0.03) VS (0.03), N (0.51), S (0.34), U (0.08), VU (0.05) … S. jorge S (0.88), N (0.03), U (0.01), VU (0.08) N (0.14), S (0.74), U (0.06), VU (0.05) … Flores S (1.00) VS (0.07), N (0.04), S (0.74), U (0.15) … Corvo S (1.00) VS (0.04), N (0.11),S(0.76), U(0.04), VU (0.04) …
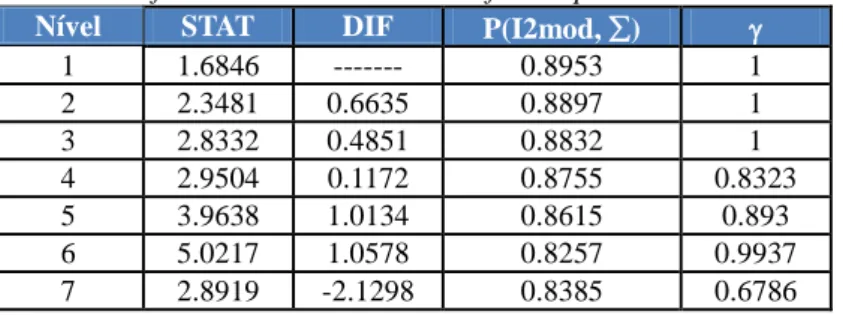
On what the Cluster analysis of the symbolic data units of Table 4 (islands) is concerned, and in accordance with the validation indexes used ([2]; [17]), the AV1 tree shows at its most significant level (level 6), a partition in three clusters. Thus, we obtained three differentiated satisfaction profiles according to the different indicators under analysis, as can be seen in Table 5 and in Figures 1 to 4.
Figure 1. Dendrogram obtained from the AV1 method
The first cluster is constituted by the islands of Santa Maria, São Jorge, Flores, Corvo,
Terceira, Graciosa and Faial, to which the individuals who are generally pleased with the on-the-spot
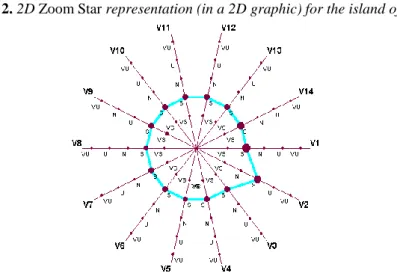
reading services belong. The Zoom Stars for all these islands were identical to those shown in Figure 2, that is, the most frequent answer provided by respondents in to these islands was "satisfied" for all fourteen variables. So, we present only the obtained one for the island of Faial.
Table 5. Values of some validation measures for the partitions – Islands - AV1
Nível STAT DIF P(I2mod, ∑) γ
1 1.6846 --- 0.8953 1 2 2.3481 0.6635 0.8897 1 3 2.8332 0.4851 0.8832 1 4 2.9504 0.1172 0.8755 0.8323 5 3.9638 1.0134 0.8615 0.893 6 5.0217 1.0578 0.8257 0.9937 7 2.8919 -2.1298 0.8385 0.6786 Santa Maria --*---* |---* São Jorge --*---* | |--* Flores --* | | |---* | Corvo --* |--* | | Terceira --*--* | | |---* | | Graciosa --*--* |---* |--* | | | Faial --*---* | | | | Pico --*---* | | São Miguel --*---*
45 In the 2D Zoom Star, axes are linked by a line that connects most frequent values of each variable, so allows us to identify the main characteristics of the symbolic objects. Although the star shapes of all 2D Zoom Stars of the islands of cluster 1 are the same, there are some differences at the level of frequency distributions. Indeed, the little differences between the frequency distributions of the first and second sub-cluster of cluster 1 could be observed from a 3D Zoom Stars featuring the distributions corresponding to each variable with weighted values. Much of what is considered satisfying depends on the structural conditions of resource and equipment distribution, which attributes to each of the nine islands a specific position concerning reading and other services. Thus, this set of islands, with similar satisfaction profiles, corresponds to situations occurring in island libraries (Central or Municipal) whose traditional functioning captivates the regular, loyal users.
Figure 2. 2D Zoom Star representation (in a 2D graphic) for the island of Faial
In the case of the islands Terceira and Faial, although they are equipped with central libraries and archives (RLAAH- Regional Library and Archive of Angra do Heroísmo and RLAF- Regional Library and Archive of Faial), at the time the study was conducted these were still functioning the same way, due to the unfit conditions of their facilities and equipments. There was, nevertheless, a project already underway for constructing new facilities for the Angra do Heroísmo Library, in the island of Terceira, and new facilities were ready to be inaugurated for the Library of Faial.
The second cluster is constituted by the island of Pico alone, where the most frequent answer given by the individuals of this island to the set of 14 variables was the neutral one (see Figure 3). This fact is probably due to the atypical or exceptional situation of the libraries in this island, at the time the data were collected on the field (2007). In fact, the three Municipal libraries of Pico were being remodelled at the time, in the context of a funding plan, the Funding Plan for Reconstructing and Remodelling Municipal Libraries, applicable to all of the national territory. The situation of indifference can perhaps be explained by the awaited expectations of service improvement after the transfer to new facilities.
46 The third and last cluster contains the island of São Miguel, the island where the degree of satisfaction was the highest (see Figure 4) on the variables regarding the quality of the available
materials/publications and the easiness of access to these materials (V1 to V6). At the time, the
Regional Library and Archive of Ponta Delgada (RLAPD) was, in the archipelago, a paradigmatic case of transition to a new concept of the social and cultural function which is nowadays attributed to libraries. In fact, in the light of the public reading services this process which included remodelling the central services and moving to other facilities in more accessible buildings made a way for a new concept of promoting this sort of community services and cultural activities, intended for users differentiated by their needs (children, teenagers, elderly, etc.). Nowadays, more than in the recent past, this sort of space is meant to support consultation and study for university students, but mostly for the students from the different schools on the island which holds 56% of the region´s population. We should also stress the fact that the main university campus is on this island and thus the public and the university libraries complement each other. The largest university campus, with the highest number of courses in the archipelago, is located in Ponta Delgada, in the island of São Miguel, and this has obvious implications for the materials and the subject areas encompassed by these libraries.
Figure 4. 2D Zoom Star representation (in a 2D graphic) for the island of São Miguel
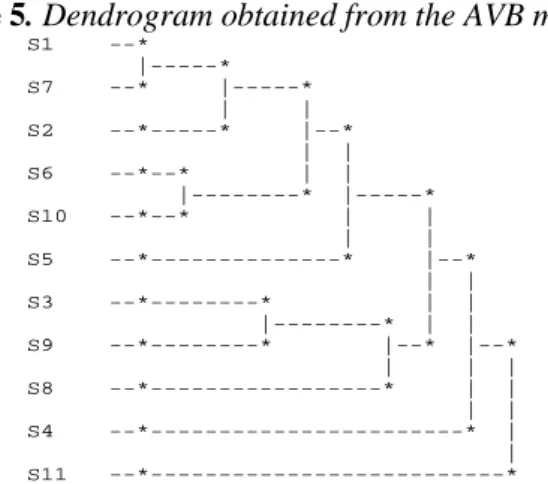
In relation to AHCA of the 11 symbolic objects obtained from the variable "Employment Status", the values of the STAT and γ of Goodman and Kruskal indexes, which can be seen in Table 6, allow us to conclude that the AV1 and AVB trees originated, at their most significant level (level6), a partition in five clusters (see Figure 5).
The first cluster contains the employment status of S1-"Employed on a permanent contract of
employment; S7- "Employed on a fixed-term contract"; S2 -"Self-employed"; S6-"Student/Working student"; S10-"Homemaker" and S5-"Retired", which encompasses the individuals who are in a paid
working situation, the students and those who enjoy a greater amount of free time. In fact, the individuals from this group correspond to a similar profile of satisfaction with on-the-spot reading services.
Figure 5. Dendrogram obtained from the AVB method
S1 --* |---* S7 --* |---* | | S2 --*---* |--* | | S6 --*--* | | |---* |---* S10 --*--* | | | | S5 --*---* |--* | | S3 --*---* | | |---* | | S9 --*---* |--* |--* | | | S8 --*---* | | | | S4 --*---* | | S11 --*---*
47 The second cluster contains the working status S3-"Non-paid family work" and S9-"Unemployed", therefore relating to individuals who have no income. Each of the remaining three clusters corresponds to relatively atypical situations. It is therefore not strange that they can be found in the most significant partition, in clusters which contain a single symbolic data unit (symbolic object) and that the individuals included are but a small number of the studied sample, as can be seen in Table 3.
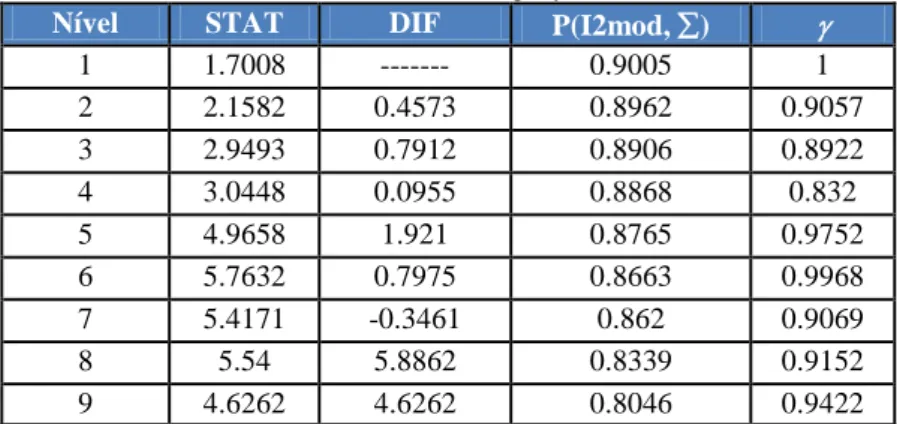
Table 6. Validation indexes – Employment status - AVB
Nível STAT DIF P(I2mod, ∑) γ
1 1.7008 --- 0.9005 1 2 2.1582 0.4573 0.8962 0.9057 3 2.9493 0.7912 0.8906 0.8922 4 3.0448 0.0955 0.8868 0.832 5 4.9658 1.921 0.8765 0.9752 6 5.7632 0.7975 0.8663 0.9968 7 5.4171 -0.3461 0.862 0.9069 8 5.54 5.8862 0.8339 0.9152 9 4.6262 4.6262 0.8046 0.9422
The third cluster includes the group of individuals who are freelancers or similar (symbolic object
S8) and their profile is grounded, for the most part, on a situation of greater satisfaction, due to the
adequacy of the materials to their regular and very specific consultation needs, done for working purposes, such as consulting of governmental decrees, official diplomas and manuals made available by the library to the general public. The fourth cluster includes the group of individuals who are
S4-"Looking for the first job"(symbolic object S4). Finally, the fifth cluster, the one which most stands
out from the remaining ones, includes the individuals who are S11-"Disabled/Handicapped/Unable to
work"(symbolic object S11).
Worthy of notice is also the fact that, as can be seen in Table 6, the levels to which the maximum on-the-spot DIF values correspond are respectively levels 3, 5 and 8, which, according to Bacelar-Nicolau [6], indicates that it was on those levels that the formations of the most important, most internally coherent and best differentiated sub-clusters occurred. For this reason and for sociological interpretation purposes, we must mention, on level 3, the formation of cluster {S1, S7, S2}, which corresponds to workers who belong to a paid employment status, as can be seen in the dendrogram of Figure 5.
Conclusion
At a time when the use of increasingly complex databases has become the norm it is crucial to develop statistical methods which allow us to extract useful knowledge from these data while, when justifiable, making it possible to maintain their confidentiality. An advantage of the weighted generalised affinity coefficient in the field of Symbolic Data Analysis is the fact that it can be applied to different types of data. In this case, different proximity matrices are obtained for each sort of data, with a convex linear combination of these initial matrices being afterwards determined (Bacelar-Nicolau, 2000). We then obtain a single global proximity matrix based on a single measure of comparison between elements, to which different aggregation criteria, including the ones from VL methodology, can be applied.
In this paper we tried to show how the affinity coefficient can be applied in Hierarchical Cluster Analysis of units of symbolic data (symbolic objects), described by symbolic modal variables, keeping in mind the growing importance of this sort of variables. We also tried to show how some classical validation indexes can be extended to the case of symbolic data, since the validation of results is an essential step in Cluster Analysis. Finally, clusters referring to the selected partitions were constantly submitted to careful interpretation, as a way of obtaining useful knowledge on the context the data belong to, for, no matter how developed computers become, the correct analysis of data will always depend on human intervention.
48
References:
[1] H.-H. Bock and E. Diday, (Eds.), “Analysis of Symbolic Data: Exploratory Methods for Extracting Statistical Information from Complex Data”, Series: Studies in Classification, Data Analysis, and Knowledge Organization. Berlin: Springer-Verlag, 2000.
[2] A. Sousa, Contribuições à Metodologia VL e Índices de Validação para Dados de Natureza Complexa. Tese de Doutoramento, Universidade dos Açores, Ponta Delgada, 2005.
[3] V. Stéphan (1996). Extracting Symbolic Objects from Relational Databases. IEEE, pp. 514-519, Available: http://ieeexplore.ieee.org/stamp/stamp.jsp?arnumber=00558606&tag=1.
[4] E. Diday, “From Data to Knowledge: Probabilistic Objects for a Symbolic Data Analysis”, in
DIMACS Series in Discrete Mathematics and Theoretical Computer Science, 19, 1995.
[5] K. Matusita, “On the Theory of Statistical Decision Functions”, Ann. Instit. Stat. Math., vol.III, pp.1-30, 1951.
[6] H. Bacelar-Nicolau, “Contribuições ao Estudo dos Coeficientes de Comparação em Análise
Classificatória”. Tese de Doutoramento, FCL, Universidade de Lisboa, 1980.
[7] H. Bacelar-Nicolau, “Two Probabilistic Models for Classification of Variables in Frequency
Tables”, in: H. H. Bock (ed.), IFCS-87, 1988, pp. 181-186.
[8] H. Bacelar-Nicolau, “The Affinity Coefficient for Complex Data”, in: Analysis of Symbolic Data: Exploratory Methods for Extracting Statistical Information from Complex Data, H. H. Bock and E. Diday, Ed. Berlin: Springer-Verlag, 2000, pp.160-165.
[9] H. Bacelar-Nicolau, “On the Generalised Affinity Coefficient for Complex Data”, Biocybernetics and Biomedical Engineering, vol. 22 (1), pp. 31-42, 2002.
[10] H. Bacelar-Nicolau, H.; F. Nicolau; A. Sousa.; L. Bacelar-Nicolau, “Measuring similarity of complex and heterogeneous data in clustering of large data sets”, Biocybernetics and Biomedical
Engineering, vol. 29 (2), pp. 9-18, 2009.
[11] E. Diday, “The Symbolic Approach in Clustering and Related Methods of Data Analysis: The
Basic Choices”, in: H. H. Bock (ed.) IFCS-87, 1988, pp. 673-684.
[12] K. C. Gowda and E. Diday, “Symbolic Clustering Using a New Dissimilarity Measure”, Pattern
Recognition, vol. 24 (6), pp. 567-578, 1991.
[13] K. C. Gowda and E. Diday, “Symbolic Clustering Using a New Similarity Measure”, IEEE
Transactions on Systems, Man and Cybernetics, vol. 22 (2), pp. 368-378, 1992.
[14] A. D. Gordon, Classification, 2nd ed.. London: Chapman & Hall, 1999.
[15] F. Nicolau and H. Bacelar-Nicolau, “Clustering Symbolic Objects Associated to Frequency or
Probability Laws by the Weighted Affinity Coefficient”, in H. Bacelar-Nicolau, F. C. Nicolau and
Jacques Janssen, Ed., ASMDA-99, 1999, pp. 155-158.
[16] F. Nicolau and H. Bacelar-Nicolau, “Some Trends in the Classification of Variables”, in C. Hayashi, N. Ohsumi, K. Yajima, Y. Tanaka, H. H. Bock and Y. Baba, Ed., IFCS-96, 1998, pp. 89-98. [17] A. Sousa; H. Bacelar-Nicolau; F. Nicolau, “A metodologia VL e Validação em Análise Classificatória de Dados de Natureza Complexa: Uma Aplicação a Dados Reais”, in Ferrão, M. et al., Ed., SPE-2006, 2007, pp. 775-788.