Page | 1
A Work Project presented as part of the requirements for the Award of a Master’s Degree in
Management from the NOVA – School of Business and Economics
Return on Assets in the Tobacco Industry
Analysis of the Four Main Tobacco Manufacturers
Martim Mineiro Moreira, nº2293
A Project carried out on the Financial Statement Analysis course, under the supervision of:
Professor Leonor Ferreira
Page | 2 Title: Return on Assets in the Tobacco Industry: Analysis of the Four Main Tobacco Manufacturers
Abstract
This paper studies operating profitability drivers in the Four Main Tobacco Manufacturers for the period 2004-2014. The operating profitability is analyzed as return on assets (ROA) based on the DuPont Extended Model breakdown in degree of operational risk, gross sales margin and assets turnover. The sources of ROA are market share and price strategies appraised through the drivers: firm-size, global value and strategic choices. Using consolidated data, results suggest that firm-size and global value holds a positive relationship with ROA. Also innovation through less harmful tobacco products can lead to better ROA despite no correlation between R&D and ROA.
Key Words: Return on assets (ROA), tobacco industry, Four Main Tobacco Manufacturers, R&D.
1. Introduction
The tobacco industry is an oligopoly1 where five companies dominate. The market is shared between those same firms, and it is highly concentrated with five main players: China National Tobacco Company (CNTC)2, Philip Morris International (PMI), British American Tobacco (BAT), Japan Tobacco International (JTI) and Imperial Tobacco (IT). The major tobacco manufacturers, excluding CNTC, are designated the Four Main Tobacco Manufacturers. The estimated value of the global tobacco market is 816 billion USD3 producing 5.8 trillion cigarettes a year (Eriksen et al., 2015) and with an expected annual growth rate4 of 4.3 percent (Euromonitor, 2015). Currently, the overall global market (retail value) is still growing driven by population growth and increase
1 Large number of consumers and small number of manufacturers.
2 CNTC is not analyzed in this research due to the lack of official financial information. 3 Retail value per capita equals to 113.2 USD for the year 2014.
Page | 3
of disposable income in emerging countries (WHO5, 2015). Most of the world’s smokers live in
low and middle-income countries and the tobacco industry is increasingly targeting these emerging markets (Jha et al., 2009). China is currently the largest tobacco market with more than 350 million smokers, who represent around 44 percent of the global market holding a market size of 231 billion USD (Euromonitor, 2015). According to Euromonitor in 2015, “between 2000 and 2014, global
cigarette volume sales increased by 8% while retail values increased 121%”6. Industry analysts predict that over the next five years the global cigarette industry will continue to grow; volumes are predicted to increase by 0.9% and values by 22%”. Notwithstanding, tobacco sales volume is
decreasing in developed countries every year due to the increase in regulation and taxation. As a result, in these countries, an individual smoker will consume fewer traditional cigarettes in the future or will switch to less harmful alternatives7. The state-owned CNTC controls almost
exclusively the Chinese tobacco market. While outside China four international tobacco companies compete – PMI, BAT, JTI and IT, which control around 40 percent of the global market place8. The Four Main Tobacco Manufacturers operate in a very competitive marketplace with extremely high rivalry and present profits despite increasingly tighter regulation (e.g. high taxation enforcement). Therefore, exists motivation to understand the drivers of operating profitability among the Four Main Tobacco Manufacturers through the analysis of ROA and respective
5 World Health Organization.
6 See appendix 9.2: Global cigarette market: Historic retail volume and value (2000-2014).
7 The major tobacco manufacturers have already launched alternatives to traditional cigarettes such as, e-cigarettes or the newly launched PMI reduced risk innovation called heat-not-burn technology.
Page | 4
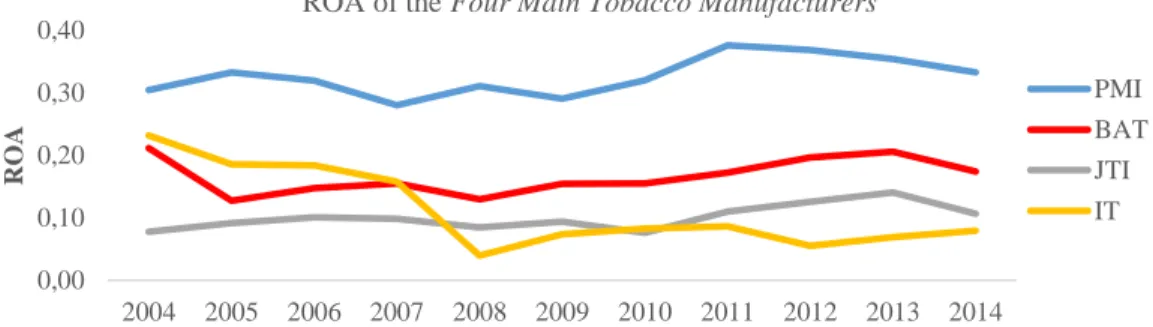
components: DOL, GSM and AT. Figure 1 shows the ROA evolution across time (2004-2014) for the Main Four Tobacco Manufacturers9.
The observation of figure 1 provides the knowledge of a wide ROA deviation between the Four
Main Tobacco Manufacturers. Hence, it is of the utmost importance to study these deviations
through the ROA components which are influenced by the drivers: firm-size, global value10 and strategic choices. In this sense, Financial Statement Analysis (FSA) and specially the DuPont Extended Model is cornerstone in this Work Project to review and analyze the Four Main Tobacco
Manufacturers financial statements in order to present the appropriate conclusions. Financial
statements used in this research are the income statement and balance sheet as part of annual reporting. Insights about operating risk – operating leverage (1/DOL), margin – gross sales margin (GSM), and efficiency – assets turnover (AT) are withdrawn based on the Four Main Tobacco
Manufacturers published financial reports, alongside with a set of assumptions about financial
investments. Moreover, the relevance of this research is founded on two pillars: industry own specificities and lack of academic papers regarding the study of ROA in the tobacco industry. This research proceeds as follows. Section 2 reviews the literature of financial ratios’ and tobacco industry. Section 3 highlights the tobacco industry context. Section 4 describes the methodology:
9 The Four Main Tobacco Manufacturers include: PMI, BAT, JTI and IT. Due to lack of financial public information regarding CNTC the major tobacco manufacturer.
10 Measured by the firms’ market share position in each region of the world. 0,00 0,10 0,20 0,30 0,40 2004 2005 2006 2007 2008 2009 2010 2011 2012 2013 2014 RO A
ROA of the Four Main Tobacco Manufacturers
PMI BAT JTI IT
Page | 5
purpose, research questions, sample selection criteria, internal and external validity, strategy chosen and financial analysis framework. Section 5 discusses the results and in the final section conclusions are presented.
2. Literature Review
Previous research relevant to this Work Project addresses mainly issues related to ratio analysis, tobacco industry particularities (e.g. regulation and taxation) and industry innovation. Past research related to ratio analysis include, among others: Return on Assets Rationale (Herciu et al., 2010);
Using Assets Turnover and Profit Margin to Forecast Changes in Profitability (Fairfield et al.,
2001); Drivers of profitability changes using DuPont Method (Bernstein and Wild, 2000; Revsine and Johnson, 1999; Stickney and Brown, 1998); Impact of technological innovations in
profitability through differentiation (Porter, 1980; Ittner, 1997). Past research concerning tobacco
industry particularities include: The effect of tobacco advertising bans on tobacco consumption (Saffer and Chaloupka, 2000); Using law to improve public health: the example of tobacco
regulation (Dachille, 2012); Understanding Philip Morris’s pursuit of US government regulation of tobacco (McDaniel, 2005).
Return on assets presents a different take on management effectiveness and reveals how much profit a company earns for every monetary unit of its assets. Only a few professional managers will consider stocks with a ROA of less than 5% (Herciu et al., 2010). This criterion of valuation is relevant in this study in order to assess the profitability of the Four Main Tobacco
Manufacturers. The classic text-book by Stickney and Brown (1999) identify as the first learning
objective in a chapter titled “Introduction to Profitability and Risk” that it should be analyze and interpret changes in the operating profitability of a firm using the rate of return on assets and its components: profit margin and assets turnover. Regarding the ROA components, a relevant study
Page | 6
by Fairfield and Yohn (2001) highlighted that the level of assets turnover reflects the firm’s assets utilization, and the profit margin, reflects the firm’s operating efficiency, both are in part products of the firm’s strategy, according to same research. Thus, changes in the firm’s current profitability can be traced to changes in its assets turnover and profit margin. A change in assets turnover reflects a change in the productivity of the firm’s assets and should, therefore, be useful to forecast future profitability. Moreover, Bernstein and Wild (1998) suggest to disaggregate return on assets into assets turnover and profit margin because these components are useful in the analysis of company performance. The assets turnover and profit margin added to the operational risk form the DuPont Extended Model. This management tool owns its origin to the E.I DuPont de Nemours Company in the early twentieth century. This later model assists, even more, in the comprehension of ROA differences between industries and within industries. According to Selling and Stickney (1989) the DuPont analysis shows the profit analysis and, thus its values differ across industries. Even within one industry there are different strategies to improve profitability. Several authors stated that product differentiation firms will enjoy higher gross profits than low cost providers (Ittner, 1997; Porter, 1980)11. This theory is helpful in order to appraise the influence of strategic choices on ROA in the Four Main Tobacco Manufacturers as a proxy for innovation impact.
Past research about tobacco regulation shows that some constraints are not very successful and should not be implemented. All the regulatory constraints should contain a study of impact to analyze the reduction in consumption and its reliability. The Saffer and Chaloupka (2000) study suggested that a comprehensive set of tobacco advertising bans reduce tobacco consumption but a limited set of advertising bans can also have little or no effect. Evidence shows that advertising bans will not reduce the total level of advertising expenditure but will simply result in substitution
11 This theory has been used in several studies of product differentiation strategy (Ittner, 1997). The objective is to determine whether low cost providers or differentiators have been more successful in adopting technology.
Page | 7
to the remaining non-banned media or ways of communication. Nevertheless, consensus about the necessity of tobacco regulation is universally and supported through governmental and non-governmental organizations. According to Dachille (2012) development of modern discipline of public health law coincided with the growing need to address tobacco use with more than the traditional tools of public health professionals. Public health issues cannot be all addressed through taxation yet there are products that contribute significantly to public health problems which could be subject to tax schemes designed to increase price, decrease consumption and fund relevant public health programs. Moreover, according to McDaniel and Malone (2005) tobacco manufacturers support governmental regulation of tobacco in an attempt to reverse its negative public image, affecting firms’ stock price, political influence and employee morale. Through regulation, tobacco companies seek to redefine themselves as socially responsible and influence the litigation environment. This strategy allows them to portray a reasonable and responsible image as manufacturers of risky products. Finally, no past research was found regarding operational profitability, return on assets and its components, or even ratio analysis in the tobacco industry. In this sense, reinforcing the necessity of this Work Project.
3. Tobacco Industry Context
The tobacco industry owns special characteristics which shape and influence the way companies in this business operate around the world19. Among them is the tobacco taxation which contributes to the increase of price and then demand reduction (US Dep. Of Health, 2012). Meantime, the Four
Main Tobacco Manufacturers are still able to increase their respective net revenues21 despite the decrease in consumption because the increased proportion in taxation is equally replicated in prices
19 See appendix 9.4: Tobacco Industry SWOT Analysis, appendix 9.5: Tobacco Industry Value Chain Analysis and appendix 9.6: Tobacco Industry Five Porter Forces.
Page | 8
maintaining in this way their respective margins22 over a higher price. According to the World
Health Organization (WHO), “On average, a 10% price increase on a pack of cigarettes would be
expected to reduce demand for cigarettes by about 4% in high-income countries and by about 5% in low and middle-income countries, where lower incomes tend to make people more sensitive to price changes” (WHO, 2015). In describing the tobacco industry is cornerstone to explain the
elements concerning regulation. Tobacco products are the most highly taxed consumer goods around the world with taxes usually exceeding more than half of the retail price and, thus tobacco taxation can contribute to support the public health expenses related with tobacco consumption and foster the public health objectives by reducing tobacco usage (WHO, 2015). Hence, governments should strike to create an optimal equilibrium between keeping taxes at levels which allow them to achieve their public health objectives and at the same time not making tobacco products unaffordable to adult smokers24. Usually, governments enforce excise tax on tobacco products, which is a selective consumption tax. The tobacco excise tax is the largest contributor to the cigarette price formulation28. It can be enforced as a specific tax, which is collected based on quantity29 or levied as an ad valorem tax, which is calculated based on value30. The European Union adopts a mixed tax system, as tobacco tax combines a mix between specific and an ad
valorem component32. Thus, cigarette price levels in each country can vary depending on domestic specific tax structure33. However, under the same specific tax scheme all cigarettes in a country pay the same tax amount.
22 In maintaining the gross margins with the increase of prices manufacturers are able to generate higher earnings share.
24 As the International Monetary Fund has stated, “Ultimately, tobacco excise tax rates must reflect the purchasing power of the local consumers, rates in neighboring countries, and, above all, the ability and willingness of the tax authority to enforce compliance” (World Bank, 1999).
28 See appendix 9.8: Percentage of Tax Applied to Cigarettes – OECD Average. 29 e.g., a fixed amount per cigarette or weight of tobacco.
30 e.g., a percentage of the factory price or retail price.
32 Outside the EU other countries use mixed tax systems such as, Switzerland, Russia, Ukraine, and Mexico. 33 See appendix 9.9: Summary of tobacco tax schemes characteristics (WHO, 2015).
Page | 9
The majority of the tobacco regulation currently being implemented around the world is formulated by the WHO through the Framework Convention on Tobacco Control Protocol (FCTC), which is the first international public health treaty34. The FCTC’s goals are divided into measures to reduce the demand for tobacco products and measures to reduce the supply of tobacco products. The purpose is to reduce initiation of tobacco use and encourage cessation. The regulation elements can involve advertising and marketing constrains such as, point of sale display ban and plain packaging. Also constraints from another nature can be found in the tobacco market place, for instance, regulation of public place smoking and health warning labels. The vast majority of countries worldwide already have implemented partial or total bans on tobacco advertising, marketing and promotion35. However, where advertisement is allowed, health warnings are mandatory. These constraints are not exclusive to the EU or “developed countries”, they are also commonplace throughout the world36. Nowadays, governments are gradually prohibiting smoking in public places. In most countries, regulations which restrict or ban public smoking are commonplace37. In a complementary manner health warning labels are also very common in the tobacco marketplace and the majority of the countries already demand health warning on the front and back of cigarette packs38. The point of sale display allows retailers to show costumers the
products which are available for purchase as well as to demonstrate new products to consumers when they are introduced into the market. However, public health advocates as the WHO have already demanded the ban of this kind of promotion at any retail location. According to Health Canada (2006) point of sale display ban effects on public health “remains very speculative”, their
34 FCTC was adopted by the World Health Assembly in May 2003 and entered into force in February 2005. Over 170 countries plus the European Union are parties to the Treaty.
35 In these countries is also prohibited advertising on billboards and print media (e.g. newspapers and magazines).
36 Countries such as, Algeria, Brazil, Chile, Egypt, Gambia, Kazakhstan, Malaysia, Mexico, Peru, Singapore, Thailand, Turkey and Ukraine have already adopted health warnings.
37 Such as shopping centers, movie theaters, government office buildings, public transportations and in some countries the hospitality sector is also regulated (e.g. restaurants, bars and nightclubs).
Page | 10
effectiveness in reducing youth smoking or overall smoking has not been scientifically proved. Additionally, plain packaging39 consists of banning trademarks on tobacco packaging requiring all tobacco products to be sold in virtually identical packaging and, thus presenting another kind of regulation which can cause major constraints to the Four Main Tobacco Manufacturers. This constraint can create some setbacks, for instance, counterfeit products could become easier to produce fostering illicit trade and brands would lose their value creating a market without price levels, where the cheapest is the better alternative.
Despite the enforcement of aggressive regulation constraints the Four Main Tobacco
Manufacturers are still profitable. In pursue of this objective they have to consider strategic
choices, as investments in R&D, which can result in product diversification40 (a proxy for innovation) and, thus probably higher gross profits. Meanwhile, the Four Main Tobacco
Manufacturers are investing heavier in R&D to overcome consumption decrease and consequently
loss of sales volume caused by increasing regulation. In 2014, R&D total investment41 from PMI, BAT and JTI was around 902 million USD. These tobacco manufacturers are investing specially in less harmful tobacco products called reduced risk products42. In this sense, an increasing number of public health specialists agree that reduced risk products can benefit public health. In order for this objective to materialize two conditions should be met. First, products need to present less risk than traditional cigarettes. Second, adult smokers need to find these products acceptable and voluntarily wish to switch to them. Currently, three43 of the Four Main Tobacco Manufacturers
are allocating significant resources to the development and scientific assessment of less harmful
39 See appendix 9.10: Plain packaging examples.
40 Can include upgrades of existing products or the creation of new tobacco categories (e.g. e-cigarettes or heat-not-burn technology).
41 From three main tobacco manufacturers: PMI, BAT and JTI. IT does not invest in R&D. 42 Term commonly used by PMI to describe their less harmful tobacco products platform. 43 IT is not allocating resources to R&D.
Page | 11
tobacco alternatives to traditional cigarettes because they have the potential to reduce the risk of smoking-related diseases. Therefore, giving smokers access to less harmful alternatives can be a major benefit to public health. In this way, regulatory measures could be eventually reduced allowing tobacco manufactures to advertise and promote tobacco products more freely. Additionally, if in fact reduced risk products are able to benefit public health a new tax scheme could be created or an existing one could be minimized enabling tobacco manufacturers to increase gross sales margins leading probably to an increase of operating profitability.
Ultimately, despite the taxation and regulation aspects tobacco consumers worldwide are increasingly looking for and expecting real value, meaning that quality and innovation will both play a crucial role in delivering market share and consequently market leadership.
4. Methodology
The purpose of this Work Project is to study the drivers behind the disparities in the return on assets (ROA) among the Four Main Tobacco Manufacturers.
4.1. Research Questions (RQ)
The following RQ are divided in three parts. The first part analysis the operating profitability breakdown among the Four Main Tobacco Manufacturers. The second part shows the impact of firm-size and global value in the ROA. The third part studies the relationship between strategic choices and profitability. The RQ of the first part are the following:
RQ.1 – How does ROA components differ?
The second part highlights the main drivers which influence the ROA components:
RQ.2 - Why firm-size relates to ROA?
Page | 12
The third part addresses the role of strategy in the ROA:
RQ.4 - Why innovations influence ROA?
RQ.5 - How does R&D expenses relates to ROA?
The Work Project analyzes which DuPont Extend Model components hold more influence in the ROA (RQ.1). The components are influenced by the drivers: firm-size (RQ.2), global value (RQ.3) and strategic choices (RQ.4&5). The investing decision (ROA) is breakdown based on the DuPont Extend Model exploring in detail the operating risk, return on sales and assets turnover (RQ.1). The operating risk is addressed through the degree of operating leverage. The return on sales is explored based on the profitability measure of gross sales margin and lastly the assets turnover covers efficiency of the firm. The firm-size is analyzed through the variables: assets value, net revenues, number of employees and market share (RQ.2). The global value is measured by the firms’ market share position in each region of the world (RQ.3). Ultimately, the innovation (RQ.4) and R&D (RQ.5) are assessed by the impact on taxes and correlation to ROA, respectively, forming the strategic choices.
4.2. Data Source and Sample Selection
As mentioned, in the tobacco industry there are few multinational companies with a relevant position in the market as well as local companies which are important at a regional level. The scope of this research is limited to the multinational branded tobacco manufacturers, where five companies dominate44. In this study only the Four Main Tobacco Manufacturers are considered,
which are Philip Morris International (PMI), British American Tobacco (BAT), Japan Tobacco International (JTI) and Imperial Tobacco (IT). The assessment criterion is based on the firm-size
Page | 13 Table 1: Summary of firm-size variable values for the Main Four Tobacco Manufacturers in 2014.
variables: assets value, sales revenues, number of employees and market share. Although CNTC clearly leads in all four variables45 there is no public financial information available from official entities or independent auditors. Hence, the research only focus on Four Main Tobacco
Manufacturers with financial information available ranking below CNTC. Table 146 shows the firm-size values among the Four Main Tobacco Manufacturers ranked by market share:
Firms47 Total Assets
(in millions of USD)
Net Revenue
(in millions of USD)
Nr. of Employees (in thousands) Market Share (percent) PMI 35.187 80.106 82.500 14.3 BAT 39.547 64.245 57.100 11.6 JTI 38.231 17.523 26.200 9.4 IT 39.389 40.208 35.000 4.9
In order to properly assess the data to conduct this research primary and secondary sources are collected. The primary sources are based on the consolidated public financial reports48 of the Four
Main Tobacco Manufacturers: PMI, BAT, JTI and IT for the year 2004 to 2014. The secondary
sources, gathered to interpret, assign value and draw conclusions about primary sources are based on published work from relevant stakeholders in the tobacco industry in the form of academic papers and industry related books. In the Yin methodology is suggested that using multiple sources49 of evidence is the way to ensure solid validity (Yin, 1994). The current study uses official financial reports from the Four Main Tobacco Manufacturers, published work in the form of academic papers and articles from regulators50. According to Yin (1994), all research considerations must be orientated to construct validity: internal validity, external validity, and
45 Market share of 44 percent, 500.000 thousand employees and estimated net revenues of 170 billion USD.
46 Firm-size values from published financial annual reports [database available in firms’ web archives] and market share from Euromonitor International (2015).
47 The Four Main Tobacco Manufacturers.
48 Available in the Four Main Tobacco Manufacturers web archives.
49 The research excludes the following sources: direct observation, participant observation and physical artifacts. Since they are related to direct sociological studies and are not related to the research subject.
Page | 14
reliability. In this research, specification of the unit of analysis provides the internal validity as theories are developed and analysis test those theories. The external validity is achieved from theoretical relationships developed through the research. In resume, this research applies the main principles of data collection which are multiple sources of data, formulation of a database and chain of evidence. Yin suggests that every investigation should have a general analytic strategy, so as to guide the decision regarding what will be analyzed and for what reason. In this research, the strategy is to analyze the drivers: firm-size, global value and strategic choices (as a proxy for R&D), in order to justify the disparities in the ROA components among the Main Four Tobacco
Manufacturers. Presenting some possible analytic techniques51: pattern-matching, explanation-building, and time-series analysis. In general, those techniques are applied based on the theoretical propositions which rely on a descriptive framework around which the study is organized.
4.3. Analysis framework: Return on assets and its breakdown
There are several ways to calculate the ROA ratio in the FSA spectrum. The most commonly used is the following:
The return on assets (ROA) is a financial ratio which shows the percentage of profit a company earns in relation to its overall resources (Albrecht et al., 2005). It is commonly defined as EBIT52
divided by total assets (Bernstein and Wild, 2000). The assets are withdrawn from the balance sheet and include cash and cash-equivalent items53 (Baker and Powel, 2015). The ROA ratio varies substantially and is highly sensitive within industries. The evolution of ROA across time emphasizes the return on management’s investing decisions and attributes the firms’ economic
51 "Data analysis consists of examining, categorizing, tabulating, or otherwise recombining the evidence to address the initial propositions of a study" (Yin, 1994).
52 Earnings Before Interests and Taxes. EBIT is a proxy for the income from operating activities.
53 Receivables, inventories, land, capital equipment as depreciated and the value of intellectual property (e.g. patents).
Page | 15
health enabling an evaluation of decision makers. The DuPont Model in its extended version was chosen to identifying and understanding which variables are influential to the ROA outcome in the
Four Main Tobacco Manufacturers. According to this model the ROA ratio in [1] can be broken down into three meaningful ratios, as follows:
When using ROA as a comparative measure, the best approach is to compare it against the company previous ROA or the ROA of a similar54 company.
The degree of operating leverage (DOL) measures firms’ operating risk55. The higher the
degree of operating leverage the more volatile the EBIT figure is relative to a given change in sales,
ceteris paribus56. Operating leverage gives insights into the use of fixed and variable costs in the
firms’ operations. Firms with lower DOL ratios usually present higher levels of operating fixed costs contributing to lower levels of profitability. Additionally, the DOL enables firms to understand the effects that a given level of operating leverage holds on potential earnings, helping firms’ determine the most appropriate level of operating leverage in order to maximize57 earnings.
The gross sales margin (GSM) represents the company's total sales revenue minus its cost of goods sold divided by the total sales revenue. It is the percentage of total sales revenue which a company retains after deducting all variable costs associated with production of the goods and services sold (or rendered). The higher the percentage, the more the company retains on each sale58.
Moreover, higher GSM usually is a direct consequence of production efficiency using fewer or cheaper raw materials and, thus better purchasing decision for a similar amount of goods sold.
54 Same industry with close level of assets, net revenue, net income, number of employees and accounting standards. 55 Which is how much (in percent) the operating result (EBIT) changes if sales change (one percent).
56 With all the other variables remaining the same (constant).
57 Provides the firm with a useful tool to handle decision such as, the choice between outsourcing versus in-housing functions and deciding the mix between labor and capital investments.
58 If the firm gross margin is 45 percent it means that it’s retaining 0.45 from each monetary unit of sales generated.
Page | 16
Additionally, higher levels of GSM lead to high levels of profitability59, ceteris paribus. Firms are
able to charge higher prices and simultaneously incur in lower costs when purchasing bydecreasing the bargain power of customers and suppliers.
The assets turnover ratio is an indicator of the firm efficiency in deploying its assets. In other words, this ratio shows how efficiently a company is when using its assets to generate sales60.
The higher the assets turnover the more revenues per unit of assets the firm is generating. Firms presenting greater AT show higher profitability levels, ceteris paribus. However, this ratio widely varies among industries and, thus the analysis is only meaningful among firms which operate in the same sector. Some industries use assets more efficiently than others. In this research the framework is applied to the Four Main Tobacco Manufacturers with the objective of analyzing the main drivers behind the ROA.
5. Results
This section begins with ROA analysis and its breakdown in the Four Main Tobacco
Manufacturers (5.1). Followed by the study of ROA drivers: firm-size (5.2), global value (5.2) and
strategic choices (5.3), through the analysis of profitability sources: market share and price strategy.
59 Hence, "Margin on sales represents a key factor behind many of the most fundamental business considerations, including budgets and forecasts" (Paul W. Farris, 2010).
60 And, thus the ratio calculates the net sales as a percentage of assets (e.g. a result of 45 percent means that for each monetary unit of assets the firm generates 0.45 of sales).
Page | 17 5.1. ROA breakdown in the Four Main Tobacco Manufacturers (RQ.1)
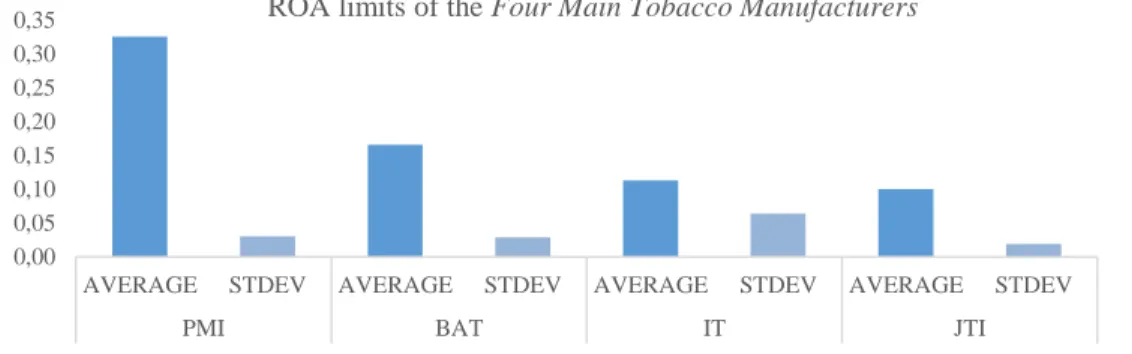
Assets profitability differs considerably between the Four Main Tobacco Manufacturers, as shown in figure 261. Hence, a detailed analysis of ROA components may explain why this happens, namely operating risk (DOL), sales profitability (GSM) and assets efficiency (AT).
Beginning with the degree of operating leverage62 (DOL) the main challenge in order to increase the DOL is to lower the fixed-to-variable cost levels. In lowering fixed costs (FC) efficiency can increase. Among the Four Main Tobacco Manufacturers, PMI shows the highest proportion63 of earning to sales margin (0.63) followed by IT which shows a 0.43 average DOL. Regarding operating leverage, JTI and BAT present the worst performances, with 0.34 and 0.31 of DOL, respectively. The DOL deviation in the Four Main Tobacco Manufacturers is considered low across the time period studied (2004-2014). Nonetheless, DOL64 is highly volatile in IT which contrasts with the other three tobacco manufacturers in the same period. Meanwhile, the Four Main
Tobacco Manufacturers are investing in the centralization of several activities – such as Marketing
or Finance – in one or few corporate centers, sometimes called clusters65. Likewise, they are
61 See appendix 9.11: Operating profitability in the Four Main Tobacco Manufacturers. 62 The DOL ratio expresses the relation between earnings and sales margin.
63 PMI earnings are considerable higher than competitors yet the sales margin does not follow in the same increase proportion. Thus having a higher EBIT proportion to sales margin due to a higher ability to generate EBIT results.
64 See appendix 9.12: Degree of operating leverage in the Four Main Tobacco Manufacturers. 65 e.g. Portugal and Spain are part of the Iberia cluster in PMI.
Figure 2: Operating profitability measurements from the Four Main Tobacco Manufacturers for the years 2004 to 2014. 0,00 0,05 0,10 0,15 0,20 0,25 0,30 0,35
AVERAGE STDEV AVERAGE STDEV AVERAGE STDEV AVERAGE STDEV
PMI BAT IT JTI
Page | 18
outsourcing their non-core-activities, such as technological support or recruitment. These decisions intend to reduce fixed costs and, thus decrease the operating risk, and increase ROA. DOL shows
medium influence in ROA disparities among the Four Main Tobacco Manufacturers.
The gross sales margin (GSM) is most influenced by two major variables: efficiency on managing variable costs and pricing. In the tobacco industry the excise tax and price changes are related, so that any increase in the tobacco tax burden implies equal repercussion on price. The
Four Main Tobacco Manufacturers hold very similar GSM. In 2009, JTI acquired a tobacco leaf
producer (as part of a strategy of vertical integration) so gained the ability to optimize the raw materials price reducing the variable costs associated with procurement and, thus increasing the sales margin. As a result, JTI drastically increased its GSM from 0.18 in 2010 to 0.59 in 2014, after periods of volatility in recent years. Currently, JTI is the tobacco manufacturer with the greatest ability to control the costs incurred to generate revenues reflecting superior operating efficiency. Thereby the GSM of the Four Main Tobacco Manufacturers stays constant with the exception of JTI66. Additionally, price pressure from consumers is also a relevant determinant of a tobacco manufacturer margin. Although is not the main explanatory factor it can influence the company GSM if they chose a portfolio more focused in low-proposition67 products. GSM shows medium influence in ROA disparities among the Four Main Tobacco Manufacturers.
Regarding the assets turnover (AT), ability to generate revenue from assets, all the Four
Main Tobacco Manufacturers show high volatility68 between the years 2004 to 2014 due to the
sharpened net revenue variance among manufacturers. The AT deviation between the first and last ranked manufacturer in 2014 was around 1.8 while in 2004 was just 0.9. Showing the highest AT
66 See appendix 9.13: Gross sales margin in the Four Main Tobacco Manufacturers. 67 Products in the low segment usually have lower prices sometimes called low-cost. 68 See appendix 9.14: Assets turnover in the Four Main Tobacco Manufacturers.
Page | 19
ratio (1.97), PMI is the tobacco manufacturer with the best assets utilization thus generating more sales per dollar of investment, on average. The weakest position belongs to JTI which shows the
lowest AT ratio (1.16). AT shows high influence in ROA disparities among the Four Main
Tobacco Manufacturers.
In resume, the ROA component with highest impact in the ROA deviations among the Four
Main Tobacco Manufacturers is the assets turnover. Whereas, other components have relative
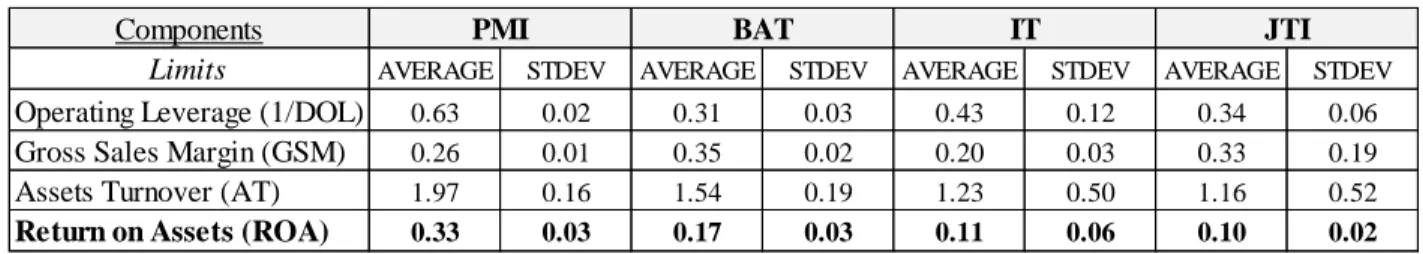
lower impact in ROA. Concerning the DOL and GSM, only one firm in each positively deviates from the herd, PMI and JTI, respectively. The JTI deviations in the GSM and AT ratio corroborates the conclusion drawn by Brealey, Myers & Allen (2011), who mentioned, that mergers usually increase the operating margin, but the positive effect in ROA is offset by a great reduction in firms’ AT. Moreover, IT and JTI are more volatile among the Four Main Tobacco Manufacturers across the time period studied, while PMI and BAT show higher and more stable results, especially in the AT and GSM ratios. According to Fairfield and Yohn (2001) future profitability can be forecasted based on changes in assets turnover and profit margin. Hence, the tobacco firms’ which probably will earn more profit in the future are PMI and BAT69. In the following part, ROA is appraised based on the drivers: firm-size and global value. Table 2 resumes the data analyzed above concerning ROA and its components among the Four Main Tobacco Manufacturers (2004-2014):
69See both appendix 9.13: Gross sales margin in the Four Main Tobacco Manufacturers; and appendix 9.14: Assets turnoverin the Four Main Tobacco Manufacturers.
Table 2: Summary of average and standard deviation values for ROA and its components for the years 2004 to 2014. AVERAGE STDEV AVERAGE STDEV AVERAGE STDEV AVERAGE STDEV
0.63 0.02 0.31 0.03 0.43 0.12 0.34 0.06
0.26 0.01 0.35 0.02 0.20 0.03 0.33 0.19
1.97 0.16 1.54 0.19 1.23 0.50 1.16 0.52
0.33 0.03 0.17 0.03 0.11 0.06 0.10 0.02
Components PMI BAT IT JTI
Limits
Operating Leverage (1/DOL) Gross Sales Margin (GSM) Assets Turnover (AT)
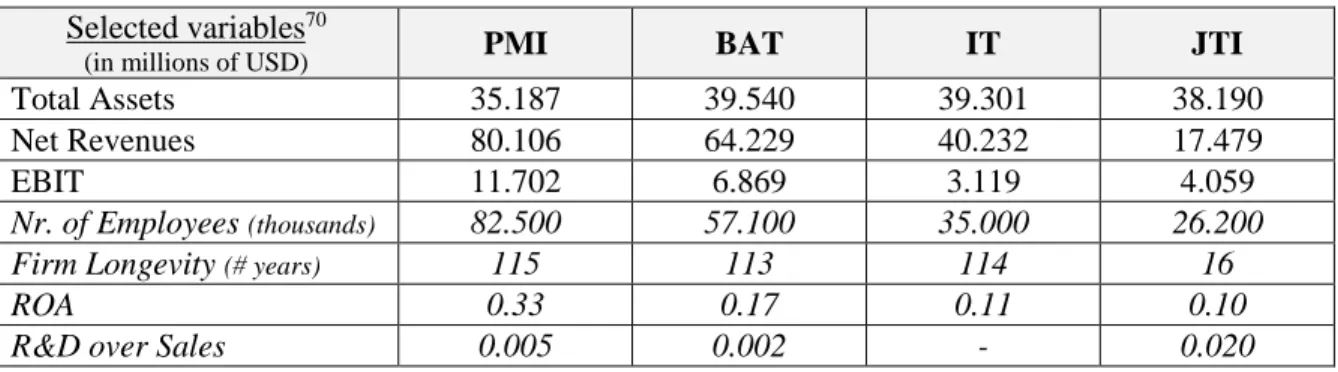
Page | 20 Table 3: Firm-size variables and financial ratios among the Four Main Tobacco Manufacturers in 2014.
5.2. Firm-size and global value impact in ROA (RQ.2 & RQ.3)
In this part the drivers which shape the ROA ratio are firm-size and global value. The variables chosen to quantify and analyze firm-size in the Four Main Tobacco Manufacturers are displayed in table 3:
Selected variables70
(in millions of USD) PMI BAT IT JTI
Total Assets 35.187 39.540 39.301 38.190
Net Revenues 80.106 64.229 40.232 17.479
EBIT 11.702 6.869 3.119 4.059
Nr. of Employees (thousands) 82.500 57.100 35.000 26.200
Firm Longevity (# years) 115 113 114 16
ROA 0.33 0.17 0.11 0.10
R&D over Sales 0.005 0.002 - 0.020
A relationship is found between firm-size and ROA. The largest tobacco manufacturers (PMI and BAT) which present higher values in firm-size (total assets, net revenues and number of employees) are also the ones with the higher ROA. An insight immediately withdrawn from the analysis of table 3 is that the ROA is positively influenced by net revenue and EBIT. The increase of net revenue and EBIT consequently results in a ROA gain to the Four Main Tobacco
Manufacturers under analysis. The EBIT difference among the Four Tobacco Manufacturers is
explained through differences in the companies’ net revenues. Net revenues are not only dependent on the quantity of cigarettes or tobacco products sold. It also depends on the outcome of the price strategy chosen71. Usually premium72 brands rely on higher margins thus providing more return
per unit of sale. The combination of a greater market share with more products in the mid-high segment definitely holds a positive impact on firm-size indicators, namely EBIT and net revenues.
70 Total assets, net revenues and EBIT in millions of USD. Number of employees in thousands and firm longevity in years. 71 e.g. PMI is the company among the Four Main Tobacco Manufacturers with highest market share and more brands in the mid-high segment so consequently is also the one with the mid-higher net revenue and EBIT.
Page | 21
Moreover, all Four Main Tobacco Manufacturers are very mature firms’ operating in an oligopoly so presenting very similar assets levels.
In terms of retail volume73, the Four Main Tobacco Manufacturers dominate all regions with the exception of Asia Pacific, where CNTC dominates. In North America, PMI (USA) is market leader. BAT and PMI are the only tobacco manufacturers with great impact in all regions. JTI is less relevant in North America, Latin America and Australasia, while IT is weak in Latin America and Asia Pacific. IT, however, leads both the global cigar and smoking tobacco74 markets. The most strategically important positions are PMI lead in Asia Pacific and BAT in Middle East and Africa (MEA)75. Finally, there is evidence to suggest that superior global value by tobacco manufacturers’ results in higher market shares leading to a better ROA. The tobacco manufacturers presenting higher ROA (PMI and BAT) are also market leaders in more regions of the world. PMI is market leader in four regions: North America, Western Europe, Eastern Europe and Asia Pacific (excluding China), while BAT is market leader in the remaining regions: Latin America, Australasia and Middle East and Africa (MEA).
Regarding R&D, JTI is the more recent tobacco manufacturer and, thus being less bureaucratic and more dynamic towards innovation presenting the higher value of R&D over Sales ratio. On the other hand is IT with no investment in R&D which put them in an unstable position in a long-term perspective.
5.3. Relationship between strategic choices and ROA (RQ.4 & RQ.5)
An assessment of the strategies implemented by the Four Main Tobacco Manufacturers is fundamental in order to understand the relationship between R&D and ROA in the tobacco
73 Shares of cigarettes.
74 Roll-your-own category and pipe tobacco.
Page | 22
industry. The Four Main Tobacco Manufacturers are currently investing heavily in reduced risk
products, which are considered to be the future for the tobacco industry. For instance, PMI designed
and is developing four modified risk products76, including the heat-not-burn technology. The Four
Main Tobacco Manufacturers desire to integrate their initiatives of products’ development within
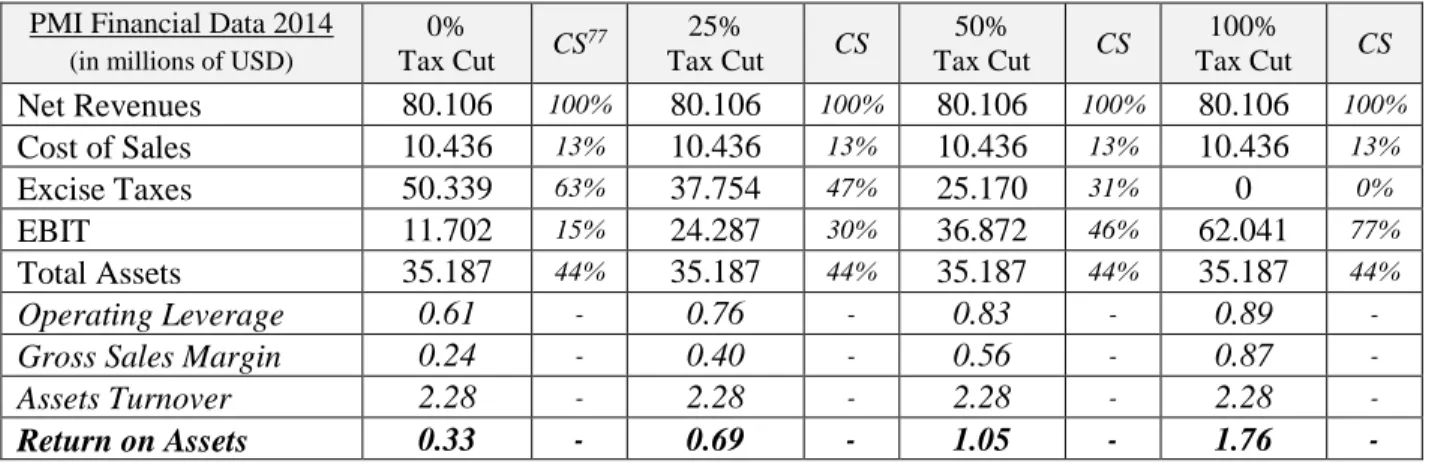
their portfolio with a risk assessment and aim at finding the "optimal regulatory pathway". Therefore, developing products which fits within existing regulatory framework and that can be marketed as a less harmful alternative to cigarettes will probably contribute to reduce the tax burden associated with cigarettes. Table 4 shows the probable effect of reduced risk products in a tobacco manufacturer’s financial results, in this case PMI.
PMI Financial Data 2014
(in millions of USD)
0% Tax Cut CS 77 25% Tax Cut CS 50% Tax Cut CS 100% Tax Cut CS Net Revenues 80.106 100% 80.106 100% 80.106 100% 80.106 100% Cost of Sales 10.436 13% 10.436 13% 10.436 13% 10.436 13% Excise Taxes 50.339 63% 37.754 47% 25.170 31% 0 0% EBIT 11.702 15% 24.287 30% 36.872 46% 62.041 77% Total Assets 35.187 44% 35.187 44% 35.187 44% 35.187 44% Operating Leverage 0.61 - 0.76 - 0.83 - 0.89 -
Gross Sales Margin 0.24 - 0.40 - 0.56 - 0.87 -
Assets Turnover 2.28 - 2.28 - 2.28 - 2.28 -
Return on Assets 0.33 - 0.69 - 1.05 - 1.76 -
The results shown in table 4 assume that the tax cut is equivalent to the percentage of consumers switching from traditional cigarettes to reduced risk products. Ultimately, as shown in table 4 investments in reduced risk products can be highly profitable to the Four Main Tobacco
Manufacturers and exponentially increase the ROA. The EBIT increases as excise taxes reduce,
visible by the common-size (CS). If, in fact, tax reductions would be applied to these innovations.
76 See appendix 9.16: The four Risk Reduce Platforms which PMI plans to commercialize.
77 Common-size: Items proportion in the income statement as a percentage of net revenues. Table 4: An example of the effect of reduced risk products on PMI financial results in 2014.
Page | 23
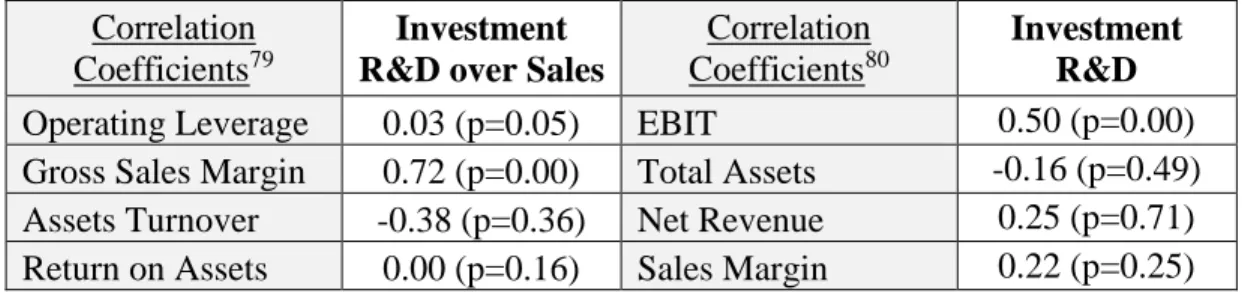
Table 578 shows the correlation analysis between R&D and ROA components. The R&D are
represented in the form of R&D over Sales ratio and R&D expenses, respectively.
The Four Main Tobacco Manufactures show almost no correlation between DOL and R&D over sales (R=0.03, p=0.05) because firms in the tobacco industry present a low R&D over sales ratio (0.9) and, thus investments in R&D does not creates additional heavier cost structures. Gross sales margin and R&D over sales present high correlation levels (R=0.72, p=0.00) with high level of significance due to the investments in R&D, which present higher probability of discovering new technology (e.g. e-cigarettes) and, thus, charge higher prices when holding new patents. Assets turnover and R&D over sales show negative correlation (R=-0.38, p=0.36) with low level of significance because the level of firms’ investment in R&D is negatively related to the way firms manage their assets. Total assets holds negatively correlation with R&D investment (R=-0.16, p=0.49) with low significance, while the net revenue and sales margin presents positive correlations with also low significance. The EBIT holds the highest correlation with high level of significance (R=0.50, p=0.00) because it is the closest variable to the disposable income which can be invested in R&D. Finally, there is no correlation between R&D over sales and ROA (0.00) because firms due to the novelty of some innovations have not yet collected the expected outcomes from R&D investments. In resume, firms presenting higher R&D over sales show a greater ability to increase
78 Data from the Four Main Tobacco Manufacturers, PMI, BAT, JTI and IT for the year 2004 to 2014. 79 See appendix 9.17: Linear regression for R&D over Sales using Stata 14 with significance level (p-value). 80 See appendix 9.18: Linear regression for R&D investment using Stata 14 with significance level (p-value).
Correlation Coefficients79
Investment R&D over Sales
Correlation Coefficients80
Investment R&D
Operating Leverage 0.03 (p=0.05) EBIT 0.50 (p=0.00)
Gross Sales Margin 0.72 (p=0.00) Total Assets -0.16 (p=0.49)
Assets Turnover -0.38 (p=0.36) Net Revenue 0.25 (p=0.71)
Return on Assets 0.00 (p=0.16) Sales Margin 0.22 (p=0.25)
Page | 24
GSM (0.72) yet the impact on AT and total assets is negative (-0.38) and (-0.16), respectively, due to the increase of cost structure. Therefore, R&D has no correlation with ROA (0.00).
6. Conclusion
The purpose of this Work Project was to study the disparities of ROA among the Four Main
Tobacco Manufacturers analyzing which DuPont Model components hold more influence in ROA
and how the following drivers: firm size, global value and strategic decisions, were influencing those components. It was found that firm-size and global value have a positive impact in ROA, namely through the sources of profitability: market share and price strategy. The largest tobacco manufacturers in term of firm-size and global value hold greater market shares and more high segment products and, thus shown higher ROA. The results also suggests that innovation through less harmful tobacco products leads to better ROA despite no correlation was found between R&D and ROA. Firms presenting higher R&D over sales showed a greater ability to increase GSM yet the positive impact on ROA is offset by the increase of cost structure. The results of this research were influenced by the increase of regulation in the time period analyzed (2004-2014). The challenge for future research will be to study the impact of the newly launched reduced risk
products in the profitability of tobacco manufacturers in the mature phase, namely the impact of
reduction in tax regulation in the ROA. Ultimately, tobacco is a commodity and, thus an object of almost universal consumption extremely proper subject of taxation despite the fact that it could be transformed in a less harmful product. The optimal and more rational pathway would be that the reduction in tobacco excise tax be a direct consequence of the reduction in healthcare expenses. According to Adam Smith in the Wealth of Nations, "Sugar, rum, and tobacco, are commodities
which are nowhere necessaries of life, [but] which are objects of almost universal consumption, and which are therefore extremely proper subjects of taxation".
Page | 25
7. References
Euromonitor International. 2015. Cigarettes: Global. Database accessed in September, 14th of 2015.
Eriksen, Michael, Judith Mackay, and Neil Schluger. 2015. The Tobacco Atlas. New York: World
Lung Foundation and American Cancer Society.
World Health Organization. 2015. WHO Report on the Global Tobacco Epidemic. Database accessed
in October, 5th of 2015.
World Health Organization. 2005. Article 6 - Price and Tax Measures to Reduce the Demand for
Tobacco, nº1 and 2 a). Geneva: Framework Convention on Tobacco Control.
Jha, Prabhat and Frank Chaloupka. 1999. Curbing the Epidemic - Governments and the Economics
of Tobacco Control. Washington D.C.: World Bank Publications.
Herciu, Mihaela, Lucian Belascu, and Claudia Ogrean. 2011. “A DuPont Analysis of the 20 Most
Profitable Companies in the World”. International Conference on Business and Economics Research, 1: 45-48.
Fairfield, Patricia, and Teri Yohn. 2001. “Using Assets Turnover and Profit Margin to Forecast
Changes in Profitability”. Review of Accounting Studies, 6(4): 371–385.
Bernstein, Leopold, and John Wild. 2000. Analysis of Financial Statements. New York: McGraw-Hill.
Revsine, Lawrence, Daniel Collins and Bruce Johnson. 1999. Financial Reporting & Analysis. New
Jersey: Prentice Hall.
Stickney, Clyde, and Paul Brown. 1998. Financial Reporting and Statement Analysis. New York:
South-Western College Pub.
Porter, Michael. 2008. “The Five Competitive Forces that Shape Strategy”. Harvard business Review,
86(1): 78-93.
Ittner, Christopher, and D. Larcker. 1997. “Product Development Cycle Time and Organizational
Performance”. Journal of Marketing Research, 34: 13-23.
Saffer, Henry, and Frank Chaloupka. 2000. "The Effect of Tobacco Advertising Bans on Tobacco
Consumption". Journal of Health Economics, 19(6): 17-37.
Kathleen, Dachille. 2012. “Using Law to Improve Public Health: The Example of Tobacco Regulation”.
Health Law Journal, 17(2): 32-37.
McDaniel, Patricia, and Ruth Malone. 2005. “Understanding Philip Morris’s Pursuit of US
Government”. British Medical Journal, 14: 193–200.
Yin, Robert. 1994. Case Study Research: Design and Methods. Newbury: Sage Publishing.
Albrecht, Steve, James Stice, Earl Stice, and Swain Monte. 2005. Financial Accounting. Chula Vista:
South-Western College Publishing.
H. Baker, and Gary Powell. 2005. Understanding Financial Management: A Practical Guide. Oxford:
Blackwell Publishing.
U.S. Department of Health and Human Services. 2012. Preventing Tobacco Use among Youth and
Young Adults: A Report of the Surgeon General. Atlanta: Center for Disease Control and Prevention.
Health Canada. 2006. A Proposal to Regulate the Display and Promotion of Tobacco and
Tobacco-related Products at Retail. Ontario: Physicians for a Smoke-Free Canada.
Philip Morris International - www.pmi.com - Website accessed in July, 15th of 2015.
British American Tobacco - www.bat.com - Website accessed in September, 23rd of 2015.
Japan Tobacco International - www.jti.com - Website accessed in August, 12th of 2015.