MASTER IN FINANCE
THIS REPORT WAS PREPARED EXCLUSIVELY FOR ACADEMIC PURPOSES BY PEDRO RIBEIRO HORTA, A MASTER IN FINANCE STUDENT OF THE NOVA SCHOOL OF BUSINESS AND ECONOMICS. THE REPORT WAS SUPERVISED BY A NOVA SBE FACULTY MEMBER, ACTING IN
A MERE ACADEMIC CAPACITY, WHO REVIEWED THE VALUATION METHODOLOGY AND THE FINANCIAL MODEL.
Trying to grow during an Asian takeover
A strategy of operational and geographic diversification
▪ The paper sector has been facing decreasing levels of
demand in some of its main products, especially in graphic paper.
However, it continues to be Navigator’s main source of revenues, as the UWF paper segment accounted for over 80% of total revenues in the last three years.
▪ Historically dominated by Europe and North America,
the paper and pulp sector has been suffering from growing levels
of competition, mainly originated by Asian and South American companies. Resulting in an accentuated imbalance in
the sector’s worldwide level of demand.
▪ The company’s strategy to face these adverse market conditions, has been focused on the operational and geographic
diversification of its activities, represented by the entrance in the
Tissue segment, Pellets business (USA) and Forestry investments (Mozambique).
▪ Navigator’s “stable” rating outlook, results of an historical solid financial performance, with emphasis on high levels of profitability (EBITDA margin over 20%) and a sustainable debt level (with the lowest ever cost of debt in short-term loans, 1.5%). ▪ It is recommended a BUY position, as the price target for the FY19 is 5.17 €, which represents a potential upside of 46.9%, when compared to the price of 3.52 € at December 21st.
Company description
The Navigator Company is the largest paper and pulp producer in Portugal and one of the largest in Europe. With a deep vertical integration, the firm is able to enjoy competitive production costs when compared to its peers. Accounting for 1% of the Portuguese GDP and 2.4% of exports of goods, Navigator is one of the most important companies in the Portuguese economy.
T
HE
N
AVIGATOR
C
OMPANY
C
OMPANY
R
EPORT
P
APER AND
P
ULP
21
D
ECEMBER2018
S
TUDENT
:
P
EDRO
R
IBEIRO
H
ORTA
[email protected]
Recommendation: BUY
Price Target FY19: 5.17 €
Price (as of 21–Dec–18) 3.52 €
Reuters: NVGR.LS, Bloomberg: NVG PL 52-week range (€) 3.38-6.01 Market Cap (€m) 2,493 Outstanding Shares (m) 717.5 Source: Bloomberg Source: Bloomberg 2017 2018F 2019F Revenues (€ millions) 1636 1589 1588 EBITDA (€ millions) 403.8 382.4 384.2
Net Profit (€ millions) 207.8 174.8 173.2
FCF (€ millions) 198.1 191.7 155.4 ROE (%) 17.5 14.6 14.2 D/E (%) 61.2 56.9 55.3 ROIC (%) 13.9 12.9 12.1 EBITDA margin (%) 24.4 24.1 24.2 EV/EBITDA (x) 11.1 11.5 11.4
THE NAVIGATOR COMPANY COMPANY REPORT
Table of Contents
COMPANY OVERVIEW ... 3 COMPANY DESCRIPTION ... 3 SEGMENT DESCRIPTION ... 4 STOCK PERFORMANCE ... 9 SHAREHOLDER STRUCTURE ... 11 THE SECTOR... 11 MACROECONOMIC OUTLOOK ... 11 PAPER SECTOR ... 13 PULP SECTOR ... 15 TISSUE SECTOR ... 17NAVIGATOR FINANCIAL PERFORMANCE ... 18
VALUATION ... 21 DCF ... 21 MULTIPLES VALUATION ... 25 SENSITIVITY ANALYSIS ... 26 RISKS ... 27 APPENDIX ... 28
THE NAVIGATOR COMPANY COMPANY REPORT
PAGE 3/33
Exhibit 3: Navigator’s main markets
Source: Company Report
x
Source: Company Report Source: Company Report
Company overview
Company description
The Navigator Company geneses goes back to 1975, with the foundation of Portucel – Empresa de Celulosa e Papel de Portugal, a firm whose core business was the production of paper and pulp. Its creation was a result of the unstable political and economic situation lived in Portugal, which led to the nationalization of the cellulose industry. Thus, Portucel was originated from the merger of several pulp, paper and packaging companies. This nationalization process would only begin to be inverted in 1995 – with the start of Portucel‘s privatization – and was only concluded in 2004, when the Semapa Group, one of the largest Portuguese industrial conglomerates – mainly focused in the areas of Pulp, Paper, Cement and Environment – acquired 67.1% of Navigator’s capital, becoming its biggest shareholder, a position preserved until today.
As one of the leading paper and bleached eucalyptus kraft pulp (BEKP) producers in Portugal, Portucel’s consolidation strategy focused on the acquisition of its peers Inapa Papéis (2000) and Soporcel (2001). These acquisitions lead to the creation of The Navigator Company, in 2001. Nowadays, Navigator is a vertically integrated forest producer that is present in every step of the production chain (R&D, Forestry, BEKP and Paper production). The firm uses its own forestry production to manufacture BEKP that will later be integrated in the production of its core end products – uncoated woodfree (UWF) and Tissue papers – or sold to the market. Navigator also presents itself as one of Portugal’s major energy producers, with a total power generation, in 2017, of 2,227 GWh, which accounted for 4% of the country’s total power output and 52% of the country’s total renewable energy generated from biomass. Navigator’s vertical integration has proved to be an important competitive advantage relative to its peers, as it reduces the firm’s exposure to the volatility of inputs’ costs, nevertheless, the firm’s forestry production is insufficient to face its paper and pulp demands, forcing Navigator to acquire a significant share of its inputs in the national and international markets.
The Navigator Company is the largest paper and pulp producer in Portugal and one of the largest in Europe, which is represented by its 3,197 employees and leading production capacities of BEKP and UWF printing and writing (P&W) paper. In 2017, Navigator reached 1.6 billion € in revenues due to the almost full utilization of its annual production capacities: 1.6 million tonnes of paper, 1.5 million tonnes of pulp (being 80% directly integrated in paper production and only 0.3 million tonnes sold to the market), 65 thousand tonnes of Tissue products
x
Exhibit 2: Revenues per segment, 2017 Exhibit 1: Navigator internal organisation
THE NAVIGATOR COMPANY COMPANY REPORT
and 2.5 Terawatts of renewable energy. Despite its dominant position in Portugal, Navigator is, above all else, an international company, as it exports 95% of its total production to 130 different countries. Nevertheless, all four industrial sites used by the company are located in Portugal:
• Figueira da Foz Industrial Complex, with a maximum production capacity of 650 thousand tonnes of BEKP, due to an expansion completed during the current year (the previous capacity was 580 thousand tonnes), the mill reached an all-time highest industrial output in 2017, with 593 tonnes of BEKP produced. It also has the capacity to produce 800 thousand tonnes of UWF P&W paper (having produced 771 thousand tonnes in 2017);
• Setúbal Industrial Complex, in the city where the firm’s headquarters are located, the complex has an annual production capacity of 550 thousand tonnes of BEKP (having produced 542 thousand tonnes in 2017). Paper production is distributed between two paper mills, the first, with an annual capacity for 275 thousand tonnes and the second, one of the most sophisticated in the world, with the capacity to produce 500 thousand tonnes of UWF paper per year;
• Cácia Industrial Complex, the only facility that exclusively produces BEKP, with an annual production capacity of 320 thousand tonnes. The BEKP produced in Cacia is not to intended to produce UWF paper, but to incorporate in special papers, such as, cigarettes, décor or tissue;
• Vila Velha de Ródão Factory, solely focused on the production of Tissue paper, it has an annual production capacity of 60 thousand tonnes.
Lastly, it is essential to understand Navigator’s importance in the Portuguese economy, as one of the country’s largest employing entities and electricity producers, Navigator exportations of 1.3 billion € correspond to 2.4% of the country’s total exports of goods. The firm’s contribution to wealth creation is quite significant, accounting for 1% of the Portuguese GDP. Also, in order to foster the sector’s growth in Portugal, Navigator gives priority to Portuguese suppliers, which account for 72% of the firm’s total suppliers.
Segment Description
UWF paperConstant technological evolution and a very mature market have been leading to a continuous decrease in the paper market’s demand, resulting in a 2% decrease in UWF paper sales in the first 9M of 2018, when compared with the same period
THE NAVIGATOR COMPANY COMPANY REPORT
Exhibit 5: Navigator’s Pulp segment revenues (in millions €)
Exhibit 4: Navigator’s UWF Paper operational data (in million tonnes)
Exhibit 6: Navigator’s Pulp operational data (in million tonnes)
last year. Even though, Navigator still presents itself as the largest UWF P&W paper producer in Europe and sixth largest in the world, with a 1.6 billion ton/year production capacity. Also, UWF paper has been Navigator’s most important segment over the years, accounting for more than 80% of total revenues in the last three years, being 35% of those revenues in the premium segment, where the brand “Navigator” is recognised as the leading premium office paper brand in Europe. Hence, Navigator presents significant market shares in the Western European paper segment, with 19% market share in UWF paper segment and 50% in the premium segment1.
Navigator’s core strategy in the paper segment is based on developing its own brands, taking advantage of its major brand awareness within the industry. Navigator assigns a brand to each type of paper product, having a total of 11 different brands2 that are divide in two different groups:
• Office paper, paper solutions for professional and home use; • Offset paper, paper solutions for the printing industry.
Pulp market
The Navigator Company produces several types of paper, inclusively, special papers tailored to each customer’s needs, meaning that, different types of paper require different types of pulp. The majority of pulp produced by Navigator is later incorporated in paper production (around 80%), being BEKP the most produced type of pulp, which is used to produce P&W paper and tissue products. The firm’s strategy in this segment is based on the use of a top-quality raw material –
Eucalyptus globulus – which characteristics allow to produce a distinctive
premium quality product. However, one major challenge faced by Navigator (and by the whole pulp sector), is the insufficiency of inputs, i.e., availability of wood. In particular, the beginning of 2018 was problematic to the sector, due to the lack of available wood in the world market.
Despite its main role of producing pulp to incorporate in paper production, in 2017, pulp sales accounted for 11% (180.5 million €) of the firm’s total revenues, which is equivalent to a 7% increase in the volume of pulp sold, relative to 2016. In the current year, pulp prices have been increasing, being predicted to remain high during the near future, backing up the increase in paper prices.
Recently, Navigator’s pulp production has been very close to its total capacity, creating the idea that the firm might be constraining its full potential. So, as part of the growth strategy initiated by the firm in 2015, two measures were taken:
1 The Navigator Company 2017 annual report
2 Navigator, Navigator Eco-Logical, Explorer, MultiOffice, Discovery, Inacopia, Target, Pioneer, Soporset, INASET and Navigator PrePrint
Source: Bloomberg Source: Bloomberg
THE NAVIGATOR COMPANY COMPANY REPORT
Exhibit 8: Navigator’s Tissue segment revenues (in million €)
Source: Q3 Company Report, 2018
Source: Company Report
• Expansion of the pulp production capacity at Figueira da Foz, completed during this year, passing from a total production capacity of 580 to 650 thousand tonnes of BEKP. Which represented a CapEx of 81.5 million €; • Inclusion of an option to build a large-capacity pulp mill in Mozambique,
following the new project of establishing a forestry base in the country.
Tissue
The Tissue segment is one of the most recent investments made by Navigator (2015), which began with the acquisition of the Tissue manufacturer AMS – BR Star Paper and its factory in Vila Velha de Ródão. This investment is in line with the firm’s strategy to diversify its operations beyond UWF paper. For Navigator, is crucial to look for new profitable growth opportunities, given its well established position in a mature market such as the paper and pulp’s, the company’s future growth depends on its ability to reinvent itself. Hence, the early investment in a sector that is growing between 2% and 3% every year3, is expected to originate
some competitive advantages.
Good initial results in this segment led the firm to, in the beginning of 2017, make a 120 million € investment in the construction of a new tissue line, with 70 thousand tonnes production capacity, integrated in the Cacia pulp mill (started to operate in September of 2018). With this new tissue line, Navigator doubles its tissue production capacity to 130 thousand tonnes/year of reels, making it the third largest tissue producer in Iberia. Also, the firm is able to achieve profitability levels above the market average due to its high level of integration, the direct integration of pulp production in tissue operations allow the firm to keep its cost structure very competitive, while offering a high-quality product.
This segment comprises three different end products:
• Reels, tissue rolls that are produced and then converted into finished products or sold to the market. It represented only 2% of total tissue sales in the first 9M of 2018;
• Away from home tissue products, tissue products for hygienic, healthcare and sanitary uses in public places (hospitals, hotels, or schools), such as towel paper or toilet paper. It represented 61% of total tissue sales in the first 9M of 2018;
• At home tissue products, tissue products for domestic hygienic, healthcare and sanitary use. It represented 37% of total tissue sales in the first 9M of 2018.
3 The Navigator Company annual report, 2017
Exhibit 7: Navigator’s Tissue sales by market
THE NAVIGATOR COMPANY COMPANY REPORT
Source: Company Report
Tissue segment revenues have been constantly increasing since 2015, reaching 74.4 million € in 2017. In the first 9M of 2018, Tissue sales were 65 million €, which represented an increase of 17% relative to the same period last year. This growth in tissue revenues has been driven by the increase in pulp prices, which, in turn, increased the average sales price (7%, relatively to last year’s).
Others (Pellets, Energy and Forestry)
In 2016, Navigator decided to reorganize its operational segments’ reporting, by creating the Tissue segment and integrating the Energy and Forestry business units in this new “Others” segment (later, the Pellets business unit was also included). The Others segment represents the smallest share on Navigator’s revenues, accounting for 2.3%, 2.2% and 3.3% of the firm’s total revenues in the last three years, respectively.
The Forestry business unit is the base of all other segments, producing wood that will be transformed in BEKP and then incorporated in paper production. Its output comes from woodlands in Portugal, owned or leased by the group, Navigator manages 112 thousand hectares, representing 3% of the country’s total forested area. The Forestry segment produces four different end products: eucalyptus wood, which is mainly integrated in the production of BEKP, Wood, Cork, and Pine that are sold to third parties. The Navigator Company also presents itself as the largest national producer of pine and one of the largest producers of Cork Oak. Even though, Navigator’s Forestry segment is exposed to a large scope of risks which have been constraining the firm’s total production potential:
• Low productivity of the Portuguese forests, since only a small proportion of Portuguese forests have the necessary accreditations and the worldwide demand for certified products is historically high;
• Risk of forest fires, these fires can result in the destruction of present and future inventories and, therefore, increasing Navigator’s costs of production. To avoid these incidents, Navigator invests, on average, 3.4 million €/year in protection against forest fires;
• Regulatory risk, high levels of regulation in the sector forces the firm to use external markets to acquire its inputs.
As already discussed, Navigator is the largest electricity producer in Portugal, producing around 4% of the country’s total power and 52% of the energy generated from biomass, this represents a production capacity of 2.5 TWh of electricity/year. However, in accounting terms, the energy business unit has a small weight on the firm’s operations. This only happens due to Navigator’s reporting strategy, only “Sales of electricity exclusively produced in units dedicated to the production of electricity from biomass are reported under the
THE NAVIGATOR COMPANY COMPANY REPORT
segment “Other” “4, energy sales of energy generated in the production of pulp
and UWF paper are reported in the Market Pulp and UWF paper segments. Therefore, in 2017, total energy sales were 166.7 million €, but only 21.5 million € were reported in the Others segment. In the first nine months of the current financial year, total energy production was 1.7% lower relatively to the same period in the previous year, however, total energy sales increased 2.9% due to an increase in Brent’s quote, the market index to which energy sales are indexed. The investment in the Pellets segment and, simultaneously, in the US market, was in line with the firm’s strategy to diversificate its operations and reduce the almost absolute weight of the UWF paper segment. The project required an initial investment of $120 million to build a state-of-the-art pellets mill in the USA with an annual production capacity of 500 thousand tonnes of pellets, which started its production at the end of 2016. Initially, the investment was seen as a big growth opportunity, due to the potential growth of the sector and the correlation with Navigator’s core business. However, an increase in the sector’s competition led to an imbalance in international demand, resulting in a negative impact on Navigator’s EBITDA of 16 million €. As a result, in December of 2017, Navigator sold its Pellets business unit to Enviva Holdings, for $135 million, recovering all its initial investment. During its operating year, the Pellets segment originated 14.6 million € in revenues, equivalent to 120.6 thousand tonnes of Pellets sold. It is expected that the exit from the Pellets sector will free up money to5:
• Continue Navigator’s diversification strategy, as this exit should not change the company’s strategic vision;
• Reinvest in the paper and pulp business units, where the firm has higher demand and competitive advantages;
• Keeping the reported net leverage ratio below 2.0x.
R&D (RAIZ) and Nurseries
Navigator’s forest holdings are considered to be one of its most valuable assets, being responsible for the feasibility of the firm’s operations. This recognition of the forest’s importance led to, in 1996, the creation of RAIZ, a non-profit research institute focused on applied research, technological consultancy and training. RAIZ main areas of investigation are eucalyptus, pulp, paper and forest-based bio refineries. With an annual budget of 3.5 million €, some of RAIZ main targets are: trying to improve the productivity of eucalyptus forests (one of Navigator’s main problems), increase the quality of fibre produced from wood, reduce the cost of wood production and implement a sustained forestry management, in
4 The Navigator Company annual report, 2017
5 “The Navigator’s exit from the Pellets business is credit positive”, Moody’s Investors Services
Source: Company Report
Exhibit 9: Total energy sales vs Energy sales reported in Others (in million €)
Source: Company website
Exhibit 10: Destiny of plants produced in Navigator’s Nurseries
THE NAVIGATOR COMPANY COMPANY REPORT
economic, environmental and social terms. RAIZ is also used as a link between Navigator and academia, through which they cooperate in scientific projects. In line with the goal of renewing and improving the Portuguese woodland, Navigator produces forestry and ornamental plants through its subsidiary, Viveiros Aliança (with three Nurseries in Portugal). These Nurseries are able to produce 12 million plants each year, making it one of the largest Nurseries for certified forest plants in Europe. As a result of the new project in Mozambique, a new Nursery is expected to be built in the country.
Mozambique Project
Just like the EUA, Mozambique is one of the countries identified by Navigator to its international expansion, however, also as the Pellets business, it has been facing several challenges. Despite the improvement in the country’s political and economic situations since 2016, they are still very vulnerable, which led the firm to moderate its investment pace in the country. Currently, the Mozambique project is, primarily, a forestry project – aiming the forestation of 356,210 hectares of land – with the possibility of building a large-scale pulp mill in the long-term, leading to an expected 10 million €/ year investment in the project6.
This project is only possible due to the participation of the International Finance Corporation (IFC), an arm of the World Bank, that recognizes the social impact that this project may have in improving life conditions in Mozambique (increase in jobs and improvement of health and education conditions). Despite the social perspective of the project, it presents significant economic opportunities to Navigator, based on the country’s high yield forests, competitive land prices and proximity to China, one of the most influent markets in the sector. Even though, as seen, the project is still in an embryony stage and faces significant political and economic risks, which led the firm to revaluate the recoverability of its investment in the country, “having recognised an impairment loss in such a way that in December 2017, its balance sheet value is residual (less than 1% of the total consolidated assets)”6.
Stock Performance
A listed company since 1995, at the time, still under Portucel identity, Navigator’s share capital is only traded in the Portuguese stock market – the Euronext stock exchange – with the ticker NVG, being fully represented by 717,500,000 ordinary shares. Is also part of the Portuguese stock market index (PSI-20), with a weight of 7.4% on it. Recently, Navigator’s stock performance has been characterized by high levels of volatility, when compared with the market performance (as we
THE NAVIGATOR COMPANY COMPANY REPORT
Source: Bloomberg
can see in exhibit 13). This volatility can be divided in two different periods, the first one, which started in 2015 and went until the third trimester of 2016, was driven by a negative growth trend, following closely PSI20 movements. While the second one, showed much better results, having started in the last trimester of 2016 and went until mid-2018. In 2017, Navigator achieved a total return of 42.2%7, this positive performance was a result of an overall good performance of
the sector and the Portuguese stock exchange. Also, the high and stable pulp prices and worldwide increase in paper prices sustained this growth. In 2017, Navigator also continued its dividend payment strategy, by making two payments during the year, in a total value of 250 million € (0.349 €/share).
Nevertheless, in the summer of 2018, Navigator’s stock value re-entered in a declining period, mainly driven by the unexpected announcement that the US Department of Commerce (USDC) would increase their tariffs over Navigator paper imports to 37.34%. According to Navigator, this new measure would have a negative impact of 66 million € on EBITDA and 45 million € on the firm’s net profits. Given the importance of USA in the global paper and pulp industry and, in particular, in Navigator’s business, Navigator’s stock price faced one of its biggest ever blows after this announcement. Still, after the firm’s protests, the tariffs rate was reviewed to 1.75% by the USDC, which made possible to recover usual demand levels in USA and stabilize Navigator’s stock market performance.
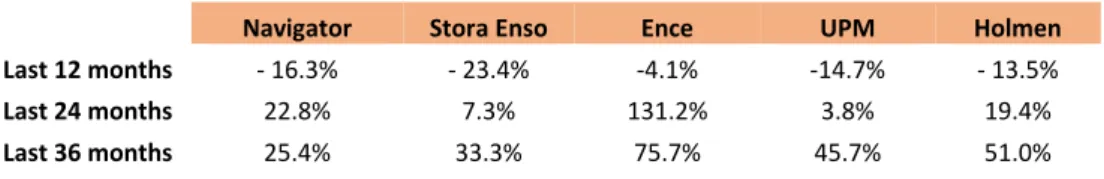
The year of 2018 was, for the stock market as a whole, one of the worst years since 2008. This negative performance was mainly driven by political and economic instability in some key countries – such as the trade war between USA and China –, which brought uncertainty and an increased level of volatility into the market. Within the paper and pulp sector, this reality is easily noticeable when comparing recent total returns (last 12 months) with previous total returns (last 24 and 36 months) of some of the main companies in the sector.
7 Source: Bloomberg
Exhibit 11: Annual average of Navigator monthly volume (in millions)
Exhibit 13: Navigator’s returns against PSI20 and EuroStoxx 600
Source: Company Report Source: Bloomberg
Exhibit 12: Navigator’s dividend payment (in million €) and dividend/share
THE NAVIGATOR COMPANY COMPANY REPORT
Note: Last 12, 24 and 36 months counting backwards from 21/ Dec/ 2018 Source: Bloomberg
Source: Bloomberg
Source: IMF, World Economic Outlook
Table 1: Historical stock market total returns
Shareholder Structure
Navigator shareholders can be splitted in 8 different entities (see table 2), being, since 2004, the Semapa Group its major shareholder (owning 69.35% of the share capital). The remaining capital is distributed between two types of shareholders: approximately 152 Institutional Investors, which account for 23% of the firm’s capital; and the outstanding 8% are owned by Retail Investors and other smaller non-identified investors. At the end of 2017, The Navigator Company owned 0.068% of its own shares.
Relatively to the geographical distribution of its institutional shareholders, most of Navigator’s shareholders are European (86%), in particular, Portuguese (60%). Also, USA and Norway investors hold significant positions on the firm, with 7% of institutional shareholders, each. In terms of investment style, there are two major strategies used by Navigator’s Institutional Investors: 69% of shares belong to Institutional Investors that pursue a growth-oriented strategy; while 22% uses Navigator’s shares to pursue an Index Funds strategy, this is, portfolios that are constructed with the aim of tracking market indexes (such as the S&P 500).
The Sector
Macroeconomic Outlook
In order to perform a meaningful macroeconomic outlook to Navigator, we have to take into account the firm’s international position. This is, despite having its operations located in Portugal, it exports around 95% of its production to 130 different countries, being Europe, Africa, North America and the Middle East its main markets. The years of 2015 and 2016 were marked by high political and economic instability, mainly driven by England’s announcement of the Brexit and the beginning of the Trump administration. Even though, in global terms, the world economy has been able to grow since mid-2016 and is expected that the period 2018 – 2019 will face similar growth levels that 20178. However, it is
8 “World Economic Outlook: Challenges to steady growth”, IMF
Navigator Stora Enso Ence UPM Holmen Last 12 months - 16.3% - 23.4% -4.1% -14.7% - 13.5% Last 24 months 22.8% 7.3% 131.2% 3.8% 19.4% Last 36 months 25.4% 33.3% 75.7% 45.7% 51.0% Shareholder % of capital Semapa 69.35% ZOOM INVESTMENT 2.00% BPI Bank 1.99% Norges Bank 1.66% Vanguard Group 0.93% Dimensional Fund 0.75% BlackRock 0.38% Free-float 22.93%
Table 2: Navigator’s Shareholder structure
Exhibit 14: Real GDP growth, by country group
THE NAVIGATOR COMPANY COMPANY REPORT
Source: IMF, World Economic Outlook; Analyst Estimates
Source: OECD, National accounts at a glance
Source: IMF, World Economic Outlook
projected that, after this positive period, growth rates will stagnate and keep stable (but relatively low) levels. There are other economic indicators that represent the improvement in the worldwide economy, such as the constant decrease in governments’ net debt value (in % of GDP) and unemployment rates. Global stock market performance in 2017, especially in the USA and Brazil, was also very affirmative, with shares growing, on average, 25%9. This positive
performance was fuelled by worldwide economic growth, an expansionist monetary policy followed by Central Banks and the recovery in oil prices.
The Portuguese macroeconomic situation has also improved, mainly due to the better conditions of the Portuguese economy, which led to an improvement in Portugal’s debt rating by S&P’s. Navigator’s sustainability depends on its ability to export its end products, given that only 5% of final production is sold in Portugal, therefore, its success relies heavily on the availability of its main markets to import goods. In exhibit 18, we can observe Navigator’s main markets and its respective yearly % change in the volume of imports of goods. The main highlights, for different reasons, go to Middle East and North America, the first one, due to its recent increase (expected to increase 12.45% between 2017 and 2018), and the second one, because it is one of Navigator’s main markets and its volume of imports of goods has been decreasing since 2015, and is expected to keep that trend in the near future. The African and European markets are expected to keep similar growth levels in their imports of goods, when compared to previous years. Finally, the Chinese market is included due to its increasing importance, both in the world economy and in the paper and pulp sector, which is shown by the increasing volume of imports of goods since 2016. Due to its growth potential, the Chinese market is a present and long-term investment of Navigator, that sees the country’s growing economy has an attractive business opportunity. This is also represented by the Mozambique project, that has the aim of increasing the firm’s geographic proximity to China.
Finally, the level of investment in Navigator’s main markets is expected to remain constant between 20% and 25% in % of GDP, except for China, where it is expected to be around 45% of the national GDP, which can be seen as advantage by firms that are expanding their operations to that geography. It is also important to notice the continuous increase in the worldwide level of household expenditures, from which Navigator can benefit through its UWF Paper and Tissue segments. In 2015, household expenditures grew by 2.41% and, in 2017, by 2.86%.
9 The Navigator Company annual report, 2017
Exhibit 16: Total investment, in % of GDP
Exhibit 17: Average growth rate of households’ expenditure
Exhibit 15: World’s governments net debt (% GDP) and unemployment rate
THE NAVIGATOR COMPANY COMPANY REPORT
Source: IMF, World Economic Outlook; Analyst Estimates
Source: Statista
Source: FOEX
Paper Sector
The paper sector, in the last years, has been characterized by the decreasing level of demand for its products, especially in Europe and North America. However, despite facing a challenging environment, in 2017, the paper industry as a whole was able to grow, mainly guided by the worldwide increase in paper prices. A sign of the sector’s growth is the current level of investment within the industry, which was not seen since 2005. From 2016 to 2017, investment in the Paper sector increased by 7.5%10. However, this increase in investment may
represent the increasing transformation of the industry, considered by many as a “traditional sector”, firms are trying to diversificate its operations in order to keep meaningful profitability levels. So, it is safe to assume that the paper industry is not disappearing, instead, it is going through a deep structural transformation. According to McKinsey&Company11, one other phenomenon that is marking the
sector is the increasing consolidation inside companies, this is, paper firms are focusing their activity in fewer segments, in which they are able to enjoy greater competitive advantages.
Paper sector’s demand has been recently affected by high levels of volatility, mainly due to two reasons: on one side, digital transformation has made obsolete some of the traditional paper industry products, decreasing its demand; and, on the other side, pulling demand up, emerging markets such as the Asian –mainly through China – and Latin American – mainly through Brazil – have been increasing its investment in the paper sector. Traditional paper products, such as graphic and P&W paper, have been suffering – and will continue to suffer – a decrease in their levels of demand. However, the paper industry is no longer solely dependent on P&W paper, other products’ increasing demands have been offsetting these decreases, “the packaging paper industry both industrial and consumer will rise and the household paper industry will maintain a stable
10 Source: Confederation of European Paper Industries (CEPI)
11 “Pulp, paper and packaging in the next decade: Transformational change”, McKinsey&Company
Exhibit 18: % change in the volume of imports of goods
Exhibit 19: Leading Forestry and Paper firms worldwide, based on market cap (in billion USD)
Exhibit 20: Average paper price evolution. Market index: A4 B-copy
THE NAVIGATOR COMPANY COMPANY REPORT
Source: McKinsey&Company Source: FAO database
Source: FAO database
development”12. When discussing worldwide paper demand, is important to refer
the role that China plays on it, given its weight in the sector, small increases or slowdowns in China’s level of paper demand may have a significant impact for the sector. Industrial packaging is one of the segments that enjoys more growth opportunities, given that it is closely related with one of the biggest online phenomena, online shopping. What was once referred as one of the main risks for the paper industry – digital transformation – is now creating alternative opportunities for the sector to grow. As we can see in Exhibit 23, packaging papers enjoy from a higher expected CAGR in its demand level, for the period 2016-2021, while graphic paper segment will keep its decreasing level of demand. In terms of geographies, as already discussed, the Asian and Latin American markets are the ones that show higher growth potential, while North America and Europe (except for Eastern Europe) are expected to either stagnate or decrease its demand levels.
The UWF Paper segment is one of the most important segments in the paper sector, accounting for 50% of the global demand of P&W paper13. The segment’s
worldwide production has been decreasing since 2014, when total production was 32.3 million tonnes, reaching 30.8 million tonnes in 2017. In the period of 2013-2017, Portugal was the 7th largest worldwide producer of UWF Paper, in
which Navigator’s production accounted for almost 100% of national production. The Asian region was, in 2017, the largest producer of UWF paper in the world, accounting for 47% of total production, followed by Europe (26%) and North America (20%). It is expected that Asia will keep on consolidating its position,
12 “2018 Credit Outlook for the Global Paper Industry”, Dagong Global Credit Rating
13 The Navigator Company results presentation, 9M 2018
Exhibit 23: Market demand across type of paper products and geographies Exhibit 21: Largest country producers
of UWF Paper (in million tonnes)
Exhibit 22: Global UWF Paper production (in million tonnes)
THE NAVIGATOR COMPANY COMPANY REPORT
Source: FAO database
Source: FAO database
Source: FAO database
given that it still presents plenty of room to grow and its level of paper consumption keeps increasing, while North America is expected to decrease its production quantity, as producers have recently started to shut down production capacity. The Latin American region is predicted to acquire a more significant position in the sector, given the growing competition that comes from countries like Brazil and Chile (home of some of the biggest companies in the sector). Given this overall outlook of the sector, the Food and Agriculture Organization (FAO) of the United Nations’ (UN) forecasts point to a constant annual increase in the worldwide production capacity of paper and paperboard in the future. Worldwide quantities of imports and exports of UWF Paper have been stable over the years, however, when analysing it by region, some conclusions about how the sector is changing can be drawn. Beginning with the North American market, historically, one of the biggest paper producers in the world, yet, recently, North American producers have been closing down production capacity, which has resulted in a decreasing production quantity of UWF Paper in the region. Also, this decrease in the production of UWF Paper transformed one of the largest paper producers into a net importer, this is, the North American market, since 2014, imports more UWF Paper than it exports, a clear sign of the declining trend in sector’s performance. In Europe, both imports and exports have been declining since 2014, though, the European market still presents itself as a net exporter, despite the difference between imports and exports being increasingly lower. The Asian market, as already discussed, is the market with higher growth potential and one of the most important within the sector, being already the second largest exporter of UWF Paper in the world (only behind Europe). Finally, in South America and Africa, the level of imports and exports of UWF Paper has remained constant over the last years.
Pulp Sector
In contrast with the paper sector, which has been guided by high levels of volatility and uncertainty, the pulp market has been enjoying a solid performance and is expected to keep that path. As a result of that strong performance, global production of pulp has been increasing since 2013, reaching 180 million tonnes in 2017. The year of 2017 was crucial for the pulp sector’s growth, which took advantage of favourable market conditions to consolidate its performance: constant increases in the benchmark index over the year – PIX BHKP, which increased 19% relatively to 2016 –, led worldwide pulp prices to increase; and, a 4% growth in global pulp consumption, mainly driven by the Chinese market14.
During 2017 and the beginning of 2018, the pulp market witnessed an increase in
14 The Navigator Company individual report and accounts, 2017
Exhibit 24: Global paper production distribution, per region, in 2017
Exhibit 25: Worldwide paper and paperboard production capacity forecast (in thousand tonnes)
Exhibits 26 and 27: North American and Asian UWF Paper production, imports and exports (in thousand tonnes)
THE NAVIGATOR COMPANY COMPANY REPORT
Source: FAO database
Source: Company results presentation, 9M 2018
Source: CEPI
its worldwide production capacity, however, this increase was not fully exploited due to several challenges faced by the sector in that same period. These problems were mainly due to significant constraints on world pulp supply, the lack of wood was an issue, but the numerous (expected and unexpected) production stoppages were the main cause for the lack of pulp in the market. In the first 9 months of 2018, overall pulp market conditions continued positive, in particular, worldwide demand for BEKP increased 4.7%, mainly driven by an increase in the Chinese market’s demand of 10.2%15. Worldwide pulp prices continued to
increase, guided by the increase in the reference market index, which was up by 24%, when compared to the same period in the previous year, leading pulp prices over $1000/ton16. In the near future, there are no expected significant
changes in the sector’s conditions, meaning that pulp prices and demand should remain at high levels. Nevertheless, current political and economic instability lived by two of the main players in the sector – USA and China – may cause imbalances in this sector’s performance.
North America presents itself as the world’s largest producer of wood pulp, accounting for more than 35% of total production, mainly due to USA and Canada, which are the first and third main producers of pulp in the world, respectively. In second place comes Europe (25.3% of total production), driven by Nordic countries’ production (Sweden and Finland), where some of the biggest companies in the sector are headquartered. The third and fourth regions with higher levels of wood pulp production are Asia and Latin America, respectively, however, both these regions have been recently increasing its weight in the global pulp sector. In terms of pulp’s international trades, both world imports and exports have been increasing rapidly since 2013, when analysing each region individually, final conclusions are similar to the ones discussed for the paper sector:
• Significant increase in the levels of imports and exports in Asia, especially in China. In the period 2013 – 2017, the Chinese market presented significant CAGRs for imports and exports of 5.6% and 38.4%, respectively17;
• South America’s weight on the global pulp market has been constantly increasing over the last few years, mainly guided by the growth in its levels of production and exports, presenting CAGRs of 5.2% and 7.2%, respectively (for the period 2013 – 2017)17;
15 Source: PPPC
16 The Navigator Company results presentation, 9M 2018
17 Source: FAO database and Analyst Estimates
Exhibit 28: Global Wood Pulp production (in million tonnes)
Exhibit 29: Historical pulp prices, in USD/ton and €/ton. Market index: PIX Europe
Exhibit 30: World total pulp production by region, 2016
THE NAVIGATOR COMPANY COMPANY REPORT
Source: FAO database
Source: RISI WTBM
Source: FAO database
• The level of pulp imports and exports in Europe and North America has not suffered any significant changes since 2013, allowing both regions to keep their historical net importer and net exporter conditions, respectively. Africa still plays a non-significant role within the industry.
Tissue Sector
The Tissue sector, as already discussed, is one of the sectors with highest growth potential within the Paper industry, in fact, recently, it has been enjoying an annual growth of 2% to 3%18 and annual increases in worldwide production
since 199419. This recent growth has been driven by the development of the
tourism sector, favorable economic conditions and, especially, a recovery in demand levels of strategical regions. Between 2006 and 2016, the Chinese market increased its consumption of Tissue products in more than 4 million tonnes, representing more than 40% of Tissue’s global growth for that period. In the same period, Europe, North and Latin America also contributed to the growth of the sector, with an increase in Tissue consumption of 1.5 million tonnes each. On average, Tissue consumption increased 3.5% per year, between 2006 and 201620. The continuous growth of the Tissue sector is being a much-needed
leverage for the paper industry’s performance, as it is offsetting the decreasing demand in traditional paper products. In terms of Tissue production, Asia has been increasing its total production quantity every year and, is currently the world’s largest producer of Tissue, accounting for 40.6% of its total production, followed by Europe (24.1%) and North America (22.5%)19.
In the first 9 months of 2018, worlwide Tissue prices were constantly increasing, however, companies were not able to take advantage of this increase due to two main reasons: on one hand, production costs have also increased, especially pulp prices, as analysed above, pulp prices were also constantly increasing in
18 The Navigator Company results presentation, 9M 2018
19 Source: FAO database
20 Source: RISI WTBM
Exhibits 31 and 32: Europe and North America total quantity of imports and exports (in million tonnes) geographies
Exhibit 33: World Tissue consumption by region, 2017 (in million tonnes)
Exhibit 34: Largest Tissue producers by country, 2017 (in million tonnes)
THE NAVIGATOR COMPANY COMPANY REPORT
PAGE 18/33
Source: FAO database
Source: FAO database
2018, which made more expensive for firms to produce Tissue products; on the other hand, given this sector’s present and potential level of growth, more firms want to be a part of it, leading to an increase in the level of competition (especially in Iberia). In the future, the Tissue segment is expected to keep growing, however, not in such an optimistic way as the one predicted by most companies. It is expected that the segment’s growth will be impacted by three main drivers21:
• Demographic evolution, the world’s total population is expected to
reach 9.7 billion people by 205022. More population implies more Tissue
consumption, has it is essential in people’s day-to-day activities;
• Consumer trends, trends in consuption are difficult to predict, even so,
for the Tissue segment, consumers should continue to demand increasing sustainability and convenience levels on its products;
• It is expected that the Tissue sector will grow at the same pace as GDP. In terms of commercial trades, the first highlight goes to the African region, due to the significant improvement in Tissue’s market conditions. Despite continuing a net importer, the African region has significantly increased its exports level, presenting a CAGR of 17.4%23 between 2013 and 2017. The Asian region –
largest producer of Tissue in the world – has been increasing its total production quantity every year and, in terms of imports and exports quantities, is only surpassed by Europe, which presents CAGRs for 2013 – 2017 of 13.7% and 11.5%, for imports and exports, respectively23. Europe and North America,
despite being the second and third largest producers of Tissue in the world, still present themselves as net importers, relying on the Asian market to fulfill their national markets’ demand of Tissue products.
Navigator Financial Performance
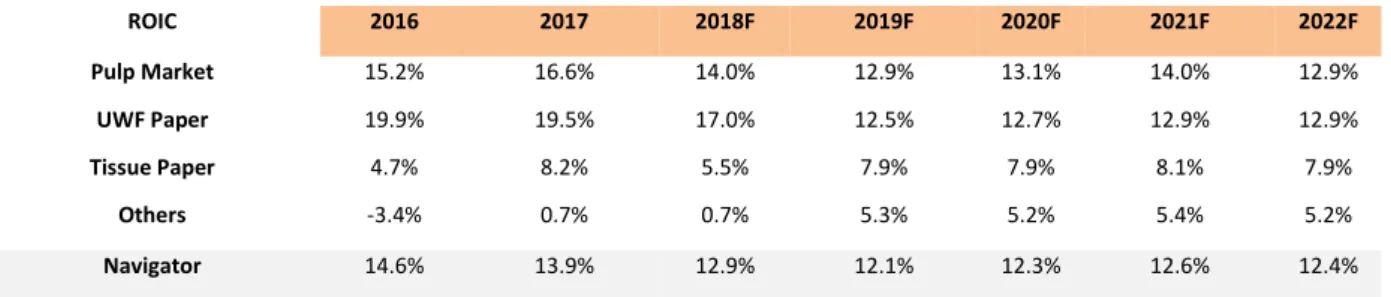
The Navigator Company has been, in the last years, a synonym of stability and return to investors, even though its recent stock performance not being positive. Navigator’s ROIC has been high and stable since 2016, and it is expected to remain like that in the near future. In order to access whether or not Navigator is able to create value to its shareholders, it is important to compare some financial metrics, such as: ROIC with WACC and ROE with Cost of Equity. A firm is able to create value when its ROIC/ROE is higher than its WACC/Cost of Equity. Navigator’s WACC has been ranging between 4.0% and 4.3%, while its ROIC, as
21 “Pulp, paper and packaging in the next decade: Transformational change”, McKinsey&Company
22 United Nations, Department of Economic and Social Affairs
23 Source: FAO database and Analyst Estimates
Exhibit 35: Largest Tissue producers by region (in thousand tonnes)
Exhibits 36 and 37: North American and European Tissue imports and exports (in million tonnes)
THE NAVIGATOR COMPANY COMPANY REPORT
Source: Bloomberg
v
shown in the table 3, has been much higher. This means that, in 2017, Navigator payed 4% for every extra euro of investment but had a return of 13.9%.
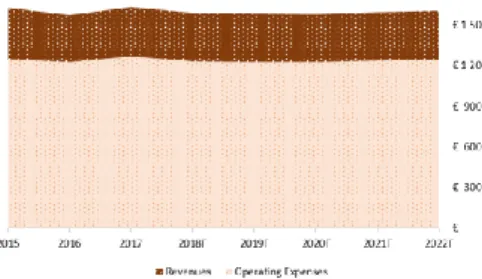
When comparing Navigator’s Cost of Equity and ROE, we end up with similar conclusions, i.e., a very positive capacity to create value from Navigator, having a very low Cost of Equity (6.6%), when compared to its ROE (see exhibit 38). Navigator’s EBIT and EBITDA are expected to face a smooth upper trend, being predicted to reach 250 million € and near 400 million € in 2022, respectively. This upper trend represents three key situations: the credit positive exit from the Pellets business (sold by $135 million, against a $120 million initial investment), impacting Navigator’s financial performance positively; expected positive impact of Navigator’s new operation in Mozambique; and, finally, the new Tissue plant that started to operate during this year. EBITDA and EBIT margins are also very significant, being close to 25% and 15%, respectively.
Credit Constraints
Despite the solid financial performance, Navigator’s ability to compete with the biggest firms in the sector is weak24, essentially due to what rating agencies
24“The Navigator Company – Update of key credit factors”, Moody’s Investors Services
ROIC 2016 2017 2018F 2019F 2020F 2021F 2022F Pulp Market 15.2% 16.6% 14.0% 12.9% 13.1% 14.0% 12.9% UWF Paper 19.9% 19.5% 17.0% 12.5% 12.7% 12.9% 12.9% Tissue Paper 4.7% 8.2% 5.5% 7.9% 7.9% 8.1% 7.9% Others -3.4% 0.7% 0.7% 5.3% 5.2% 5.4% 5.2% Navigator 14.6% 13.9% 12.9% 12.1% 12.3% 12.6% 12.4%
Exhibit 39: Navigator’s profitability levels
Source: Company Report, Analyst Estimates
v
Exhibit 38: Navigator’s historical ROETable 3: Navigator’s historical and forecasted ROIC
Source: Analyst Estimates
THE NAVIGATOR COMPANY COMPANY REPORT Legend: Sappi Stora Enso UPM Neenah Mondi PH Glatfelter International Paper Navigator
identifiy as: “credit challenges”. In Navigator’s case, these challenges are mainly related with three specific characteristics of the firm’s operations:
• Its modest size, which can be observed by Navigator’s low level of revenues, when compared with its peers;
• Limited product diversification, despite Navigator’s recent strategy for diversifying its operations beyond UWF Paper, more than 80% of its sales still come from a declining market, mostly concentrated in Europe; • Navigator major shareholder, Semapa, relies heavily on Navigator’s
dividends to finance its own dividends payment and large debt level. Which has been responsible for some restrictions in Navigator’s recent growth, due to: large payout ratios, large increase in dividends expenses and decreasing capacity of generating significant FCFs since 2015.
Credit Advantages
24Nevertheless, Navigator also presents strong competitive advantages relatively to its peers, which soften its credit constraints. These advantages are primarily related with its solid operational and financial results and investment strategy:
• Despite being too exposed to the UWF Paper sector, Navigator’s leading position in the European market and high level of vertical integration lightens the firm’s pricing pressure. Moreover, despite the decreasing level of demand in this segment, this decrease has been lower when compared to the decreasing demand in other paper products;
• Diversification strategy based on investing in growing sectors, without comprising its conservative capital structure (net leverage below 2.0x); • Finally, its strong profitability and credit metrics. Some examples are
Navigator’s D/EBITDA ratio (below 2.5x), low level of D/E and high EBITDA margin (above 20%). This is only possible due to: an efficient asset base; low maintenance capital spending needs, enabling the generation of high operating CFs; and its focus on the premium segment, giving Navigator some pricing power and protection against cheap imports from new competitive geographies (Asia and South America). Exhibit 42: Navigators profitability, compared with peers’ profitability
Source: Moody’s Financial Metrics Source: Company results presentation, 9M 2018
Exhibit 40: Navigator’s forecasted equity (in millions €) and D/E value
Exhibit 41: Navigator’s EBITDA evolution, 9M 2017 – 9M 2018 (in millions €)
THE NAVIGATOR COMPANY COMPANY REPORT
“The yield to maturity of a firm’s debt reflects the promised return of the bond, absent default. (…) [when there is risk] the debt yield will overestimate the debt cost of capital”
Jonathan Berk and Peter DeMarzo in
Corporate Finance
Valuation
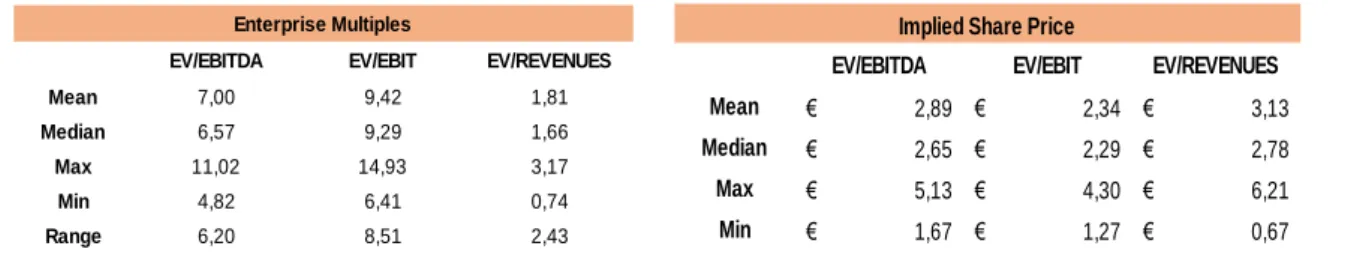
One of the main objectives of this report is to perform Navigator’s valuation, so, in order to execute it, it was used the Discounted Cash Flow (DCF) method, which requires the calculation of Navigator’s FCFs and Weighted Average Cost of Capital (WACC), to discount those FCFs. A Multiples Valuation was also performed, to understand how Navigator is performing relatively to the sector. Finally, to take into account the uncertainty that is present in some of the DCF analysis’ inputs, a Sensitivity analysis was held, considering possible variations in some key drivers of the forecasted share price.
The forecasted share price as of December 2019 for The Navigator Company is 5.17 €, which represents a total upside of 46.9%. Therefore, is recommended a BUY position on Navigator’s stock.
DCF
The DCF analysis was performed for a total period of 8 years, from which 5 are forecast years (2018 – 2022), after that period, FCF are expected to grow at a constant rate. In order to perform this analysis and reach the firm’s FCFs, it was needed to calculate an annual discount rate (WACC), as well as identify the firm’s main drivers and forecast its evolution. The main inputs and most important assumptions used during Navigator’s valuation are described below:
Cost of Debt
Companies’ cost of debt is often assumed to be equal to its debt’s YTM,
however, this methodology overstates the cost of debt, as the yield does not take default risk into account25. Therefore, in order to take default risk into account, an
adjustment in cost of debt’s calculation has to be done, using three variables: the YTM of Navigator’s long-term debt (1.2%), its annualized probability of default (1.6%) and the expected value of loss in case of default (46.2%)26. Using these
three inputs, cost of debt was calculated as: Rd = Yield – Prob. of default * Loss
given default25. Resulting in a cost of debt of 0.43%, also, the cost of debt was
assumed to remain constant over the analysed period.
The risk free rate used throughout this valuation procedure (0.38%) is based on the 10-year German government bond, mainly due to three reasons: it is perceived, by the market, as a risk free asset; it is geographically coincident with Navigator’s main market (as 64% of the firm’s activity is in the European
25 Source: “Corporate Finance”, Berk, Jonathan and DeMarzo, Peter
26 Calculated as: 1 – Average corporate debt recovery rate = 1 – 53.85% = 46.15%
Recovery rates vary according to the bond’s priority position, in this case, Sr. Unsecured Bond, implying an issuer-weighted recovery rate of 53.85%. Source: “Annual default study: Corporate default and recovery rates, 1920 – 2017”, Moody’s Investors Service
THE NAVIGATOR COMPANY COMPANY REPORT
continent); and, finally, because it is expressed in the same currency unit as Navigator’s cash flows (euro).
Cost of Equity
The cost of equity was calculated using the CAPM, which has as inputs the
risk-free rate, the market risk premium (MRP) and a beta (which represents the risk of Navigator’s stock relative to the market). The MRP, i.e., the difference between the return of investing in the market portfolio and the return of investing in the risk-free rate, is pointed by literature to be between of 4.5% and 5.5%27. Hence, it
was assumed a 5% MRP.
The calculation of beta was divided in two different steps, first, the raw beta was computed by regressing Navigator’s excess returns against a market index excess returns. The chosen market index was the EuroStoxx 600 (a diversified index composed of European firms), as Europe is Navigator’s main market and 86% of its shareholders are also European. In the second step, in order to smooth the estimate of beta, the adjusted beta was calculated (the one which is actually going to be used). Literature defends the need to smooth beta as a strategy to dampen “extreme observations toward the overall average”25. Hence,
the adjusted beta was calculated by using Bloomberg’s smoothing process: . Through this procedure, we get an adjusted beta of 1.24. When introducing the three inputs – risk-free rate, MRP and beta – into the
CAPM model, we obtain a Cost of equity of 6.6%.
Debt Value
The weight of debt in Navigator’s enterprise value was calculated, for the period
2015 – 2017, using Navigator’s reported financial information, after that, for the forecast period, the value of Debt/EV was assumed to be the average of the previous years’ values. The main reason behind this assumption, is that Navigator completed, in 2017, a process of debt restructuring, meaning that its debt level will decrease at a controlled pace in the near future. The measures that make this assumption possible were focused on five parameters:
• Increase in Navigator’s debt maturity, with a repayment plan that takes into account Navigator’s CapEx strategy. Which means that, in the medium-term, it is not expected that Navigator will have any refinancing needs; • Increase in the level of liquidity, through the issue of commercial paper
programmes, used to back up short-term financial needs;
27 Source: “Measuring and Managing the Value of Companies”, Mckinsey&Company
Source: Company Report, Analyst Estimates
Exhibit 43: Navigator’s forecasted debt value (in million €) and D/EBITDA (%)
THE NAVIGATOR COMPANY COMPANY REPORT
PAGE 23/33
Table 4: Navigator’s expected revenue growth rate
Exhibit 44: Navigator’s total revenues vs net income (in million €)
Source: Company Report
Source: FAO database, Analyst Estimates
UWF Paper BEKP Tissue Paper 2018 -2.6% -0.6% 1.8%
2019 -0.5% 0.8% 1.0%
2020 -0.7% 0.9% 0.6%
2021 -0.1% 6.4% 0.4%
2022 0.7% -0.7% 0.5%
• New interest rate risk management strategy, based on issuing variable rate debt and then contracting interest rate swaps with fixed rate debt, reducing financing costs;
• Cost optimisation, allowed a cut in the average cost of debt, represented by the lowest ever interest rates in short-term loans by the end of 2017 (1.5%); • Diversification of financing sources (several national and international
banks), which is only possible due to Navigator’s solid financial performance and its ratings’ long-term “stable” outlook: BB by S&P and Ba2 by Moody’s.
Revenues
Revenues are, perhaps, Navigator’s main driver, with approximately 1.6 billion €
in 2017, its forecast is one of the most important aspects when forecasting the firm’s future results, as several other components are directly related with its absolute value and growth rate. For a more precise and correct approach, revenues were divided according to Navigator’s operational segments. Navigator is one of the biggest paper and pulp firms in Europe, nevertheless, recently, it has been suffering from an imbalance in the demand of its main product (UWF Paper). This imbalance results of an increase in competition, especially from Asia and South America, where firms are able to produce with lower production costs. So, is expected that graphic paper firms will keep suffering significant pressure to restructure their production capacities and face decreasing levels of demand28.
One of the most important determinants of paper and pulp prices are its worldwide production capacities. So, future evolution of production capacities will impact paper and pulp prices and, therefore, impact Navigator’s future revenues in those segments. In order to incorporate this variable into revenues’ forecast, it was assumed that each segment’s revenues will grow at the same rate as the segment’s world production capacity. The FAO database presents forecasts until 2022 of the world’s production capacity evolution in the UWF paper, Tissue paper and BEKP segments, that closely track the expectations that have been discussed throughout this work. This is, a constant decrease in UWF paper sales in the near future, a constant and smooth increase in BEKP sales and also a constant increase in Tissue’s sales, representing the segment’s growth potential. The exception is the forecast of the “Others” segment revenues, which are mainly
composed by the revenues of the Forestry, Energy and Pellets business units. These revenues were assumed to be growing at the average rate of the previous years. The main reason for this assumption is related with the historical small and constant weight of this segment’s revenues on the firm's total revenues (between 2% and 3%). However, it was excluded from the growth rate calculation the
THE NAVIGATOR COMPANY COMPANY REPORT
Source: Company report, Analyst Estimates Source: Company Report
Source: Company Report, Analyst Estimates
Pellets effect, as this business unit was sold at the end of 2017 (only generated revenues for 1 year). Therefore, its seasonal effect was not taken into account when calculating the growth rate of this segment’s future revenues.
CapEx and Net Working Capital
The CapEx segment is composed of PP&E, which, in a firm like Navigator, is
predominantly comprised of industrial units and machinery used in those units. The investment in CapEx, whether to increase or decrease the production capacity, to buy new machinery or even to promote changes in industrial units, is directly related with the results obtained by the firm. This is, in a scenario of growth and prosperity, Navigator may feel the need to increase its production capacity, by buying more machinery or building new industrial units (and the opposite case in a scenario of decreasing results). As revenues are one of Navigator’s main drivers and the firm’s CapEx is not expected to suffer significant changes in the near future, it was assumed, for the forecast period, that CapEx weight relative to revenues would be equal to the average of last years’ weights. The Working capital segment of Navigator is mainly composed by four items:
Inventories, Operating cash, Receivables and Payables. From these items, the main remark goes to Inventories, as the only caption that has been constantly decreasing in recent years, especially from 2016 to 2017, with a decrease of over 20 million €, mainly due to a large reduction in the value of finished products (in inventory) and to an even bigger increase in the net balance payable amount to the State and Other Public Entities (43 million €). Regarding the other captions, the value of Payables and Receivables has been increasing at a smooth rate, while the value of Operating Cash has been constant over the last years.
Usually, Working Capital is directly related with the level of revenues, this is, an increase in revenues leads to an increase in Working Capital needs. In order to take this relation into account, working capital was distributed across segments based on the percentage of revenues attributable to each segment. Naturally, the main share of Working Capital is attributed to the UWF Paper segment, as it is Navigator’s segment that generates more revenues.
When forecasting working capital components, there were three different situations: the first one, operating cash, which is always calculated in the same scheme, 2% of total revenues; Inventories, which are forecasted in the same way as CapEx, this is, assuming that its weight, in percentage of revenues, is equal to the average of last years’ weights; and, finally, Receivables and Payables, that are calculated as the average number of days that Navigator needs to receive from clients and pay its obligations, respectively.
Exhibit 46: Navigator’s CapEx distribution per segment Exhibit 45: Navigator’s CapEx evolution, per segment
Exhibit 47: Navigator’s NWC components (in million €)